Signs of powdery mildew infection include white, powdery or dusty areas on leaves (photos courtesy Jack Kelly Clark, University of California Statewide IPM Program.)
Sulfur applications in winegrape vineyards can kill powdery mildew spores that have not yet caused infection, kill incoming spores and cut down newly established colonies.
Sulfur has a long history of controlling powdery mildew, said UCCE Viticulture Advisor Larry Bettiga. In a UC Ag Expert webinar, Bettiga said sulfur was first used in 1850 to control powdery mildew. More sulfur is used in vineyards than any other major type of pesticide.
Powdery mildew has two spore types. Chasmothecia spores overwinter and cause initial spring infections. Conidia spores cause growing season infections. Powdery mildew begins on grapevine leaves as chlorotic spots on the upper leaf surface. Signs of the pathogen appear a short time later as white, webby mycelium on the lower leaf surface. As spores are produced, the infected areas have a white, powdery or dusty appearance. On fruit or rachises, the pathogen may colonize the entire berry surface.
Benefits of sulfur use in vineyards include good efficacy for powdery mildew control. There is low potential for resistance development by the pathogen. Compared to fungicides, sulfur applications cost less and they are acceptable in organic and biological production systems. Sulfur also helps with suppression of other pest populations.
Negatives of sulfur applications include increased potential for hydrogen sulfide production, drift from dust application and the potential for plant tissue toxicity, and it can be detrimental to some natural enemies. The potential for sulfite production during fermentation can be avoided if sulfur treatments end in the vineyard five weeks prior to harvest.
Sulfur applications are also less costly than synthetic fungicide applications. At a rate of 15 pounds per acre and adding the cost per acre for application, Bettiga said the total was less than $20 per acre. This was compared to Rally, Quintec and Pristine at $51.60, $53.92 and $74.60 per acre, respectively.
In an evaluation of sulfur and other fungicide tank mixes, after six applications, sulfur treatments alone resulted in 2.8 affected berries per cluster while tank mixes scored one or less.
Efficacy is influenced by the mode of action phase. As a contact, sulfur is not influenced by temperature. As a vapor, activity below 59 degrees F is very limited.
Density of foliage and canopy management will also affect efficacy of sulfur and other fungicides. Sprayer settings, including travel speed, volume and velocity of air, nozzle selection and droplet size, and nozzle orientation to canopy play a part in an effective application.
On fruit or rachises, the pathogen may colonize the entire berry surface (photo courtesy Jack Kelly Clark, University of California Statewide IPM Program.)
Carrot field under furrow irrigation system in the Imperial Valley (all photos by A. Montazar.)
Carrots are one of the 10 major commodities in Imperial County, with an average acreage of nearly 16,000 over the past decade. The farm gate value of fresh market and processing carrots was about $66 million in 2019. In the low desert region, fresh market and processing carrots are planted from September to December for harvest from January to May. Most carrots are typically sprinkler irrigated for stand establishment and subsequently furrow irrigated for the remainder of the growing season. However, there are fields that are irrigated by solid set sprinkler systems the entire crop season.
Carrot is a cool-season crop that demands specific growing conditions and effective use of nitrogen (N) and water applications for successful commercial production. N and water management in carrot is crucial for increasing crop productivity and decreasing costs and nitrate leaching losses. The N needs of carrots for optimum storage root yield depends on the climate, soil texture and conditions, residual soil N from the previous season and irrigation management. There is not enough research on N management to free local growers of the worry associated with being short on the amounts applied, which may cause a loss in yield and profitability. The industry needs reliable information on N and consumptive water use of carrots to optimize irrigation and N management, enhance water and nitrogen use efficiency and achieve full economic gains in a sustainable soil and water quality approach.
This study aimed to quantify optimal N and water applications under current management practices and to fill knowledge gaps for N and water management in carrots through conducting experimental trials in the low desert of California. This article presents some of the information developed for desert fresh market carrots.
Field Trials and Measurements
Field trials were conducted on fresh market carrot cultivars at the UC Desert Research and Extension Center (DREC) and four commercial fields in the low desert region during the 2019-20 and 2020-21 seasons (Table 1). The sites represent various aspects of nitrogen applied (N applications ranged between 176 and 272 lbs ac-1), irrigation water applied (varied from 1.6 to 2.9 ac-feet/ac), irrigation systems (three fields under sprinkler irrigation and two fields under furrow irrigation) and soil types (sandy loam to silty clay loam).
Table 1: General information for the experimental sites. Plants were established using sprinkler irrigation at all sites.
The DREC trials consisted of two irrigation regimes and three nitrogen scenarios (Fig. 2). At the commercial sites, due to logistical limitations, the measurements were carried out from five sub-areas selected (50 feet x 50 feet) in an experimental assigned plot (400 feet x 400 feet) with a homogeneous soil type, which was the dominant soil at the site. These areas represented common irrigation and N fertilizer management practices followed by growers.
Figure 2: The DREC trials consisted of two irrigation regimes and three nitrogen scenarios.
The actual consumptive water use (actual crop evapotranspiration (ET)) was measured using the residual of the energy balance method with a combination of surface renewal and eddy covariance equipment (fully automated ET tower, Fig. 3). As an affordable tool to estimate actual crop ET, Tule Technology sensors were also set up at all experimental sites. The Tule ET data were verified using the ET estimates from the fully automated ET tower. Canopy images were taken on weekly to a 15-day basis utilizing an infrared camera (NDVI digital camera) to quantify crop canopy coverage over the crop season. Actual soil nitrate content (NO3-N) at the crop root zone (one to five feet) and the total N percentage in tops and roots were determined pre-seeding, post-harvest and monthly over the season. Plant measurements were carried out on 40-plant samples collected randomly per replication of each treatment/sub-area, and determinations were made on marketable yield and biomass accumulation. Fresh weight and dry weight of roots and foliage were measured on a regular basis.
Figure 3: Monitoring stations in one of the commercial experimental sites.
Findings and Recommendations
Irrigation Management
The common irrigation practice in carrot stand establishment in the low desert is to irrigate the field every other day using sprinkler systems during the first two weeks after seeding. Carrots germinate slowly, and hence, the beds need to be kept moist to prevent crusting. A comparison between the averages of applied water and actual consumptive water use for a 30-day period after seeding suggested that carrots are typically over-irrigated during plant establishment. An average of 3.8 inches was measured as actual consumptive water use for this period across the experimental sites (Fig. 4), while the applied water varied from two to three times of this amount.
Figure 4: Cumulative actual crop water consumption (actual ET) at each of the experimental sites. Surface renewal actual daily ET is reported here.
The results clearly demonstrated that the carrot sites had variable actual consumptive water uses depending upon early/late planting, irrigation practice, length of crop season, soil type and weather conditions. For instance, site C-4 was a sprinkler irrigated field with a dominant soil texture of sandy clay loam where the carrots were harvested very late 193 days after seeding (DAS). The seasonal consumptive water use was 19.2 inches at this site (Fig. 4). Our results show that the seasonal crop water use of fresh market carrots is nearly 16.0 inches for a typical crop season of 160 days with planting in October. Approximately 50% of crop water needs occurred during the first 100 days after seeding and the other 50% during the last 60 days before harvest. Crop canopy model developed in this study demonstrated that fresh market carrots reach 85% canopy coverage by 100 days after seeding.
The amount of water that needs to be applied in an individual field depends on crop water requirements and the efficiency of the irrigation system. Assuming an average irrigation efficiency of 70%, the approximate gross irrigation water needs of carrot fields in the low desert would be 2.0 ac-feet/ac (pre-irrigation is not included) for a 160-day crop season. Pre-irrigation along with proper irrigation scheduling over the season may effectively maintain crop water needs and salinity in carrots.
Figure 5: Canopy development curve for the low desert fresh market carrots over the growing season.
Water stress should be avoided throughout the carrot growing cycle. The critical period for irrigation is between fruit set and harvest. Sprinkler irrigation may be considered as a more effective irrigation tool when compared with furrow irrigation. More frequent and light irrigation events are possible by sprinkler irrigation. Over-irrigation of carrot fields increases the incidence of hairy roots, and severe drying and wetting cycles result in significant splitting of roots. Sprinklers also reduce salinity issues which is important since carrots are very sensitive to salt accumulation.
Nitrogen Management
The results demonstrated that a wide range of N accumulated both in roots and tops at harvest (Fig. 6). For instance, a total N content of 312.9 lbs ac-1 was observed in a fresh market carrot field with a long growing season of 193 days, including 202.9 and 110.0 lbs N ac-1 in roots and tops, respectively. The total N accumulated in plants (roots + tops) was less than 265 lbs ac-1 in the other sites.
A linear regression model was found for the total N uptake in roots after 60 to 73 DAS without declining near harvest (Fig. 6). Small, gradual increases in N contents of roots were observed until about 65 DAS. This suggested that N begins to accumulate at a rapid rate between 65 and 80 DAS; however, the period of rapid increase could vary depending on early (September) or late (November) plantings. N uptake in tops increased gradually following a quadratic regression, and in most sites levelled off or declined slightly late in the season. Although the N accumulated in tops appeared to drop down or level off in most sites beyond 120 to 145 DAS, the N content decline occurred after DAS 155 at site C-4 with a longer growing season.
Figure 6: N accumulation trends in storage roots, tops and total (plants) over the growing season at the experimental sites.
These findings suggest that a total N accumulation of 260 lbs ac-1 occurred by 160 DAS, with 145 lbs ac-1 in roots and 115 lbs ac-1 in tops. Across all sites, nearly 28% of seasonal N accumulation occurred by 80 DAS (Fig. 6) when the canopy cover reached an average of 67% (Fig. 5). The large proportion of this N content was taken up during a 30-day period (50 to 80 DAS). The results also suggest that nearly 50% of the total N was taken up during a 50-day period (80 to 130 DAS). This 50-day period appears to be the most critical period for N uptake, particularly in the storage roots, when carrots developed the large canopy and the extensive rooting system. The majority of N is taken up during the months of December to February, and, hence, proper N fertility in the effective crop root zone is essential during this period. For a 160-day crop season, 22% of N uptake could be accomplished over the last 30 days before harvest.
Carrots have a deep rooting system that allows for improved capture of N from deep in the soil profile. The fibrous roots were present at the depth of five feet below the soil surface at site DREC-2 (Fig. 7). There is a risk of leaching soil residual N due to heavy pre-irrigation (a common practice for salinity management in the low desert) in late summer prior to land preparation. N is likely accumulated at the deeper depths by the beginning of the growing season, and consequently, there is a potential N contribution from the soil for carrots when the roots are fully developed. Since residual soil N contribution can be considerable in carrots, pre-plant soil nitrate-N assessment down to 60 cm depth could be a tool enabling farmers to improve N management and maximize yield and quality while minimizing economic and environmental costs.
Figure 7: Carrot storage and fibrous roots system at site DREC-2.
Careful management of N applications in the low desert carrots is crucial because fertilizers are the main source of N, particularly due to low organic matter content of the soils and very low nitrate level of the Colorado River water. Knowing this fact, the soil NO3-N contents pre-seeding and over the growing season at different sites revealed that none of the sites had N deficiency during the crop season, and consequently, the practice of splitting N applications, as done by the farmers (applying 9% to 15% of total seasonal N as pre-plant and the remainders through irrigation events over the season), was likely effective in most cases. It appears that the practice of 15% to 30% seasonal N applications though irrigation events 45 to 70 DAS has similar effectiveness to sidedress N applications.
Within the range of N application rates examined at the experimental sites, there were no significant relationships between carrot fresh root yield and N application rate, although the results suggested a positive effect of N application on carrot yield. Sufficient N availability in the crop root zone over the growing season and the lack of significant yield response to N applications demonstrate that N optimal rates could be likely less than the applied amounts in most sites. Adequate nitrogen and water applications reduce costs and help prevent leaching, while excess N may lead to excessive N storage in the roots, which may be a concern for processing carrots. Integrated optimal N and water management needs to be approached to accomplish greater N and water efficiency, and consequently keep lower rates beneficial to overall profitability.
Funding for this study was provided by California Department of Food and Agriculture (CDFA) Fertilizer Research and Education Program (FREP) and California Fresh Carrots Advisory Board.
Maintaining AMF colonization in grapevine roots is particularly important for vineyards in Oregon’s Willamette Valley where red-hill soils are most commonly found.
Nitrogen (N) is one of the most managed nutrients in vineyards, since it strongly affects vine growth and fruit development. Although numerous studies have been conducted to understand how N fertilization influences vine productivity and fruit composition, the impacts of N on vine nutrient status and soil microbes receive less attention.
Among a wide range of soil microbes that play vital roles in soil health and vine productivity, arbuscular mycorrhizal fungi (AMF) are unique due to their symbiotic association with grapevines and their contribution to vine nutrient acquisition. Arbuscular mycorrhizal fungi obtain nutrients from the soil, especially for phosphorus (P) and other poorly mobile nutrients, and transfer those nutrients to the plant. In turn, plants provide sucrose and fatty acids to AMF to support fungal functions and growth.
To sustain intensive nutrient exchange between two partners, AMF colonize individual cortical cells of fine roots and form arbuscules, which are tree-like fungal structures that greatly increase surface area contact between plants and AMF (Fig. 1). Grapevines are considered a “super” host of AMF. The percentage of fine roots colonized by AMF is generally above 60% in field and greenhouse conditions. Such high colonization rates also reflect the great dependency of grapevines on AMF. Indeed, non-mycorrhizal vines are stunted in low P soils, while mycorrhizal vines could acquire adequate P from the soil, overcome P limitation and grow normally.
Figure 1: Grapevine roots colonized by arbuscular mycorrhizal fungi (AMF). Red arrow indicates arbuscules, “tree-like” structures that vastly increase surface area contact between the host plant and the fungus (photo courtesy Dr. R. Paul Schreiner, USDA-ARS.)
Willamette Valley Trials
Maintaining AMF colonization in grapevine roots is particularly important for vineyards in Oregon’s Willamette Valley where red-hill soils are most commonly found. Since those highly weathered acid soils have low P availability, grapevines rely on AMF for ample P acquisition. In other crops, N fertilization was shown to reduce root colonization by AMF, but it is unclear whether N applied at moderate rates would decrease mycorrhizal colonization in grapevines. If N applications would suppress AMF and impair vine P uptake, this negative effect should be accounted for when developing fertilization management plans for vineyards. This article summarizes part of my Ph.D. research conducted in Oregon, which explored how vineyard N applications affect vine nutrient status, root growth and AMF.
Experiments were conducted in a Chardonnay vineyard and a Pinot noir vineyard over three years in Willamette Valley. Both vineyards are somewhat limited by N but have varying levels of soil P. At each site, we evaluated three treatments, including no N application (No N), N applied to the soil (soil N) and N applied to the foliage (foliar N). Each treatment was replicated four times. The soil N vines were fertilized two or three times between bud break and veraison using UAN-32 at the rate of 40 to 60 lbs N/acre/year. The foliar N vines received three urea sprays to the canopy from fruit set to two weeks post veraison at the rate of 19 to 23 lbs N/acre/year.
All treatments were evaluated across three years in both vineyards with the exception that foliar N treatment was assessed only in Year 2 and 3 in Chardonnay. In each season, leaf blades and petioles were sampled at bloom and veraison for nutrient analysis. Due to the late initiation of foliar N treatment in Chardonnay, bloom leaf samples were collected only in Year 3 for this specific treatment. Soils and roots were sampled three times a year when berries were pea-size, near veraison and about a month after harvest.
Effects of Soil N Applications in Chardonnay
As expected, soil N applications increased vine N status starting from Year 1 (Fig. 2). For simplicity, only petiole nutrient data at bloom are presented here. Changes of nutrients in corresponding leaf blades followed a similar trend. Previous work on Pinot noir in the Willamette Valley proposed 0.7% as the critical value of petiole N concentration at bloom to ensure sufficient yield (2.5 to 3.5 U.S. ton/acre) and adequate fruit N.
Figure 2: Effect of nitrogen (N) applications to the soil and the foliage (soil N and foliar N) on petiole N and phosphorus (P) concentration at bloom in Chardonnay. Vines that received no N application (no N) served as the control. Means followed by different letters indicate significant differences between treatments in each experimental year based on a t-test or Tukey HSD test at 95% confidence.
Since Chardonnay vines in this region generally carry heavier crop load (four to five U.S. ton/acre) and develop larger canopies compared to Pinot noir vines, Chardonnay vines may have a higher N requirement. With a petiole N concentration of 0.6% at bloom, Chardonnay vines that received no N applications clearly experienced some N limitation in this study. Soil N applications improved bloom petiole N concentration by 15% to 30%. In response to greater vine N status, the soil N vines had 30% higher yield and about 35% more pruning mass as compared to the no N vines.
Soil N applications decreased vine P status in Chardonnay in Year 2 and 3, where petiole P concentration at bloom was about 30% lower in the soil N vines than no N vines (Fig. 2). The negative effect of soil N fertilization on vine P status became more evident in late season. The concentration of petiole P at veraison decreased 50% in the soil N vines in the last two years of the experiment.
Why did soil N applications reduce vine P status? The most straightforward answer would be the dilution of P in leaves due to N stimulated canopy growth. However, this is unlikely the sole reason. Soil N applications increased veraison leaf area by 10% to 19% in Year 2 and 3, while the corresponding leaf blade P decreased to a larger extent (19% to 29%). The second possible explanation for the decreased leaf P under increased soil N supply is that fertilization altered P allocation within the plant and less P was translated above ground. Indeed, because soil N fertilization increased root growth (Table 1), more P can be retained belowground to support new root development. Yet, this assumption is not supported by our observation in the greenhouse or previous studies where soil N fertilization generally increases the proportion of P allocated to aboveground tissues. Unfortunately, we did not sample roots for nutrient analysis in this study, and thus effects of soil N on root P concentration cannot be further examined. In addition to the two explanations presented above, we suspect that soil N applications might lower AMF colonization in roots and therefore decrease vine P uptake.
The percentage of fine roots colonized by AMF (fungal hyphae, arbuscules, vesicles and spores) decreased with soil N supply in Year 2 and 3 (Table 1), in accordance with reduced vine P status in Chardonnay. The percentage of roots colonized by arbuscules also reduced in the soil N vines in Year 2, but not in Year 3. The greater suppression of arbuscular colonization in the soil N vines in Year 2 was likely attributed to the fact that more N (20 lbs N/acre) was applied in Year 2 than Year 3. Clearly, increased root growth played a role in the decrease of AMF in the soil N vines because root colonization usually lags behind root growth. Soil N fertilization might affect AMF through other mechanisms as well. For example, N fertilization could reduce the amount of carbon translocated from vines to AMF and, in turn, decrease P delivered by the fungus. Or soil N supply reduced N translocated from AMF to vines, resulting in a decrease of mycorrhizal colonization.
Table 1: Effects of N applications to the soil and foliage (soil N and foliar N) on root density and colonized by arbuscular mycorrhizal fungi (AMF) in Chardonnay. Vines that received no N application (no N) served as the control. Means followed by different letters indicate significant difference between treatments in each experimental year based on a Tukey HSD test at 95% confidence.
Effect of Soil N Applications in Pinot Noir
Similar to what we observed in Chardonnay, soil N applications improved vine N status in Pinot noir across three years (Fig. 3). Soil N fertilization also increased root growth and decreased mycorrhizal colonization in Pinot noir, although the effects were less evident as compared to Chardonnay (Table 2). The percentage of roots colonized by AMF was lower in the soil N vines than no N vines in two of three years, while the percentage of roots colonized by arbuscules reduced in the soil N vines only in one year.
Even though soil N altered mycorrhizal colonization, it had no influence on leaf blade or petiole P concentration at bloom or veraison in any year, except petiole P concentration at bloom was lower in the soil N vines than no N vines in Year 2 (Fig. 3). Even so, P concentration of corresponding leaf blades was not affected by soil N supply, suggesting an overall small impact of N fertilization on vine P status in Pinot noir. The difference in how vine nutrition and mycorrhizal colonization responded to soil N application between Chardonnay and Pinot noir can be attributed to the difference in soil N and P availability.
Compared to the Pinot noir vineyard, the Chardonnay vineyard has lower soil N and higher P concentration. It seems soil N fertilization would suppress AMF colonization and decrease vine P status to a greater extent in vineyards with lower N and higher P availability.
However, since the Chardonnay and Pinot noir vineyards differ in many other aspects, such as canopy size, irrigation and cropping level, the comparison between these two varieties are not straightforward. Thus, upon the completion of field experiments, we conducted a series of greenhouse experiments to further examine how N and P regulate vine nutrient status and mycorrhizal colonization under a more controlled environment. The negative effect of soil N applications on AMF was observed again in vines supplied with N at a high rate in the greenhouse.
Figure 3: Effect of N applications to the soil and the foliage (soil N and foliar N) on petiole N and phosphorus (P) concentration at bloom in Pinot noir. Vines that received no N application (no N) served as the control. Means followed by different letters indicate significant difference between treatments in each experimental year based on a t-test or Tukey HSD test at 95% confidence.
Effect of Foliar N in Chardonnay and Pinot Noir
Foliar N applications had minor influence on vine N status, vine P status, root growth, and mycorrhizal colonization in both varieties (Figs. 2 and 3, Tables 1 and 2). This is somewhat expected, since a large amount of N applied to the foliage appeared to be transferred to the fruit rather than other plant organs.
Table 2: Effects of nitrogen fertilization to the soil and foliage (soil N and foliar N) on root density and colonized by arbuscular mycorrhizal fungi (AMF) in Pinot noir. Vines that received no N application (no N) served as the control. Means followed by different letters indicate significant difference between treatments in each experimental year based on a Tukey HSD test at 95% confidence.
Conclusions
The evidence obtained from the field experiments indicates that soil N fertilization at moderate rates can negatively influence mycorrhizal colonization and reduces the benefits conveyed by this symbiotic relationship. Foliar N applications, on the other hand, had no impact on AMF or vine P status. The negative effect of soil N applications on mycorrhizal association provides another justification for being judicious with N fertilization in vineyards.
This project was funded by Oregon Wine Board and USDA-ARS. The author would like to thank Erath winery and Results Partner Inc. for their help and support.
Runoff and wind erosion from agricultural fields introduces excess phosphorus and nitrogen to freshwater and marine environments. Nutrient loading causes algal blooms and eutrophication, killing off fish and destabilizing the entire ecosystem.
Phosphorus (P) availability limited food production and human population until the Green Revolution. After the second World War, mineral fertilizers and powerful new pesticides drove record yields and exponential world population growth. While nitrogen fertilizer usually takes all the credit, phosphorus is a close second, and even the major limiting element under some conditions. Mining P-rich ore introduced more P to the biosphere than ever before. Instead of relying on biological P cycling, mineral fertilizer now keeps our fields productive through years of back-to-back planting. P fertilizer provides undeniable improvements to yield and crop quality, but leaks in the system destabilize surrounding ecology, causing a cascade of effects that shift global P cycling. With fertilizer prices on the rise and environmental impact mounting, everyone can benefit from improving P management.
All living organisms require P. It constitutes about 9% of our DNA, it is the backbone of the phospholipid fatty acids giving our cells their structure, and P is a critical component of Adenosine Triphosphate (ATP), the powerhouse of the cell. Plants take up most of their P via the roots as the anion phosphate (P2O43-). Crops require lots of P early in development to support rapidly growing cells. P is required at every stage of growth, first to support DNA transcription and translation, then to build the cellular structure and to supply energy needed to carry out all the activity. Ensuring early access to enough plant-available P drives vigorous root growth and sets the crop up for success.
Activity and Availability
P bioavailability limits many natural ecosystems, and plants have evolved several ways to gain access to the essential element. P is immobile in soil, and most of it is tied up in mineral pools with very little available as phosphate in soil solution. Some P minerals are very stable and resist dissolution. Others readily dissolve with slight adjustments in pH or enzyme activity. Plants and fungi take advantage of the labile mineral pool by excreting phosphatase and lowering the pH in their direct vicinity. Mycorrhizal fungi bond with plant roots, extending their hyphae far past where the plant can reach to bring back phosphorus and water in exchange for photosynthate. Soil organic matter also stores P, and microbial activity releases phosphate into solution according to population dynamics and access to carbon and nutrients.
Most P fertilizer recommendations are based on observed crop response to fertilization at different soil P concentrations. Many studies in the western region show that crop yield and quality increases when fertilizer is applied to soil with less than 40 ppm P measured by the Olsen test. Soil containing 40 ppm P holds roughly 180 lbs plant available P2O5 in the upper six inches. Celery takes up about 100 lbs of P2O5 per acre, and about 70% of the P is removed from the field with the harvested crop. Soils with 100 ppm P have 460 lbs P2O5 per acre down to six inches, providing more than five times the P demand of most vegetable crops. Most crops send roots below six inches, gaining access to even more P.
Phosphorus fertilizer gives crops immediate access to P, circumventing the slower biological cycling. Phosphoric acid, monoammonium phosphate and other sources initially spike soil solution phosphate, but the effect does not last. In calcareous and high-pH soils, P eventually disappears from the plant available pool as it binds with calcium to form the mineral apatite. Under acidic conditions, phosphate precipitates with iron and aluminum hydroxides. The P fixation rate depends on many factors, including pH, temperature, moisture and the concentration of other compounds in soil solution. Growers apply more P fertilizer every year to meet immediate crop needs, even though total soil P levels continue rising.
Likelihood of crop response to phosphorus fertilizer (adapted from Geisseler, Daniel. (2015). California Fertilization Guidelines. Fertilizer Research and Education Program. http://geisseler.ucdavis.edu/Guidelines/Home.html.)
Environmental Impacts
While adsorbed P might not be accessible to the crop, the extra nutrition disproportionately impacts freshwater and marine environments when it escapes the farm via runoff or wind erosion. Relatively small increases in P concentration in lakes, streams and ocean water cause major ecological shifts. High N and P levels induce eutrophication by triggering algal blooms that block sunlight from penetrating the water’s surface layer. Unable to photosynthesize, aquatic plants die and sink to the bottom, introducing an overabundant food supply to microorganisms. Aerobic metabolism depletes the water’s oxygen concentration as microbes decompose the plant material. Oxygen diffusion down to lower depths can’t keep pace with the consumption rate. Hypoxic zones drive away or kill off fish, and the aquatic ecosystem unravels, leading to permanent dead zones under the worst conditions.
Researchers point to organic matter as the solution to almost every soil quality challenge, and phosphorus is no exception. Increasing soil organic matter and microbial activity helps prevent erosion and increases the bioavailability of P already in the soil. Microbial metabolism releases carbon dioxide, dissolving calcium phosphate minerals. Enzymes and organic acids also liberate phosphate, while mycorrhizal networks mine phosphorus from parts of the soil profile that plant roots cannot reach. Meanwhile, microbial activity and organic matter build soil structure, forming stable aggregates that resist erosion from water and wind. One major windstorm can blow away an inch of topsoil carrying away valuable phosphate fertilizer. Soil with 100 ppm P concentration holds almost 80 pounds of plant-available phosphate in the upper inch of soil. Many fields have accumulated P to well over 200 ppm, doubling or tripling the cost of eroded P.
Phosphorus fertilizer is a valuable tool and a mainstay of almost every fertilizer regimen. Increased yields and reasonably priced fertilizer keep growers applying mineral P every season. While a heavy P application may have significantly increased yield the first couple of years, continued applications at the same rate may have little effect. Soil tests can help determine baseline P content and the soil’s adsorption capacity. Water quality, soil pH and calcium content affect how quickly P fertilizer precipitates out of the plant-available pool. Management practices like splitting P into several applications or applying it with an organic amendment can help keep a steady supply of P in plant-available form. Like most agricultural challenges, the best solutions are multipronged, with many little adjustments adding up to dramatically improve the big picture. Better P management will protect our freshwater and marine environments, enhance crop quality and even save growers some money.
References
Brady, Nile C. and Weil, Ray R. (2008). The Nature and Properties of Soils. Fourteenth Edition. Pearson Prentice Hall.
Filippelli, Gabriel. (2008). The Global Phosphorus Cycle: Past, Present, and Future. Elements. 4. 89-95. 10.2113/GSELEMENTS.4.2.89.
Liu, Guodong, Li, yuncong, & Gazula, Aparna. (2019). Conversion of Parts Per Million on Soil Test Reports to Pounds Per Acre. University of Florida Extension. https://edis.ifas.ufl.edu/publication/hs1229
Wyant, Karl A., Corman, Jessica R., & Elser, James J. (Eds.). (2013). Phosphorus, Food, and our Future. Oxford University Press.
Researchers found that hemp appears to be tough under deficit irrigation, a method of conserving water by applying less than what might be considered optimum for maintaining rapid growth (all photos courtesy B. Hutmacher.)
UCCE and UC Davis research efforts to understand the opportunities and challenges for industrial hemp production in California are growing.
As a crop relatively new to California growers and researchers, there is still much to learn about variety choices, how varieties and crop responses differ across regions with different soils and climates, best practices for nutrient management, and pest and disease issues.
Industrial hemp field research efforts began at the University in 2019 after the previous year’s Farm Bill declared the crop should no longer be considered a controlled substance, but rather an agricultural commodity. Hemp is valued for its fiber and edible seeds; however, in California, producing hemp primarily for essential oils, including medicinal cannabidiol (CBD), is thought to offer the best economic outlook. U.S. and California hemp acreage surged in 2019, but fell in 2020.
Hemp Water-Use Study Expands
In a study coordinated by Jeff Steiner of Oregon State University’s (OSU) Global Hemp Innovation Center, drip irrigation trials are underway in California, Oregon and Colorado. Research was conducted in 2020 at the UC West Side Research and Extension Center in Five Points and at the UC Davis campus in addition to three sites in Oregon, with an additional site in Colorado added in 2021. These studies were set up to determine water use of industrial hemp for CBD production under irrigation regimes ranging from about 40% to 100% of estimated crop water requirements, with comparisons of responses observed across the five sites with different soils, climate and other environmental conditions.
The study, funded by USDA and OSU, includes photoperiod-sensitive cultivars, where the flowering response is triggered by shortening day lengths in mid- to late summer in central California, and auto-flower varieties that do not require shortening day length to flower.
Some of the irrigation treatments impose moderate to more severe deficit irrigation to help assess the crop responses to water stress. Deficit irrigation is a method of conserving water by applying less than what might be considered optimum for maintaining rapid growth.
“This plant appears to be quite tough under deficit irrigation,” said UCCE Specialist Bob Hutmacher at the UC WSREC.
“We need to learn more about benefits and drawbacks to stressing the plants,” Hutmacher said.
The auto-flower cultivars tested tend to use less water than the photoperiod-sensitive cultivars because they can be grown in a shorter season. In the San Joaquin Valley, auto-flower cultivars in these studies were ready for harvest in 75 to 90 days after seeding.
“Water use is very variety-specific” Hutmacher said. “Auto-flower varieties may have potential to be grown in the spring and harvested by early summer, or planted in late summer and harvested before winter. With a short-season crop, and with a decent water supply, farmers could consider double-cropping with such varieties, potentially increasing profits.”
Yields were variable, but showed promise for auto-flower varieties.
“In our studies, the highest-yielding auto-flower cultivars have produced 80% to 90% of yields of the much larger full-season, photoperiod-sensitive plants, and some varieties may be equal,” he said.
Hemp Planting Density Studies
In cooperation with Kayagene Company of Salinas, Dan Putnam, UCCE forage crops specialist at UC Davis, and Hutmacher have conducted studies in 2019 and 2020 with two auto-flower varieties to determine the effect of plant density on crop growth, yield and chemical concentrations. Since some of the auto-flower varieties are smaller and earlier maturing than many photoperiod-sensitive cultivars, data in these studies will help determine the tradeoff between higher densities needed to increase yields versus increases in the cost of higher seeding rates.
A key concern for growers is producing a crop with economic levels of CBD or other compounds of commercial interest, while staying within regulatory limits for THC (tetrahydrocannabinol), the psychoactive compound found in marijuana, a related plant. According to CDFA, an industrial hemp crop grown in the state may have no more than 0.3% THC when plant samples are analyzed.
“This is a challenge for growers. You don’t want to risk too high a THC level,” Hutmacher said. “Farmers must test to make sure THC is at a level to meet regulations. If it’s too high, CDFA regulations would require the crop be destroyed.”
Another study is using data from 2019 and 2020 to help determine the tradeoff between higher densities needed to increase yields versus increases in the cost of higher seeding rates.
The studies provide opportunities for the scientists to assess plant-to-plant variation and impacts of flower bud position on THC and CBD concentrations. The data collected across a range of cultivars differing in plant growth habit may help better inform both researchers and regulatory groups in decisions regarding how to monitor plant chemical composition.
Hutmacher and Putnam are also working with commercial companies to test lines in the field, including Arcadia Biosciences in Davis, Phylos Biosciences in Portland and Front Range Biosciences in Salinas.
“There are a lot of challenges when it comes to estimating maturity with these varieties,” Putnam said. “Each variety will mature at different times, and deciding when is the best time is a key decision. We’re still learning about this issue.”
In 2021, in variety trials also coordinated by OSU’s Global Hemp Initiative Center, data will be collected from studies at up to 12 locations ranging from Oregon, Washington and California in the West to New York, Vermont and Kentucky in the eastern U.S. to compare varieties grown for CBD and other essential oils.
“Our participation in these multi-site trials is important in efforts to identify across very diverse environments and latitudes the plant response in terms of attained levels of CBD and THC,” Hutmacher said.
Launch of Hemp Fertilizer Project in 2021
As a new crop in California, little is known about crop nitrogen needs and application optimization to prevent environmental problems related to overuse. In 2021, a team of UC Davis researchers are launching a three-year nitrogen management trial supported by the CDFA Fertilizer Research Education Program (FREP). An important part of the project is THC and CBD analysis, a costly enterprise.
Three companies are providing seeds or clones for the project: Cultivaris Hemp of Encinitas, Kayagene of Salinas and Phylos Biosciences of Portland. Alkemist Labs of Garden Grove is donating services for analyzing crop samples.
“These are incredibly valuable donations to assist with this project, certainly in excess of $50,000 in donated materials and services from each of those companies,” Hutmacher said. The collaboration with the donors makes the development of environmentally sound nitrogen optimization information for growers possible together with the money provided by CDFA-FREP for the trials.
If the label includes phrases such as “use of an adjuvant may improve results” or “complete coverage is needed for best results,” then you may want to look into selecting and using an appropriate activator adjuvant (photo courtesy F. Niederholzer.)
Agricultural spray adjuvants are materials added to the spray tank when loading the sprayer. They include products classified as activator adjuvants and marketed as wetters/spreaders, stickers, humectants and/or penetrators. Activator adjuvants are marketed to improve the performance of pesticides and foliar fertilizers.
Activator adjuvants can have a place in tree and vine crop sprays, but matching the material to the job can be tricky. A bad match can lead to minor or major losses to the grower. Minor losses can result from excess spreading and pesticide runoff from the target plant. Phytotoxicity can cause major damage.
This article describes ingredients and functions of activator adjuvants commonly sprayed on tree and vine crops. Suggestions regarding activator adjuvant selection are offered. Growers must make their own activator adjuvant use decisions based on experience, particular needs and risk tolerance.
When to Use an Activator Adjuvant
Read and follow the specific instructions on the label. If the pesticide or foliar fertilizer label indicates the product should be used with a certain type or brand of adjuvant(s), that’s what you need to use. For example, the Bravo Weather stik® label cautions against using specific adjuvants and puts the responsibility on PCA or grower court regarding adjuvant use.
If the label includes phrases such as “use of an adjuvant may improve results” or “complete coverage is needed for best results,” then you may want to look into selecting and using an appropriate activator adjuvant.
Before proceeding with use of an activator adjuvant, first look at your existing spray program. Are you already doing the best spray job you can? Good spray coverage begins with proper sprayer calibration and setup. Is your sprayer calibration dialed in for different stages of canopy development? Optimum sprayer setup (gallons of spray per acre, ground speed, fan output and nozzle selection/arrangement) changes from dormant to bloom to early growing season to preharvest sprays. Adjusting your sprayer to best match orchard and vineyard conditions at each general stage in canopy development is the foundation of an effective, efficient spray program. An activator adjuvant will not make up for excessive tractor speed, poor nozzle arrangement and/or worn nozzles. Your money is best spent first dialing in your sprayer(s) for the whole season before considering an extra material in the tank that is not required on the label.
If you have your sprayer(s) dialed in for each orchard and stage of growth, now is the time to say, “OK, I want to think about a little extra boost to my spray job.”
Which Activator Adjuvant to Use
First, know the properties of the pesticide you will use. Does it work on the plant surface or inside the plant? This is a key point in selecting adjuvants. Here is a quick review of the main classifications and characteristics of activator adjuvants as they currently appear in the field. Note: Certain products can provide more than one adjuvant property; that can be beneficial in the field. For example, non-ionic surfactants can work as surfactants and penetrators, depending on use rate.
Wetters/Spreaders
These materials contain surfactants that decrease the contact angle and increase the spreading of the spray droplet on the target. High rates of wetters/spreaders may also increase penetration of pesticides into the target tissue (leaves or fruit), potentially causing phytotoxicity. Excessive spreading of pesticide spray solution and runoff from the target may result when using a new or higher rate of spreader, especially when using silicon “super-spreaders”. Test new combinations of spreader material(s) and spray volume before regular use. Spray volume per acre or adjuvant use rate will probably have to be reduced if a labeled rate of adjuvant provides excessive spreading.
To check for excessive spreading, place a length of black plastic sheeting under several trees or vines in a row. Secure the plastic with spikes, wire staples and/or weights. Spray the new adjuvant and pesticide combination using your current sprayer setup. Reenter the field right after spraying, wearing appropriate PPE, and evaluate coverage. If material is pooling at the lower portion of leaves and/or fruit, excessive spreading is occurring. Check to see if pooling is occurring only in a certain area(s) of the canopy or throughout the canopy. If more spray solution is landing on the black plastic tarp under the trees/vines than between them, then runoff is occurring. Some ground deposit should be expected from standard airblast sprayer use.
Compare the results of your adjuvant test with a similar application of your current pesticide/adjuvant combination on another portion of the row. If there is no pooling or runoff with the new adjuvant in the tank, you can use the adjuvant with confidence. A lack of pooling or run off with the new adjuvant also might mean that your old sprayer setup and tank mix didn’t deliver adequate coverage.
If the test with the new adjuvant showed pooling on leaves and/or runoff on the ground, you have several choices: 1) You can reduce spray volume per acre by replacing some or all nozzles with smaller nozzle sizes on the sprayer in an effort to reduce overspreading. If you saw overspreading on some portions of the canopy but not others, reduce nozzle size only on the part of the spray boom that targets the over-sprayed part of the canopy. Recheck spray coverage if nozzling changes were made. 2) Reduce the adjuvant rate and recheck coverage/spreading. 3) You can go back to your established program without the new adjuvant.
What’s the “best” course of action? That depends on your farming operation. Reducing spray volume per acre means more ground covered per full spray tank, a potential time and cost savings. If spraying is done during the heat of the day in hot, dry climate, spray water evaporation is a major issue, and it may be best to keep the higher spray volume and reduce the spreader rate or eliminate it entirely. Checking coverage and overspreading allows you to make the best decision possible; avoid damage and, hopefully, save money. All farming operations are different. Make the choice that best fits your farm.
Stickers
These adjuvants can increase the retention time of the pesticide on the leaf and reduce rain wash-off. They may limit movement of systemic pesticides into the plant and are probably most beneficial when used with protectant materials (cover sprays). Do you overhead irrigate? Is there rain on the horizon? If you answer yes to either one of these questions, you may benefit from using a sticker.
Humectants
Under low humidity conditions, humectants can help reduce spray droplet evaporation before and after deposition on the plant. This is especially valuable when small droplets and/or materials that must be absorbed into the plant (systemic pesticides, PGRs, nutrients, etc.) are used in the summer under high temperature and low relative humidity conditions.
Penetrators
Frequently used with herbicides, these products include oils (petroleum, vegetable or modified vegetable oils) and non-ionic surfactants used at higher rates. In crop sprays, penetrators can be used to increase absorption of systemic pesticides (e.g., oil with Agri-Mek) as well as translaminar materials. Penetrator adjuvants should be used with caution or avoided entirely with surface active pesticides such as cover sprays or else phytotoxicity may result. Finally, some penetrators can increase the rain-fastness of some pesticides.
Do Your Homework
Use a product intended for crop spraying. Many activator adjuvants were developed and intended for use with herbicides. Products that are advertised for use with plant growth regulators should have a higher chance of crop safety compared with those that don’t. This is still no guarantee of a phytotoxicity-free application.
If you choose to use an adjuvant that is not specifically listed on the pesticide or foliar fertilizer label, jar test the planned spray solution first. Use the same spray water source. Include all leaf feeds, other adjuvants and pesticide(s) that you plan to put in the spray tank. Do this before tank mixing these materials.
A lot of time and money rides on effective pesticide application. Do your homework before the spray tank is filled and you will be well on your way to solid results.
No tillage and maintenance of a cover crop every vine row gets the most practice points because these practices promote soil health through better drainage, increased organic matter content, increased soil moisture holding capacity and better soil microbial activity (all photos courtesy Lodi Winegrowers Workbook 2nd edition 2008. Ohmart, C. P., Storm C. P. and Matthiasson, S. K. eds. 345pp.)
What are the Lodi Rules for Sustainable Winegrowing (LODI RULES), which entered its 16th year in 2021? It is a set of farming practices that result in higher quality winegrapes and wine according to grower and winemaker panelists on a recent webinar entitled ‘Boots on the Ground – A masterclass in sustainable viticulture & LODI RULES,’ a collaboration of the SommFoundation and the Lodi Winegrape Commission and hosted by Elaine Chukan Brown.
On a technical level, LODI RULES is California’s first third-party certified sustainable winegrape-growing program. It was initially developed for growers in Lodi’s Crush District #11 but made available to any California winegrape grower in 2008, expanded to Israel (Golan Heights Winery) in 2017 and Washington State winegrape growers in 2020. LODI RULES encompasses more than 120 farming practices, some of which will be discussed in this article, and is certified by Protected Harvest, a non-profit third-party certifier of sustainable farming programs.
To achieve certification, a vineyard must be farmed using practices that score 50% or more of the total possible points in each LODI RULES chapter and 70% of the points in the six chapters combined.
Origins of LODI RULES
From 2003 to 2004, I led the team of 22 winegrape growers, Lodi Winegrape Commission staff, crop consultants, PCAs, UC Farm Advisors, a wildlife biologist and a winemaker to create the first edition of the LODI RULES farming standards. They were based on what the team considered to be the most sustainable farming practices in the Lodi Winegrowers Workbook (Ohmart and Matthiasson 2000.) They were then submitted to Protected Harvest for scientific peer review and endorsed in 2005. The LODI RULES farming standards have been updated twice since then. The program has grown from six growers and 1200 vineyard acres in 2005 to more than 130 growers and 68,000 acres participating in 2021. In 2008, one winery started paying bonuses for LODI RULES certified grapes, and since then, many others have followed suit. One estimate has the annual bonuses exceeding $2 million.
The LODI RULES is organized into six chapters: Business Management, Human Resources Management, Ecosystem Management, Soil Management, Water Management and Pest Management. Each farming practice standard is assigned a number of points based on its assessed level of importance in sustainable winegrowing. To achieve certification, a vineyard must be farmed using practices that score 50% or more of the total possible points in each chapter and 70% of the points in the six chapters combined. The purpose of this scoring is so that a vineyard does not obtain certification while performing poorly in one chapter but very high in all the others. Furthermore, pesticides used in the vineyard are run through a pesticide risk model that calculates risk points for each application. To achieve certification, the risk points from the year’s pesticide applications cannot exceed a rigorous risk points threshold.
The LODI RULES is organized into six chapters: Business Management, Human Resources Management, Ecosystem Management, Soil Management, Water Management and Pest Management.
Independent professional auditors are contracted by Protected Harvest to audit annually the practices being used in each participating vineyard. An on-site audit is done on any vineyard new to the program and at least every three years after that. A desk audit is done each year for every vineyard not visited on-site. And finally, a grower is chosen at random each year for an audit to be done with a 48-hour notice. This ensures all growers are up to date with their records and practices. The auditors submit their reports to Protected Harvest near harvest for final certification decisions.
I will now highlight a few of the practices in each of the LODI RULES chapters. I will remind you that there are more than 120 practice standards, so I am only able to touch on a few of them. For a complete copy of the LODI RULES farming standards, go to lodigrowers.com in the grower resources section. A farming practice standard is a description of a practice that is required to be done in order to qualify for the points awarded for doing the practice. It is very specific and is described in a way that enables an auditor to clearly verify the practice is being done during the onsite audit of the vineyard being certified.
Business Management
The very first farming practice standard in LODI RULES is the requirement that a grower attend a LODI RULES workshop sponsored by the Lodi Winegrape Commission where they learn how to develop a sustainable management vision plan for their farm. They then need to draft the plan that contains elements that they were introduced to in the workshop.
One might ask, ‘Why is having a sustainable management vision plan for the farm so important?’ I will answer this question by quoting one of my favorite Yogi Berra statements: “If you don’t know where you are going, you may end up some place else!” Sustainable winegrowing is a long-term commitment and needs long-term goals so one has a target to aim for.
Other important practices in the chapter are developing plans for leadership succession within the farming enterprise and business risk management as well as tracking fuel and electricity use following the adage if you can’t measure it, you can’t manage it.
Human Resources Management
The first practice standard in the chapter is to develop a human resources management plan for the farm. Other practice standards relate to team building, employee training and development, employee performance evaluation, employee orientation, providing health care and benefits, safety training and a safety rewards program.
The farming practice standards for ecosystem management focus primarily on parts of the farm that are outside the vineyard, such as riparian areas like the one seen here.
Ecosystem Management
The farming practice standards for ecosystem management focus primarily on parts of the farm that are outside the vineyard. They start with an environmental survey to identify and document important environmental features such as swales, riparian areas, trees, woodlands or vernal pools whose presence would impact how the farming is done in the vineyard.
This is followed by the development of an Ecosystem Management plan for the farm. Then there is a series of detailed farming practice standards for managing important ecosystem elements from cover crops in the vineyard, vegetation adjacent to the vineyard, and, if present, managing woodlands, individual trees, seasonal wetlands or riparian habitat.
There are other practice standards focused on biodiversity and providing nesting boxes for owls, birds and bats. And finally, if a grower has grazing animals on the farming, a grazing management plan needs to be developed and implemented.
Soil Management
The soil management chapter starts with farming practice standards for developing and implementing a nutrient management plan based on vine needs over the season, a soil conservation plan to minimize erosion due to wind and water and a soil map confirmed by soil coring or a soil pit. No tillage and maintenance of a cover crop every vine row gets the most practice points because these practices promote soil health through better drainage, increased organic matter content, increased soil moisture holding capacity and better soil microbial activity.
Soil and vine tissue sampling is required to be done to monitor the nutrient availability and status in vine tissue so as to guide nutrient additions if they are determined to be necessary. Several farming practice standards address nitrogen management due to its importance in vine performance as well as its mobility in the soil, making it prone to leaching into the ground water during winter rains.
Water Management
Water management is a critical element of sustainable winegrowing because it is a precious resource in California as well as the recognized fact that irrigation management is one of the most important ways to influence winegrape quality and therefore wine quality. The chapter starts with a practice standard for the development and implementation of a water management plan that states goals and strategies, followed by a focus on soil water holding capacity, water intake rate and permeability, and irrigation system design and performance measuring and monitoring.
Due to the importance of a properly performing irrigation system, several standards focus on amount of water used, maintenance, distribution uniformity and pump efficiency, with practices specific to micro, sprinkler or flood systems. There are also practice standards for irrigation scheduling based on monitoring vine water demand, level of soil moisture and avoidance of offsite movement of irrigation water.
Many wineries now require sustainability certification of their growers.
Pest Management
I have long felt that pest management is one of the most challenging areas of sustainable winegrowing to capture in a set of farming practice standards. That is because, ideally, pest problems in the vineyard are minimal due to the grower having implemented a whole range of preventative practices that preclude the development of pest problems. In other words, much is done to minimize the need for a pest control action. Many of these preventative practices are captured in farming practice standards in other LODI RULES chapters such as Water, Soil and Ecosystem Management.
The Pest Management chapter begins with a standard for development and implementation of an insect and mite management plan. It is followed by one for insect and mite population monitoring and data recording and another specifying economic thresholds for management actions against leafhoppers and mites.
There are several practice standards for disease management due to its importance in developing an economically acceptable yield, quality winegrapes and ensuring the maximum length of life for the vineyard. The first is the development and implementation of a Powdery Mildew management plan given the key role this disease plays in vineyard management. There are practice standards for when to initiate mildew treatments in the early stages of the growing season, the subsequent timing of treatments as the season develops as well as one for managing fungicide resistance. There are also practice standards for managing Botrytis and canker diseases.
Weed and vertebrate pest management are addressed through standards requiring the development and implementation of weed and vertebrate pest management plans followed by ones for monitoring and recording their respective populations.
When a pest problem needs an action, it is often in the form of spraying, whether it is due to an insect, mite, disease or weed. We all appreciate the importance of sprayer calibration and maintenance, but it is often challenging for many growers to do them in a timely manner. Therefore, there are practice standards that thoroughly address these two critical aspects of pest management.
Pest problems change through time and it is important that the LODI RULES keep up with them. New practice standards are periodically added when revisions to the program are made. For example, given the rapid rise in the importance of leaf roll and red blotch viruses and the vectoring of some of them by Vine Mealybug, new sustainable practice standards have been written to address this issue and will be added to the program in 2022.
Sustainable farming practices within and outside of the vineyard are assigned a set of points under the LODI RULES program.
Certification
I often hear growers say, ‘Of course I farm my vineyard sustainably, why do I need to be certified?’ One reason is that more and more wineries are requiring certification to obtain and maintain a winery contract. That, however, is a cost of doing business requirement, which is not something that is all that inspiring for a grower.
Two primary goals for the team that created the LODI RULES was that implementing them would result in higher-quality winegrapes and help a grower improve their farming operation. Based on the feedback from growers in the program and wineries that are paying bonuses for LODI RULES certified winegrapes, I think these goals have been met.
One can look at a grower farming according to the LODI RULES as doing something similar to what an airline pilot is required to do before flying their plane. They go through a checklist of all the different systems on the plane to ensure they are in working order. Many of the things are obvious, but there are so many that it is easy to overlook some of them in day-to-day flying. The checklist assures that does not happen. As passengers on the plane, we can appreciate the importance of going through this check list! The same can be said for sustainable viticulture.
There are so many practices involved in growing winegrapes sustainably. Many are obvious and are second nature to a grower. However, it is easy to overlook some in the day-to-day frenzy involved in farming. Certifying to the LODI RULES ensures this does not happen.
Progressive Crop Consultant Magazine’s popular two-day Crop Consultant Conference will return this year as a live conference and trade show, featuring seminars worth 14.5 hours of CCA and 7 hours of DPR continuing education credits, a live trade show, and the presentation of Western Region CCA Association’s popular CCA of the Year Award and honorariums and scholarships. The Crop Consultant Conference will be held on Sept. 16 and 17 at the Visalia Convention Center.
The Crop Consultant Conference has become a premier event held in the San Joaquin Valley each September for Pest Control Advisors and Certified Crop Advisers. Co-hosted by JCS Marketing, the publisher of Progressive Crop Consultant Magazine, and Western Region Certified Crop Advisers Association, the event brings industry experts and suppliers, researchers and crop consultants together for two days of education, networking and entertainment.
“We are excited to be back to doing our events in person, and expect another sell-out event for crop consultants in the Western United States,” said JCS Marketing Publisher and CEO Jason Scott. “Agriculture is a relationship-driven business and there is no substitute for live events.”
Topics for the two days of seminars include: Various seminars on managing pests and diseases in high-value specialty crops, tank mix safety and regulations, fertilizer management, soil health, new technology, new varieties and rootstocks and their impact on tree nut pest management.
The conference will conclude with two one-hour panels offering hard-to-get CCA credits and moderated by Western Region CCA related to nitrogen monitoring, use, application and management as well as the various regulatory requirements around irrigated nitrogen management.
EXCLUSIVE FREE ACCESS TO VIRTUAL C.E. LIBRARY
Get exclusive access to an additional 11.5 DPR and 12.5 CCA hours as part of your 2021 Crop Consultant Conference Registration. These additional hours are available virtually, on-demand, and only to registered attendees. Exclusive access to these hours will only be available from October through December of 2021.
Registration fees for the two-day event are $150, or less than $15 per CE unit. Pre-registration is required and can be done at progressivecrop.com/conference.
California Certified Crop Advisers (CCAs) are an integral part of the nitrogen management compliance picture (all photos by Vicky Boyd.)
In the last 10 or more years, water quality regulations that address nitrate in groundwater have expanded dramatically. Starting in 2012, the regulatory agencies charged with protecting California’s water quality have increased their scrutiny of and demands on agriculture. So, it is essential for crop consultants to understand the regulations and how regulations affect their customers.
Regulatory History
The challenges associated with nitrate in groundwater and its sources have been recognized for at least a generation. In 1987, the California State Legislature directed the State Water Resources Control Board to prepare a report on nitrate contamination in drinking water. The convened expert panel reported that agriculture was likely an important contributor to nitrate in groundwater.
In 2012, however, the regulatory landscape changed dramatically. First, a major study of nitrate in California drinking water was published by UC Davis. This sprawling effort, titled Addressing Nitrate in California’s Drinking Water, focused on the Tulare Lake Basin and the Salinas Valley. The multi-volume report was produced by the UC Davis Center for Watershed Sciences. It showed that nitrate problems would likely worsen for the next several decades and that most nitrate currently in drinking water wells was applied to the surface decades earlier. An important conclusion of the report was that agricultural fertilizers and animal wastes applied to cropland are by far the largest regional sources of nitrate in groundwater. Thus, in the last decade, the State and Regional Water Boards have been more assertive in regulating agricultural contributions to groundwater nitrate.
The Central Valley Irrigated Lands Regulatory Program (ILRP) started in the first part of this century with a focus on pesticides in surface water. That focus expanded in 2012 when the ‘Waste Discharge Requirements for the Eastern San Joaquin River Watershed (ESJ) General Order’ was first adopted by the Central Valley Regional Water Quality Control Board (CVRWQCB). This order required grower reporting of nitrogen fertilizer applied to cropland and estimates of the nitrogen removed with harvested crops, so the efficiency of nitrogen fertilizer use could be calculated. Growers record this information in their Nitrogen Management Plans (NMPs) as specified by the CVRWQCB. The reporting of NMP data was carried out through the ESJ Water Quality Coalition, a grower-led intermediary that anonymized the data and provided statistical analysis on a township basis. A component of the statistical analysis is identification of outlier values (i.e., parcels where the nitrogen efficiency is low relative to others in township.) These outlier growers are then targeted for outreach and increasing reporting requirements. Growers in all regions of the Central Valley are represented by coalitions. Nitrogen reporting requirements are now in place for all Central Valley regions and crops with the exception of rice.
In 2018, the State Water Board stepped into the picture and revised the ESJ Order to include new provisions to be precedential to all regional boards. The precedents adopted include reporting of nitrogen application (A) to and removal (R) from cropland, reporting of irrigation water used, testing on-farm domestic wells for nitrate and reporting nitrate exceedances to the well users. With these new requirements, the NMPs became the Irrigation and Nitrogen Management Plans (INMPs). The regional boards were directed to use both A/R and A-R (the nitrogen efficiency ratio and the total excess nitrogen, respectively) to evaluate compliance. All regional boards are required to adopt these precedents into orders by February 2023. The CVRWQCB updated its ILRP orders in 2019.
Another major nitrate-related regulatory effort in the Central Valley is the Central Valley Salinity Alternatives for Long-Term Sustainability (CV-SALTS). This is a multi-stakeholder effort that seeks to manage the long-term loading of salts in the Central Valley. Of interest here is the focus on nitrate. The CVRWQCB adopted the regulations proposed by the CV-SALTS stakeholders in 2018. The goals of CV-SALTS regulations are “1) to ensure a safe drinking water supply; 2) to achieve balanced salt and nitrate loadings; and 3) to implement long-term and managed aquifer restoration programs where reasonable, feasible and practicable.”
While the CV-SALTS process affects all discharges in the Central Valley, each of the above goals represent challenges to growers in terms of costs of compliance and improving nitrogen fertilizer management. Fortunately for growers, the administration of regulatory requirements is handled by the coalitions that were established for the ILRP.
Looking again at 2012, the Central Coast Regional Water Quality Control Board (CCRWQCB) adopted its first order to require reporting of nitrogen applications. This information was reported directly to the Regional Water Board. Just this year, the CCRWQCB adopted the updated “Ag Order 4.0,” incorporating the ESJ precedents and setting long-term limits on excess nitrogen applied to crops. Farming operations must now submit information on nitrogen applied to and removed from cropland. The order includes a schedule of targets for excess nitrogen fertilizer roughly defined as A-R. After 2026, specific excess nitrogen targets are in place for all crops. Those targets rachet down from 300 lbs/ac in 2026 to just 50 lbs/ac in 2050. For reference, the CCRWQCB estimates that currently only approximately 6% of the acres of high-value crops meet the 2050 benchmark.
The situation in the Central Valley is different than in the Central Coast. The Central Valley coalitions have developed a methodology to determine what those targets should be on a township basis. The methodology, a sophisticated modelling effort for the entire Central Valley, has been approved by the CVRWQCB Executive Officer and is scheduled to produce target excess nitrogen values in 2023.
Irrigated nitrogen management is a crucial area for CCAs.
The Crop Adviser’s Role
California Certified Crop Advisers (CCAs) are an integral part of the nitrogen management compliance picture. The CVRWQCB determined that CCAs who received special training in nitrogen management are qualified to certify growers’ INMPs. There are now nearly 900 CCAs eligible to certify INMPs.
For several years, CCAs became eligible to certify Central Valley growers’ NMPs through training received via a day-and-a-half in-person conference given once a year and presented by UC faculty. Funded by the CDFA Fertilizer Research and Education Program (FREP), this successfully certified nearly 1,000 CCAs. On October 1, 2020, the certification program changed to a Nitrogen Management Specialty category managed by the International Certified Crop Adviser organization. All CCAs who had the nitrogen management certification were “grandfathered” into the new Nitrogen Management Specialty category. CCAs who had not yet been certified now must take the Nitrogen Specialty category exam to be qualified to sign INMPs. UC staff developed online training modules to assist CCAs in passing the specialty exam. The training is available to any CCA and provides 16 continuing education units (CEUs) for a cost of $120. More information regarding the online training and the specialty exam can be found at certifiedcropadvisor.org/ca-nsp/. CCAs who have the California Nitrogen Management Specialty (CA-NSP) category must obtain eight CEUs in nutrient management and seven CEUs in soil and water management over two years but are still only required to obtain 40 total CEUs to maintain their certification. There is an additional fee required to maintain the CA-NSP.
CCAs may find that certifying INMPs, especially the irrigation portions of the forms, moves them out of the nutrient management comfort zones. Because we all recognize the importance of irrigation management in nitrogen management, we can also realize that it’s a crucial area for CCAs to step into. Information regarding anticipated crop evapotranspiration (ETc) and irrigation water to be applied is required in the INMPs.
Instructions provided with the plans suggest that the UC or coalition may provide the information to complete the ETc question, but the data are not readily available. To resolve the conflicts involving ETc determination, a statewide project was funded to create an accepted clearinghouse of coefficient values for the major crops in California. The project is nearing completion and should go a long way to helping CCAs provide accurate answers for the ETc questions in the INMP. Alternatively, this year, a project involving the National Aeronautics and Space Administration (NASA), the Environmental Defense Fund and a host of other partners will make ETc data available through interactive maps on the web. The project is called OpenET and is set to be released by the end of the year.
FREP is holding its annual conference this year in San Luis Obispo from October 26-28. There will be sessions on OpenET, ILRP water quality coalitions and other nutrient and irrigation management topics. For more information, see cdfa.ca.gov/is/ffldrs/frep/FREPConference.html.
Mark Cady is currently supervisor of the CDFA FREP. His understanding of water quality regulation comes from four years as an environmental scientist with the CVRWQCB. FREP’s role is to fund and facilitate research and education to advance the environmentally safe and agronomically sound use and handling of fertilizing materials. Please visit cdfa.ca.gov/is/ffldrs/frep for more information.
Irrigation systems for new orchards should be designed to ensure a wetting pattern that promotes good root distribution.
Protecting the roots of young almond trees at planting is a vital step toward long-term tree health.
At the 2021 San Joaquin Valley Almond Day, UCCE Farm Advisors Mae Culumber and Brent Holtz outlined care for new trees during orchard establishment.
If possible, avoid planting on hot, windy days, Culumber said. The small root hairs on dormant trees can dry out quickly when exposed to air. Since roots store carbohydrates needed to support new growth, the trees should be handled and planted carefully. Roots should not be pruned prior to planting unless they are damaged. Roots can also be treated with Galltrol before planting to prevent crown gall infections.
The holes for the new trees should be wide and deep enough so roots are not cramped and can spread. The largest, strongest roots should be oriented in the direction of the prevailing wind. The highest root should be slightly higher than the soil line, but covered with soil. Soil should be tamped down around the tree to eliminate air pockets.
After the trees are in place, Culumber said 1 to 3 gallons of water should be used to soak the soil around the tree.
Irrigation systems for new orchards should be designed to ensure a wetting pattern that promotes good root distribution. In the weeks and months ahead, over-irrigation should be avoided as saturated conditions kill small roots due to poor aeration. Over-irrigation also creates conditions favorable to phytophthora.
There is potential to lose irrigation efficiency when larger soil surfaces are wetted. With soil-applied nutrients, efficiency of the delivery system is dependent on water delivery.
Culumber explained one approach is to run tubing for button emitters. Using a riser with two outlets, one button is placed a half-foot from the center of the trunk at a rate of one gallon. Two more buttons are placed two feet from the first at two gallons per hour.
For second leaf trees, two more buttons are added at 8.5 gallons per hour. At third leaf, tubing is run for micro sprinklers with a pressure compensator in between each tree with a rate of up to 18 gallons per hour.
Holtz reported in his whole orchard recycling studies that young trees experience less water stress planted where wood chips are incorporated back into the soil due to increased moisture holding ability.
In WOR plantings, Holtz said the carbon to nitrogen ratio can become unbalanced and early N applications are important.
This drawing supplied by UCCE Farm Advisor Brent Holtz illustrates the correct procedure for planting almond trees on berms.


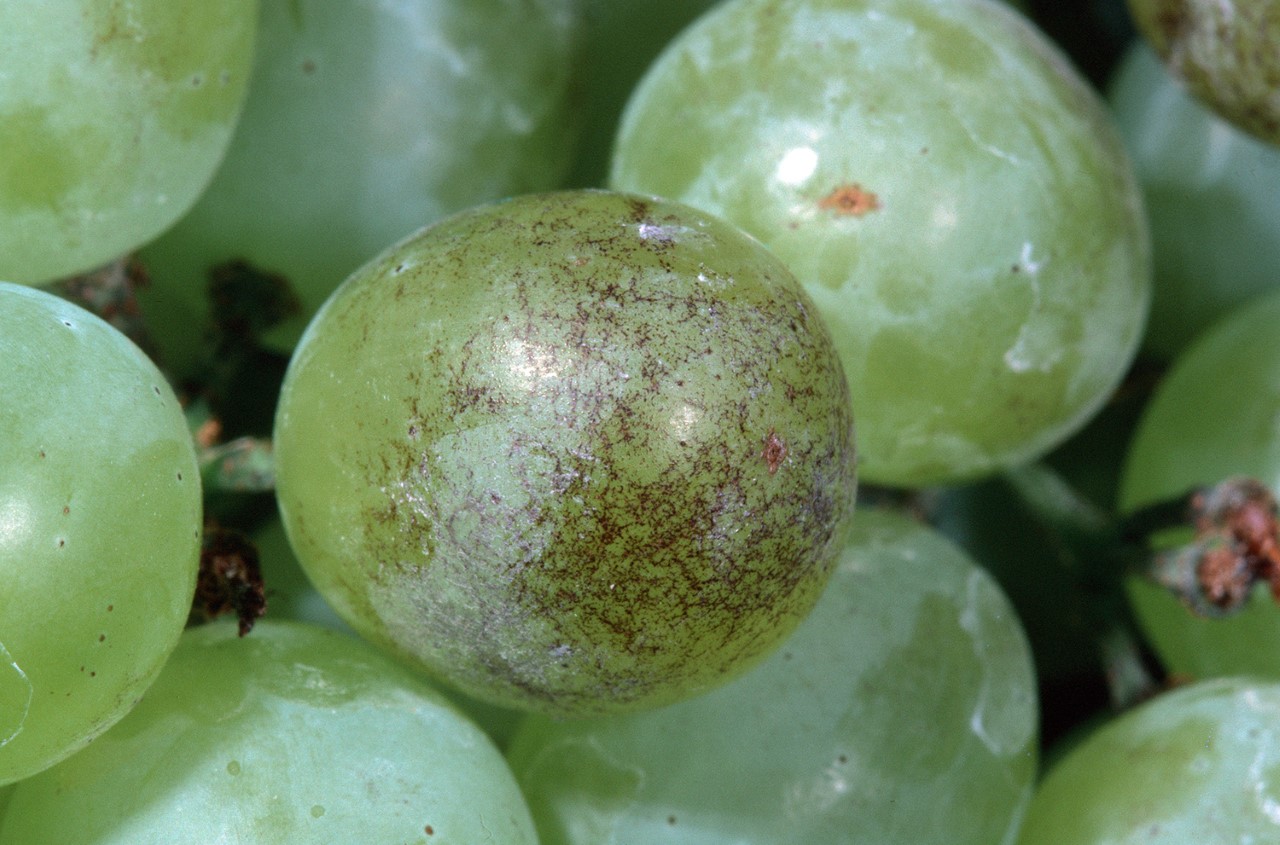

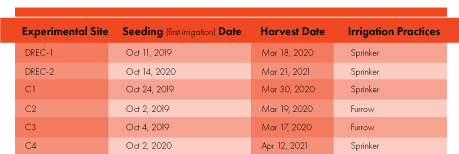


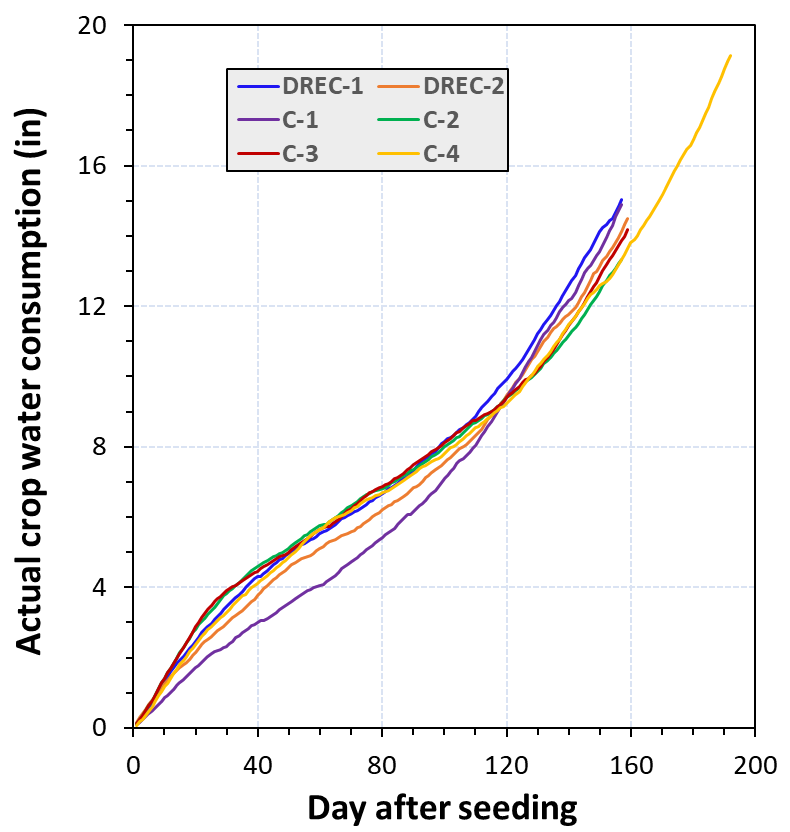
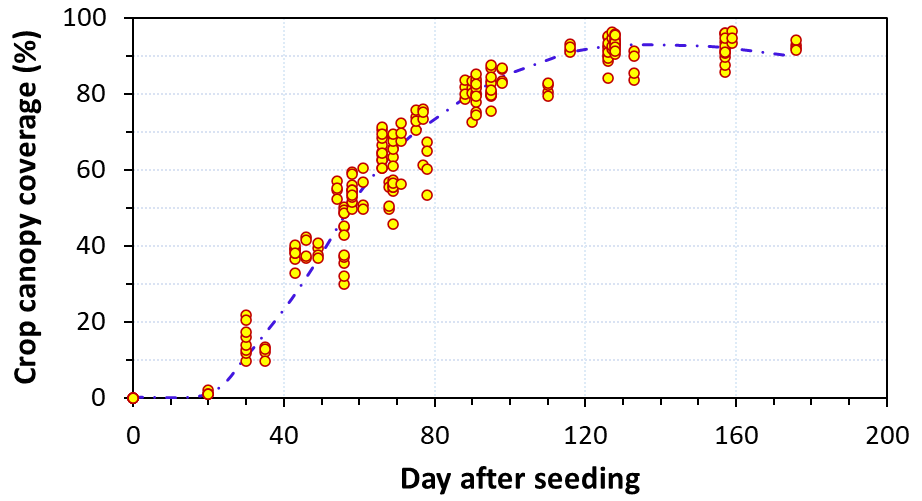
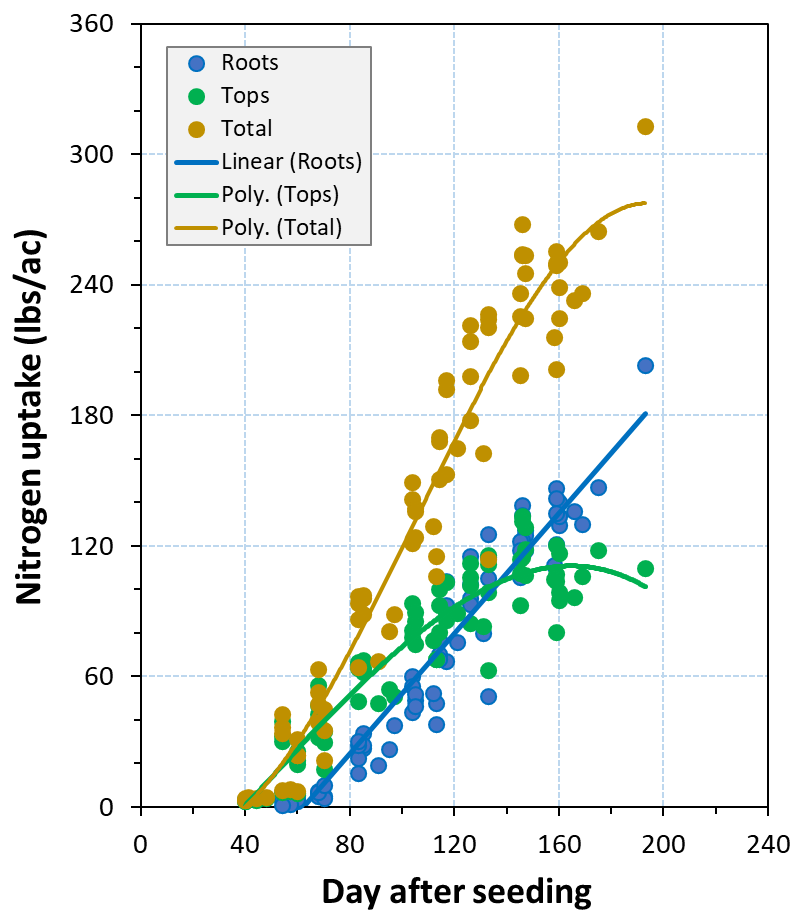
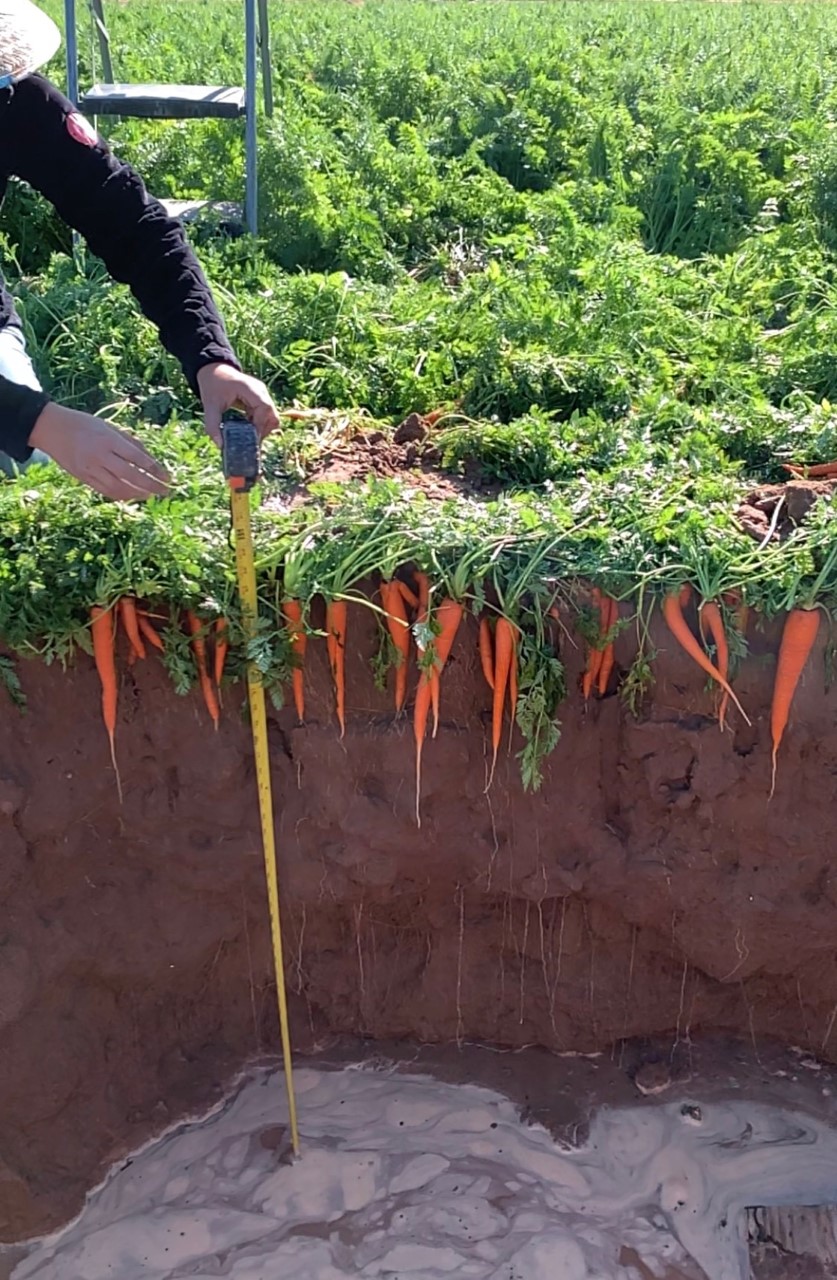

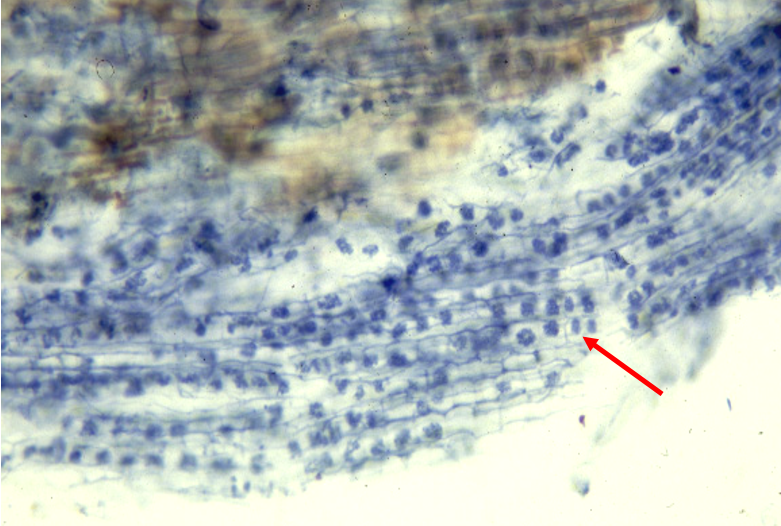
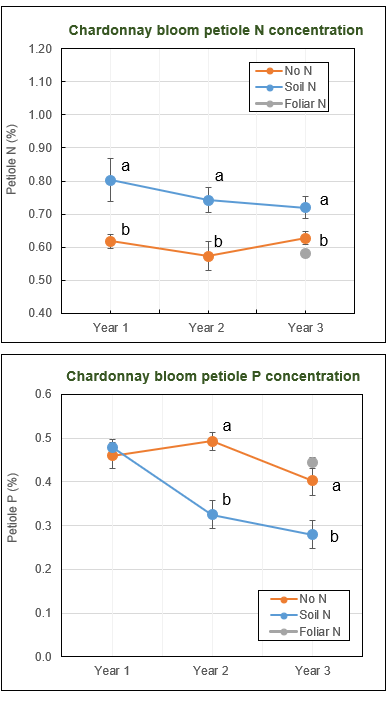
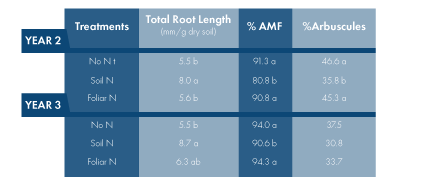
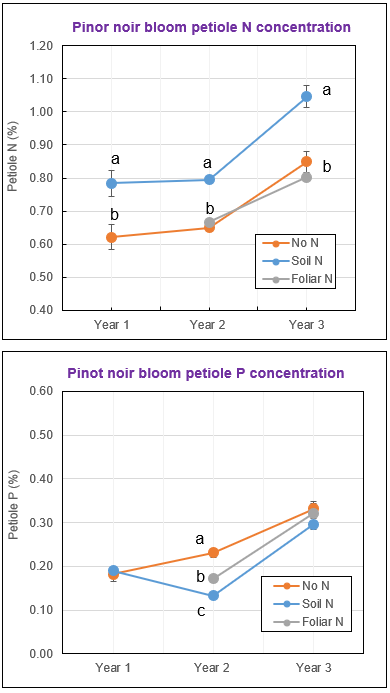
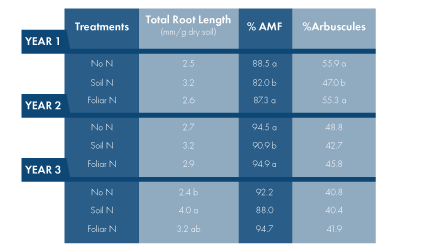

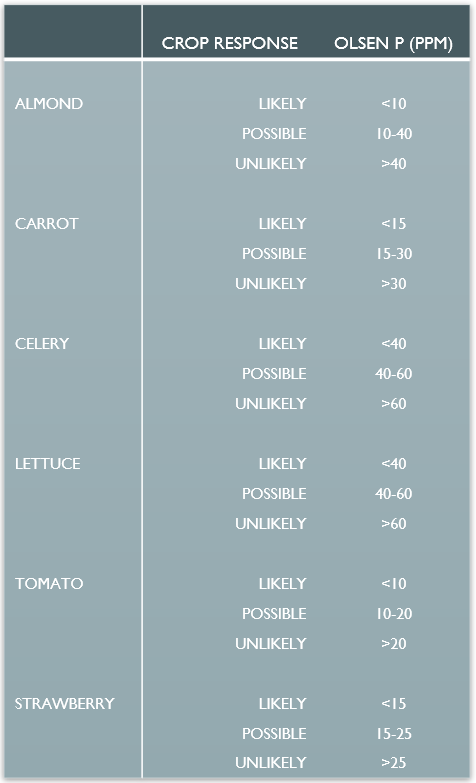

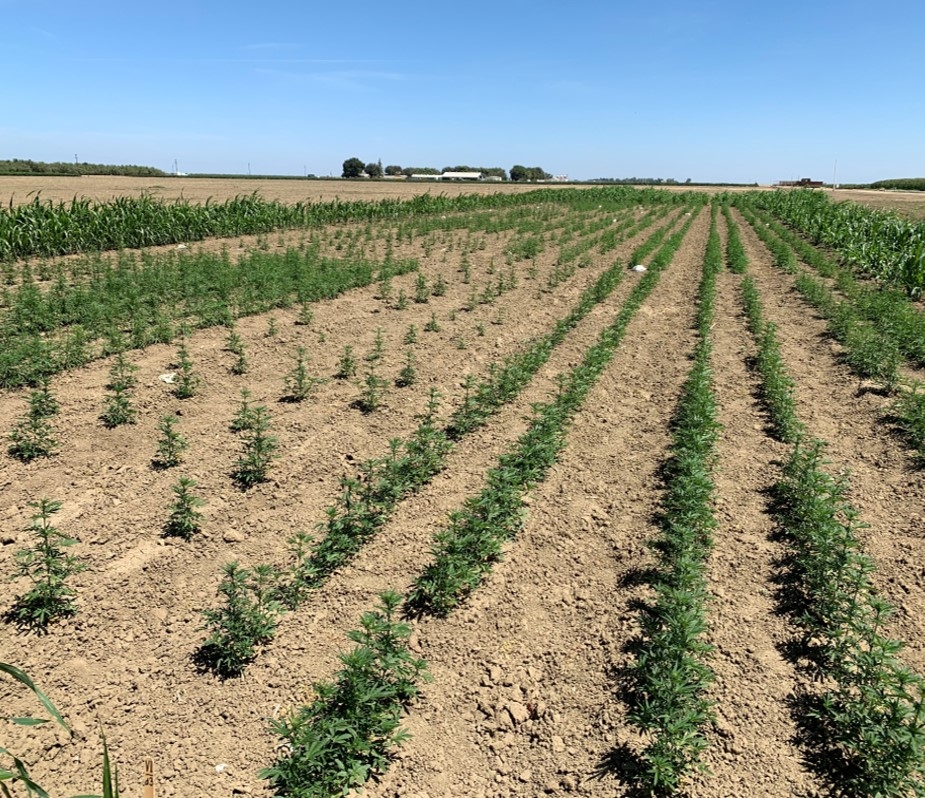


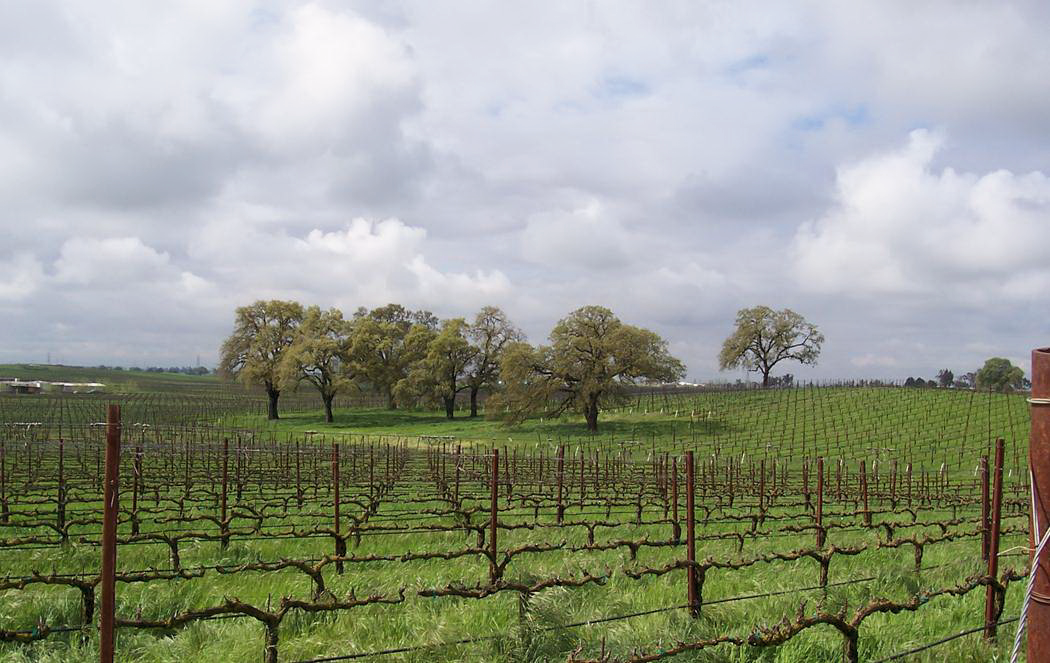
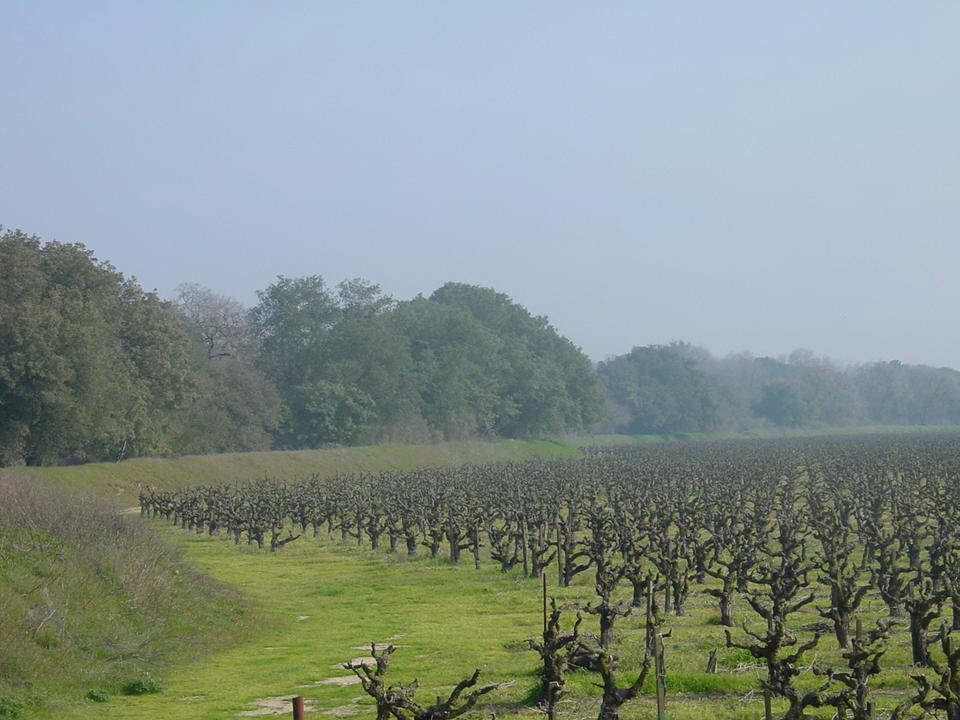
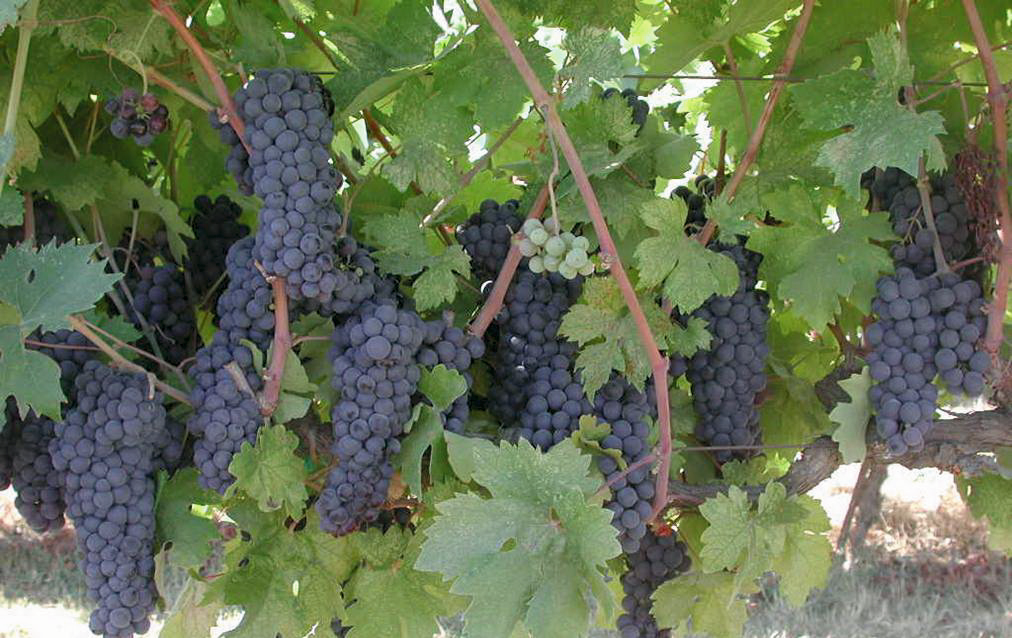
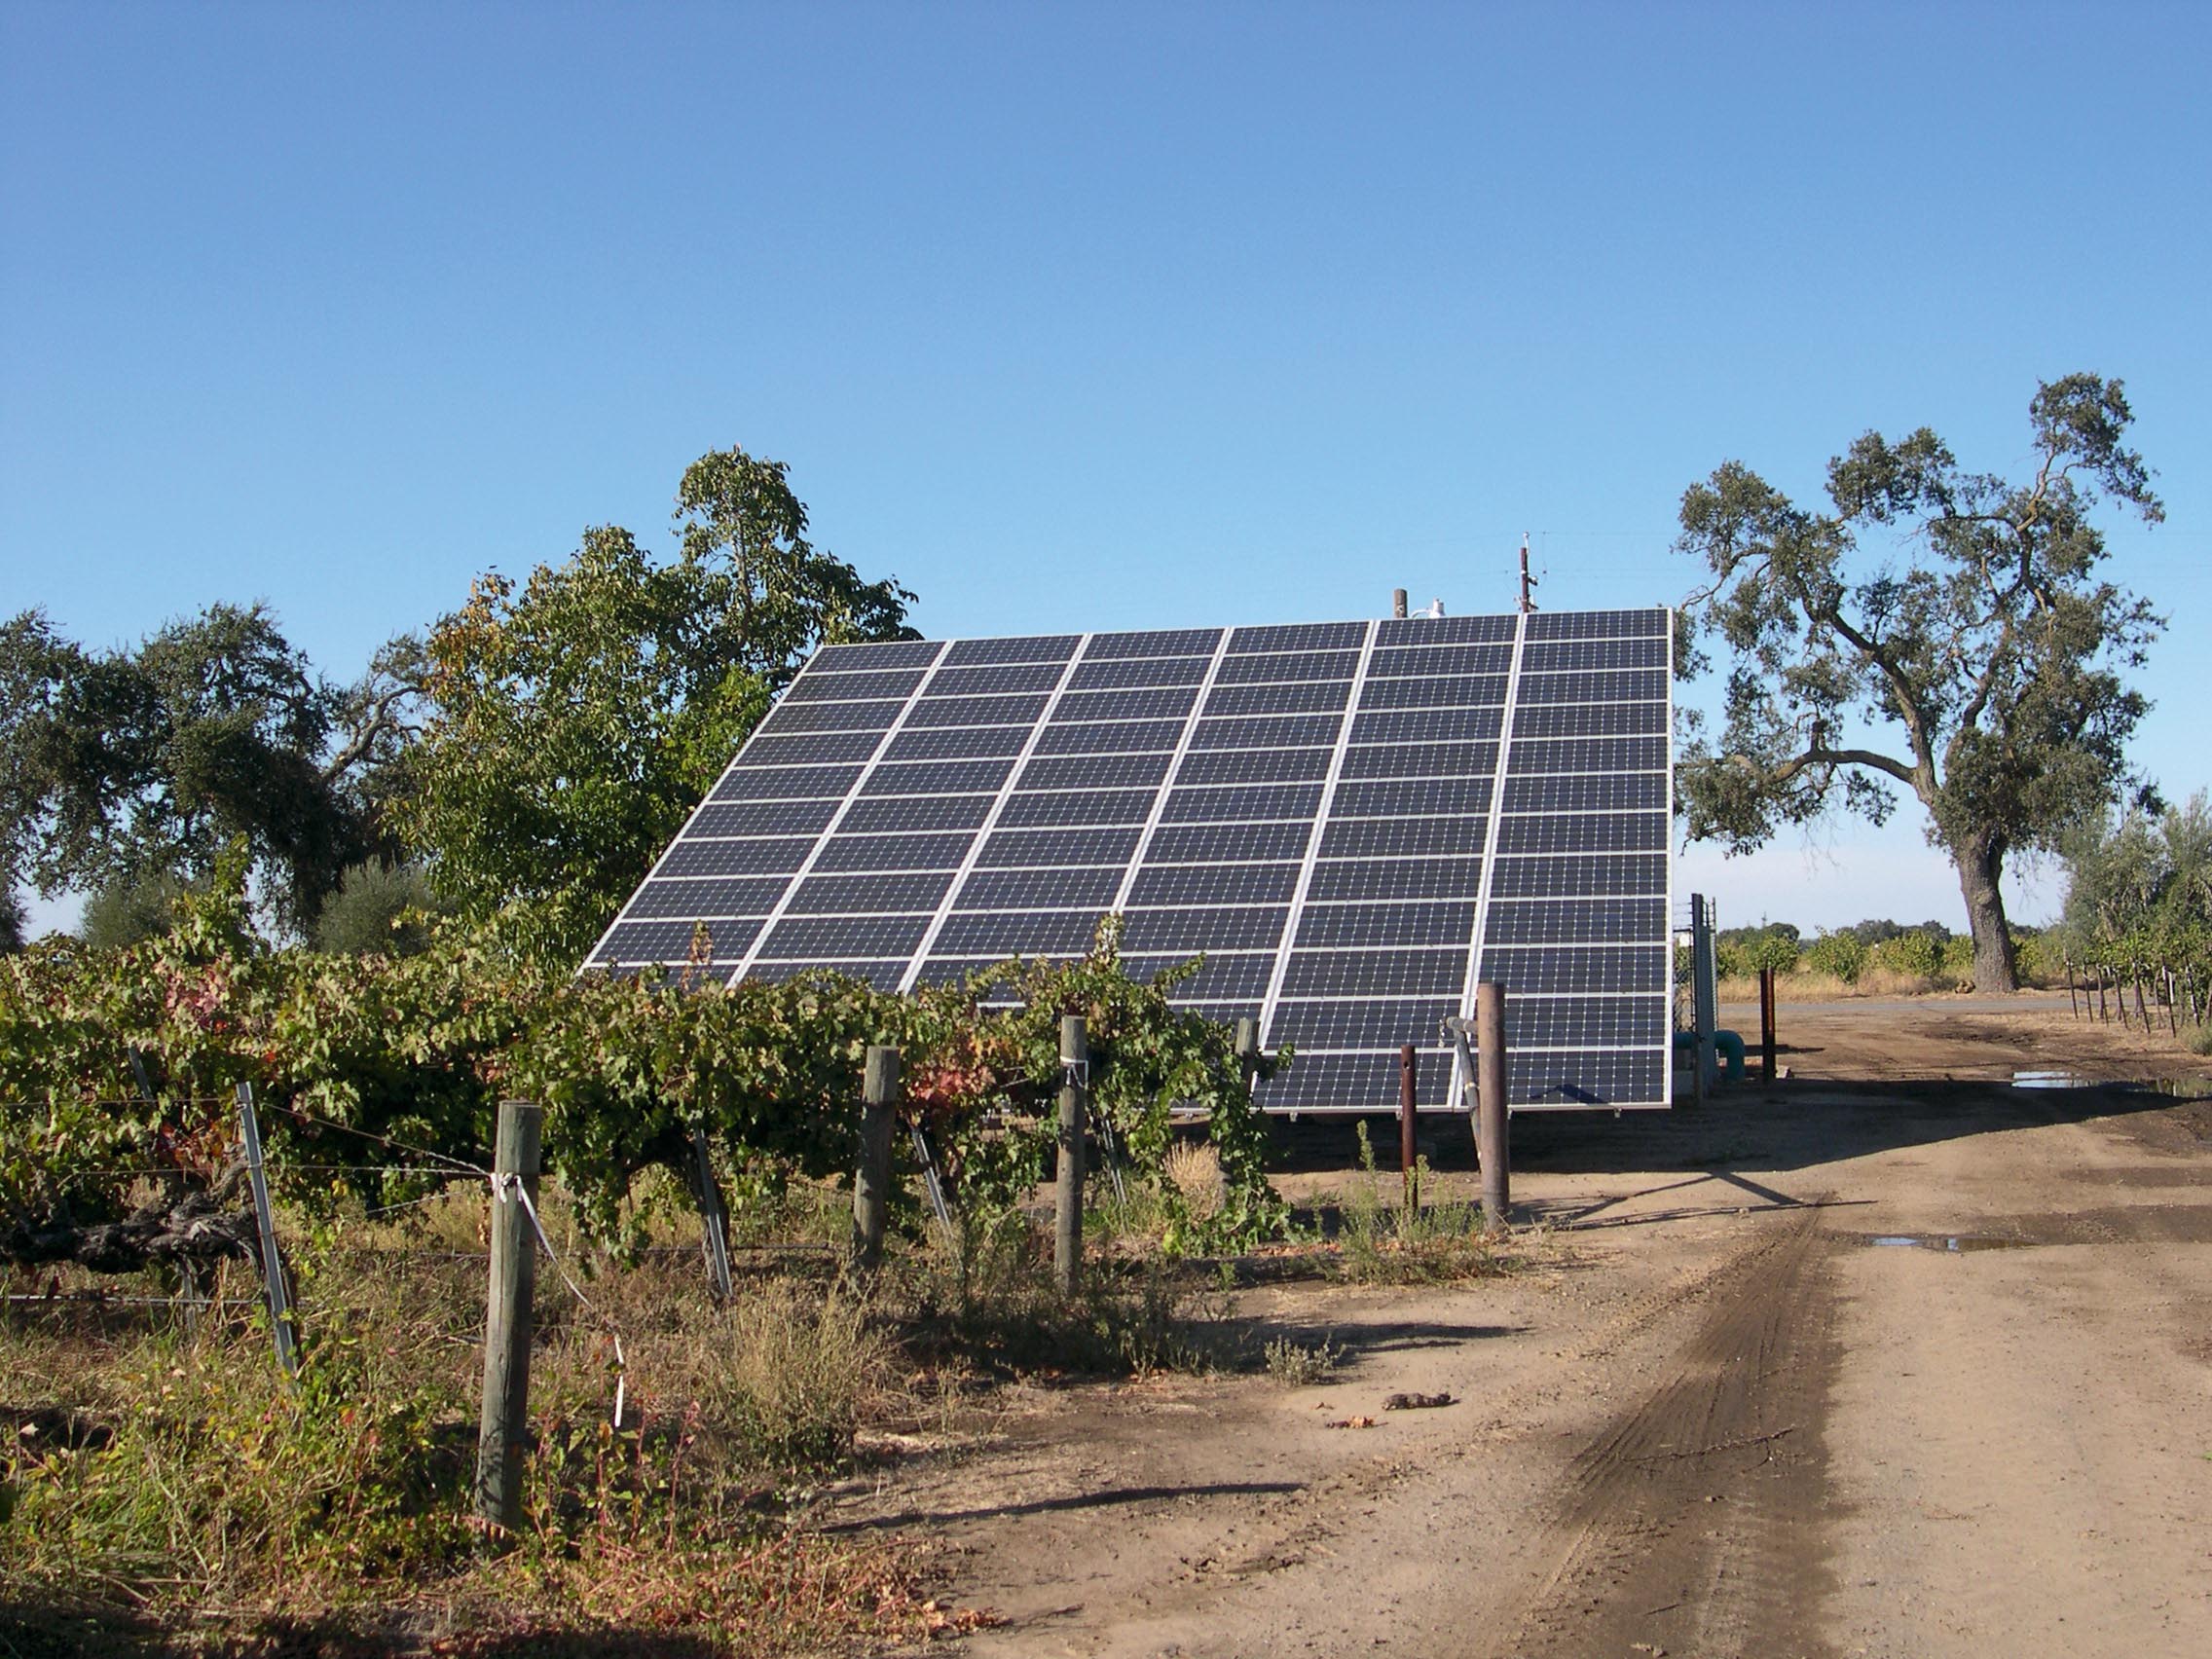


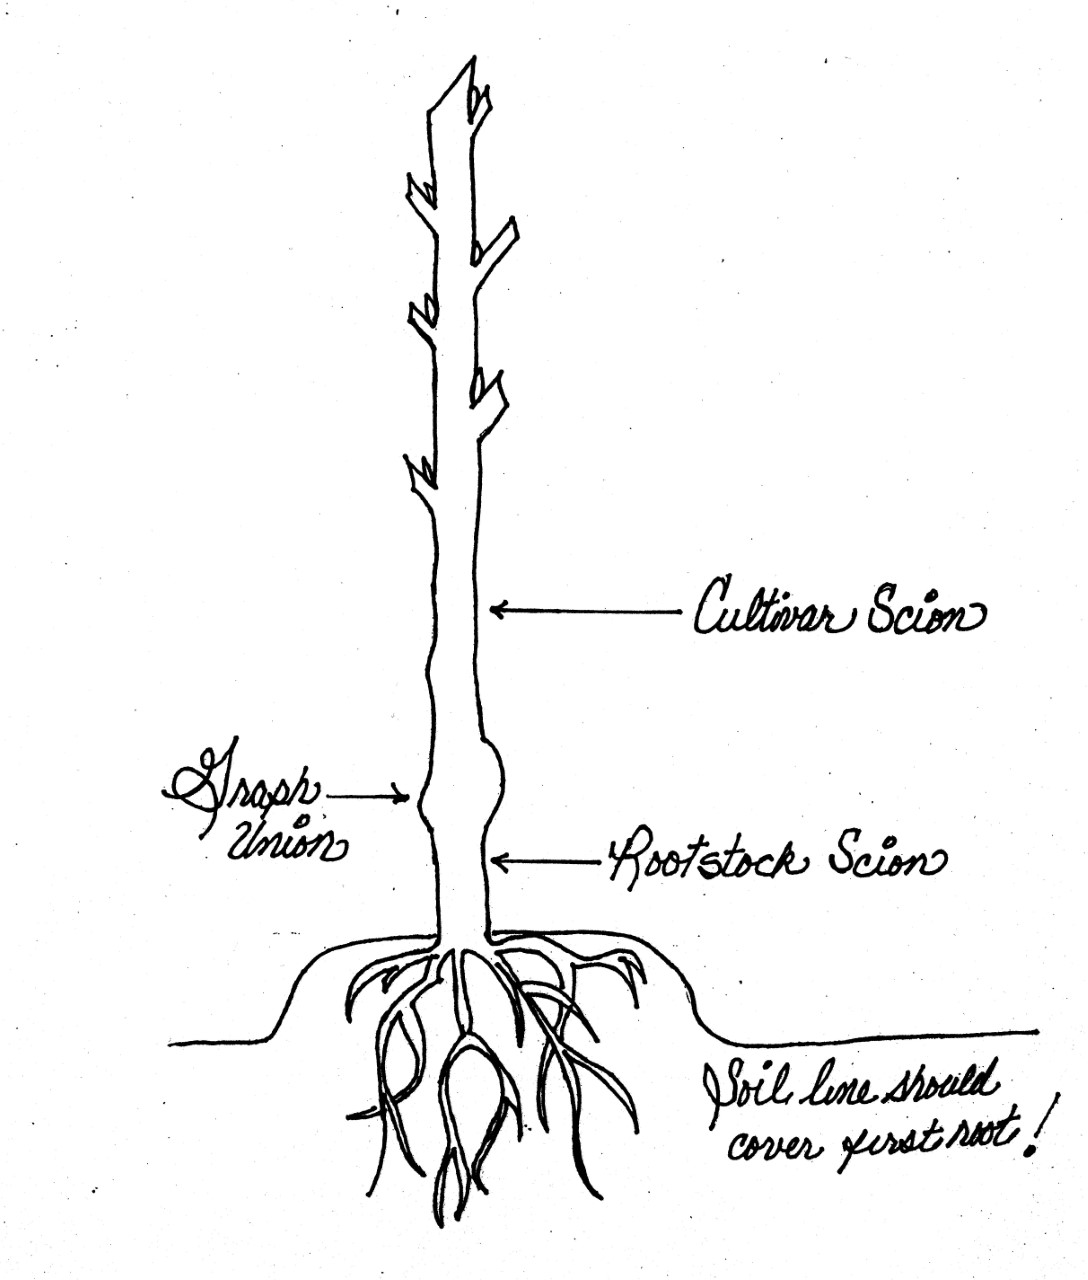


 Invading California")

