Small canopy while clusters are at bloom indicates stunted early canopy growth due to a dry winter. Typically, the small canopy can recover after irrigation events; however, yield will be significantly reduced due to excessive cluster shatter (photo courtesy G. Zhuang.)
Smaller-than-normal canopies in wine grape vineyards are a common sight in the San Joaquin Valley this year due to lack of irrigation water.
George Zhuang, UCCE Fresno County viticulture advisor, said the dry winter and spring contributed to stunted growth and production issues growers are seeing in this year’s wine grape crop.
“In some varieties, we are seeing shatter in clusters and yield losses,” Zhuang said.
Postharvest irrigation is important every year to relieve water stress and help the vines store carbohydrates for next year’s production. This year, it is critical. The goal of postharvest irrigation is to avoid delayed, erratic bud break and ensure canopy growth the next growing season. It will also help with production and fruit quality, Zhuang said.
This year, securing enough water for postharvest irrigation may not be possible. Zhuang said growers and vineyard managers will have to decide if they want to apply water after harvest or save it for next spring. If the Valley experiences another dry winter, the water will help next year’s growth. Stressing the vines postharvest will have a carryover effect into the next year, he said.
If irrigation water is available postharvest, the goal is to maintain a photosynthetically functional canopy, but avoid overwatering to prevent vines from pushing new growth.
At least 10% of seasonal irrigation water should be applied postharvest. For early season wine grape varieties with a longer postharvest growth period, more water may be needed if hot temperatures persist. To ensure a more even bud break and an adequate carbohydrate reserve, irrigation, if possible, should continue until leaf senescence.
Adequate soil moisture postharvest and during dry winters will also hydrate vines, prepare them from cold hardiness and help with even budbreak the following season.
Fertilizer applications can be made in the fall to replace annual loss from harvest. It is important that the canopy is active to assimilate nitrogen applications. Early season varieties will have a longer period where this is possible.
Postharvest is a good time to apply soil amendments, including sulfur and gypsum, to adjust soil pH and improve infiltration.
If there is a positive to this year’s drought conditions, it is the lower pest and disease pressure in vineyards. This year, Zhuang said, there has been less fungal disease due to the smaller canopies. Vine mealybug has also declined in water stressed vineyards due to less vigor in the grapevines.
Vegetative barriers are narrow and parallel strips of stiff, dense vegetation planted on or close to the contour of slopes or across concentrated flow areas. These barriers can slow runoff water and have a filtering effect (photo by Ayanna Glaize, North Carolina State University.)
One of the pathways for foodborne bacterial pathogens such as E. coli, salmonella and campylobacter to contaminate fresh produce is proximity to livestock operations. Research has shown that vegetative barriers between livestock and produce fields could reduce foodborne pathogen transmission.
Most foodborne disease outbreaks can be traced back to contaminated fruits and vegetables, especially leafy greens. A research study conducted by North Carolina State University showed there was significant transmission from animal operations to fresh produce on farms where both livestock and crop systems were integrated.
Multiple pathways allow for transmission of foodborne pathogens. They include environmental sources, such as contaminated surface runoff water, insect and air transmission due to proximity of animals to fresh produce, manure contamination of irrigation systems and improper food handling.
Vegetative barriers have been proposed as a possible solution to transmission of foodborne pathogens.
Vegetative barriers are narrow and parallel strips of stiff, dense vegetation planted on or close to the contour of slopes or across concentrated flow areas. These barriers can slow runoff water and can have a filtering effect. They also loosen the soil, allowing for water penetration. The foodborne pathogens E. coli and salmonella can contaminate fresh produce through wind transmission and through surface runoff water, the study reported. Planting vegetation barriers can effectively reduce flow of runoff water and act as a wind barrier that traps spray droplets from animal operations, intercepting them and preventing them from reaching fields were produce is grown.
The study showed evidence of decreased rates of contamination of fresh produce by E. coli and salmonella from animal production when vegetative barriers were used. The study involved a five-layer vegetative barrier constructed between a dairy, a poultry operation and a produce farm. Fresh produce, manure and environment samples were collected over 15 months and tested for the level of E. coli and salmonella.
The results showed that only 18% of the total E. coli and salmonella samples isolated were present in the fresh produce after installation of vegetative barriers.
The study also noted that while the barriers are effective, other pathways, including manure applications on fields and improper food handling, can still lead to contamination.
Lewis mites on a strawberry leaf. Lewis mites have smaller spots that run along each side of their bodies. Identification of mite species is important for effective control (photos by Surendra Dara, UCCE.)
With mites in strawberries, it is important to correctly identify the species to achieve effective control.
At the 12th-annual Santa Maria Strawberry Field Day webinar, UCCE Santa Cruz Farm Advisor Mark Bolda reported on two strawberry pests, two-spotted mite and Lewis mite, and how to distinguish the two. This is important, Bolda said, because Lewis mite is not apparently responsive to the same materials and predators as two-spotted mite.
While the two-spotted mite generally has two larger dark spots on its back, Lewis mite has smaller dark spots that run along each side of the body. Lewis mite eggs are smaller than two-spotted mite eggs.
Lewis mite was found in Ventura-area strawberry production about ten years ago and it first appeared in the Salinas-Watsonville area in the last three years.
Feeding by Lewis mite kills leaves on strawberry plants and reduces yields. Both two-spotted mites and Lewis mites gather at the underside edge of leaves. Bolda said Lewis mite damage causes the leaves to have a purple tinge, and the damage tends to spread more slowly across a field. It is common to see both species on the same leaf at the same time.
Lewis mite has one larval and two nymphal stages prior to the adult stage. Eggs are laid on the leaf edges and larvae emerge after three days. Colonies are often found at leaf edges or veins.
A full life cycle of Lewis mite is about 14 days at 77 degrees F, according to UC IPM guidelines. The cycle can take fewer days at warmer temperatures. Two-spotted mites’ full lifecycle takes about five days at 75 degrees F.
Bolda noted that in mid-winter coastal strawberry growing areas, it is unusual for a large percentage of mites to become dormant. Instead, they continue to grow and lay eggs, although at a slower pace during the winter months.
In an efficacy study, Bolda said the most promising materials were tested first in a lab setting to get an idea of their control level.
The list included Oberon at 16 fl. oz. per acre; Vestis, a surfactant, at 13 fl. oz. per acre; Aza-Direct at 32 fl. oz. per acre; Agrimek at 16 fl. oz. per acre; and Nealta at 13.5 fl. oz. per acre. Ten leaves per treatment replicate were evaluated under a microscope. Adults and eggs were counted. Treatments were made January through mid-April. Numbers of Lewis mite were low until the end of March. Materials with the most efficacy were Vestis, Aza-Direct and Agrimek.
Complete information on this trial can be found on Bolda’s blog.
Progressive Crop Consultant Magazine’s popular two-day Crop Consultant Conference will return this year as a live conference and trade show, featuring seminars worth 10 hours of CCA and 8 hours of DPR continuing education credits, a live trade show, and the presentation of Western Region CCA Association’s popular CCA of the Year Award and honorariums and scholarships. The Crop Consultant Conference will be held on Sept. 16 and 17 at the Visalia Convention Center.
The Crop Consultant Conference has become a premier event held in the San Joaquin Valley each September for Pest Control Advisors and Certified Crop Advisers. Co-hosted by JCS Marketing, the publisher of Progressive Crop Consultant Magazine, and Western Region Certified Crop Advisers Association, the event brings industry experts and suppliers, researchers and crop consultants together for two days of education, networking and entertainment.
“We are excited to be back to doing our events in person, and expect another sell-out event for crop consultants in the Western United States,” said JCS Marketing Publisher and CEO Jason Scott. “Agriculture is a relationship-driven business and there is no substitute for live events.”
Topics for the two days of seminars include: Various seminars on managing pests and diseases in high-value specialty crops, tank mix safety and regulations, fertilizer management, soil health, new technology, new varieties and rootstocks and their impact on tree nut pest management.
The conference will conclude with two one-hour panels offering hard-to-get CCA credits and moderated by Western Region CCA related to nitrogen monitoring, use, application and management as well as the various regulatory requirements around irrigated nitrogen management.
Registration fees for the two-day event are $150, or less than $15 per CE unit. Pre-registration is required and can be done at progressivecrop.com/conference.
Cotton ribbon stretched around two rows of trees for continuous loop sampling.
The use of pesticides can be very effective in protecting trees from pests and diseases. However, many times this is also accompanied by negative impacts on humans and the environment. Off-target movement of chemical spray has always been a challenge for growers because it can contaminate the environment, reduce spray efficacy and impose liabilities.
California has stringent pesticide laws and regulations and orchard spray application is considered a high-risk operation. California law establishes a buffer between schools and any pesticide spraying location. Growers are required to notify the public when they spray pesticides. This includes schools, daycare facilities, and county agricultural commissions.
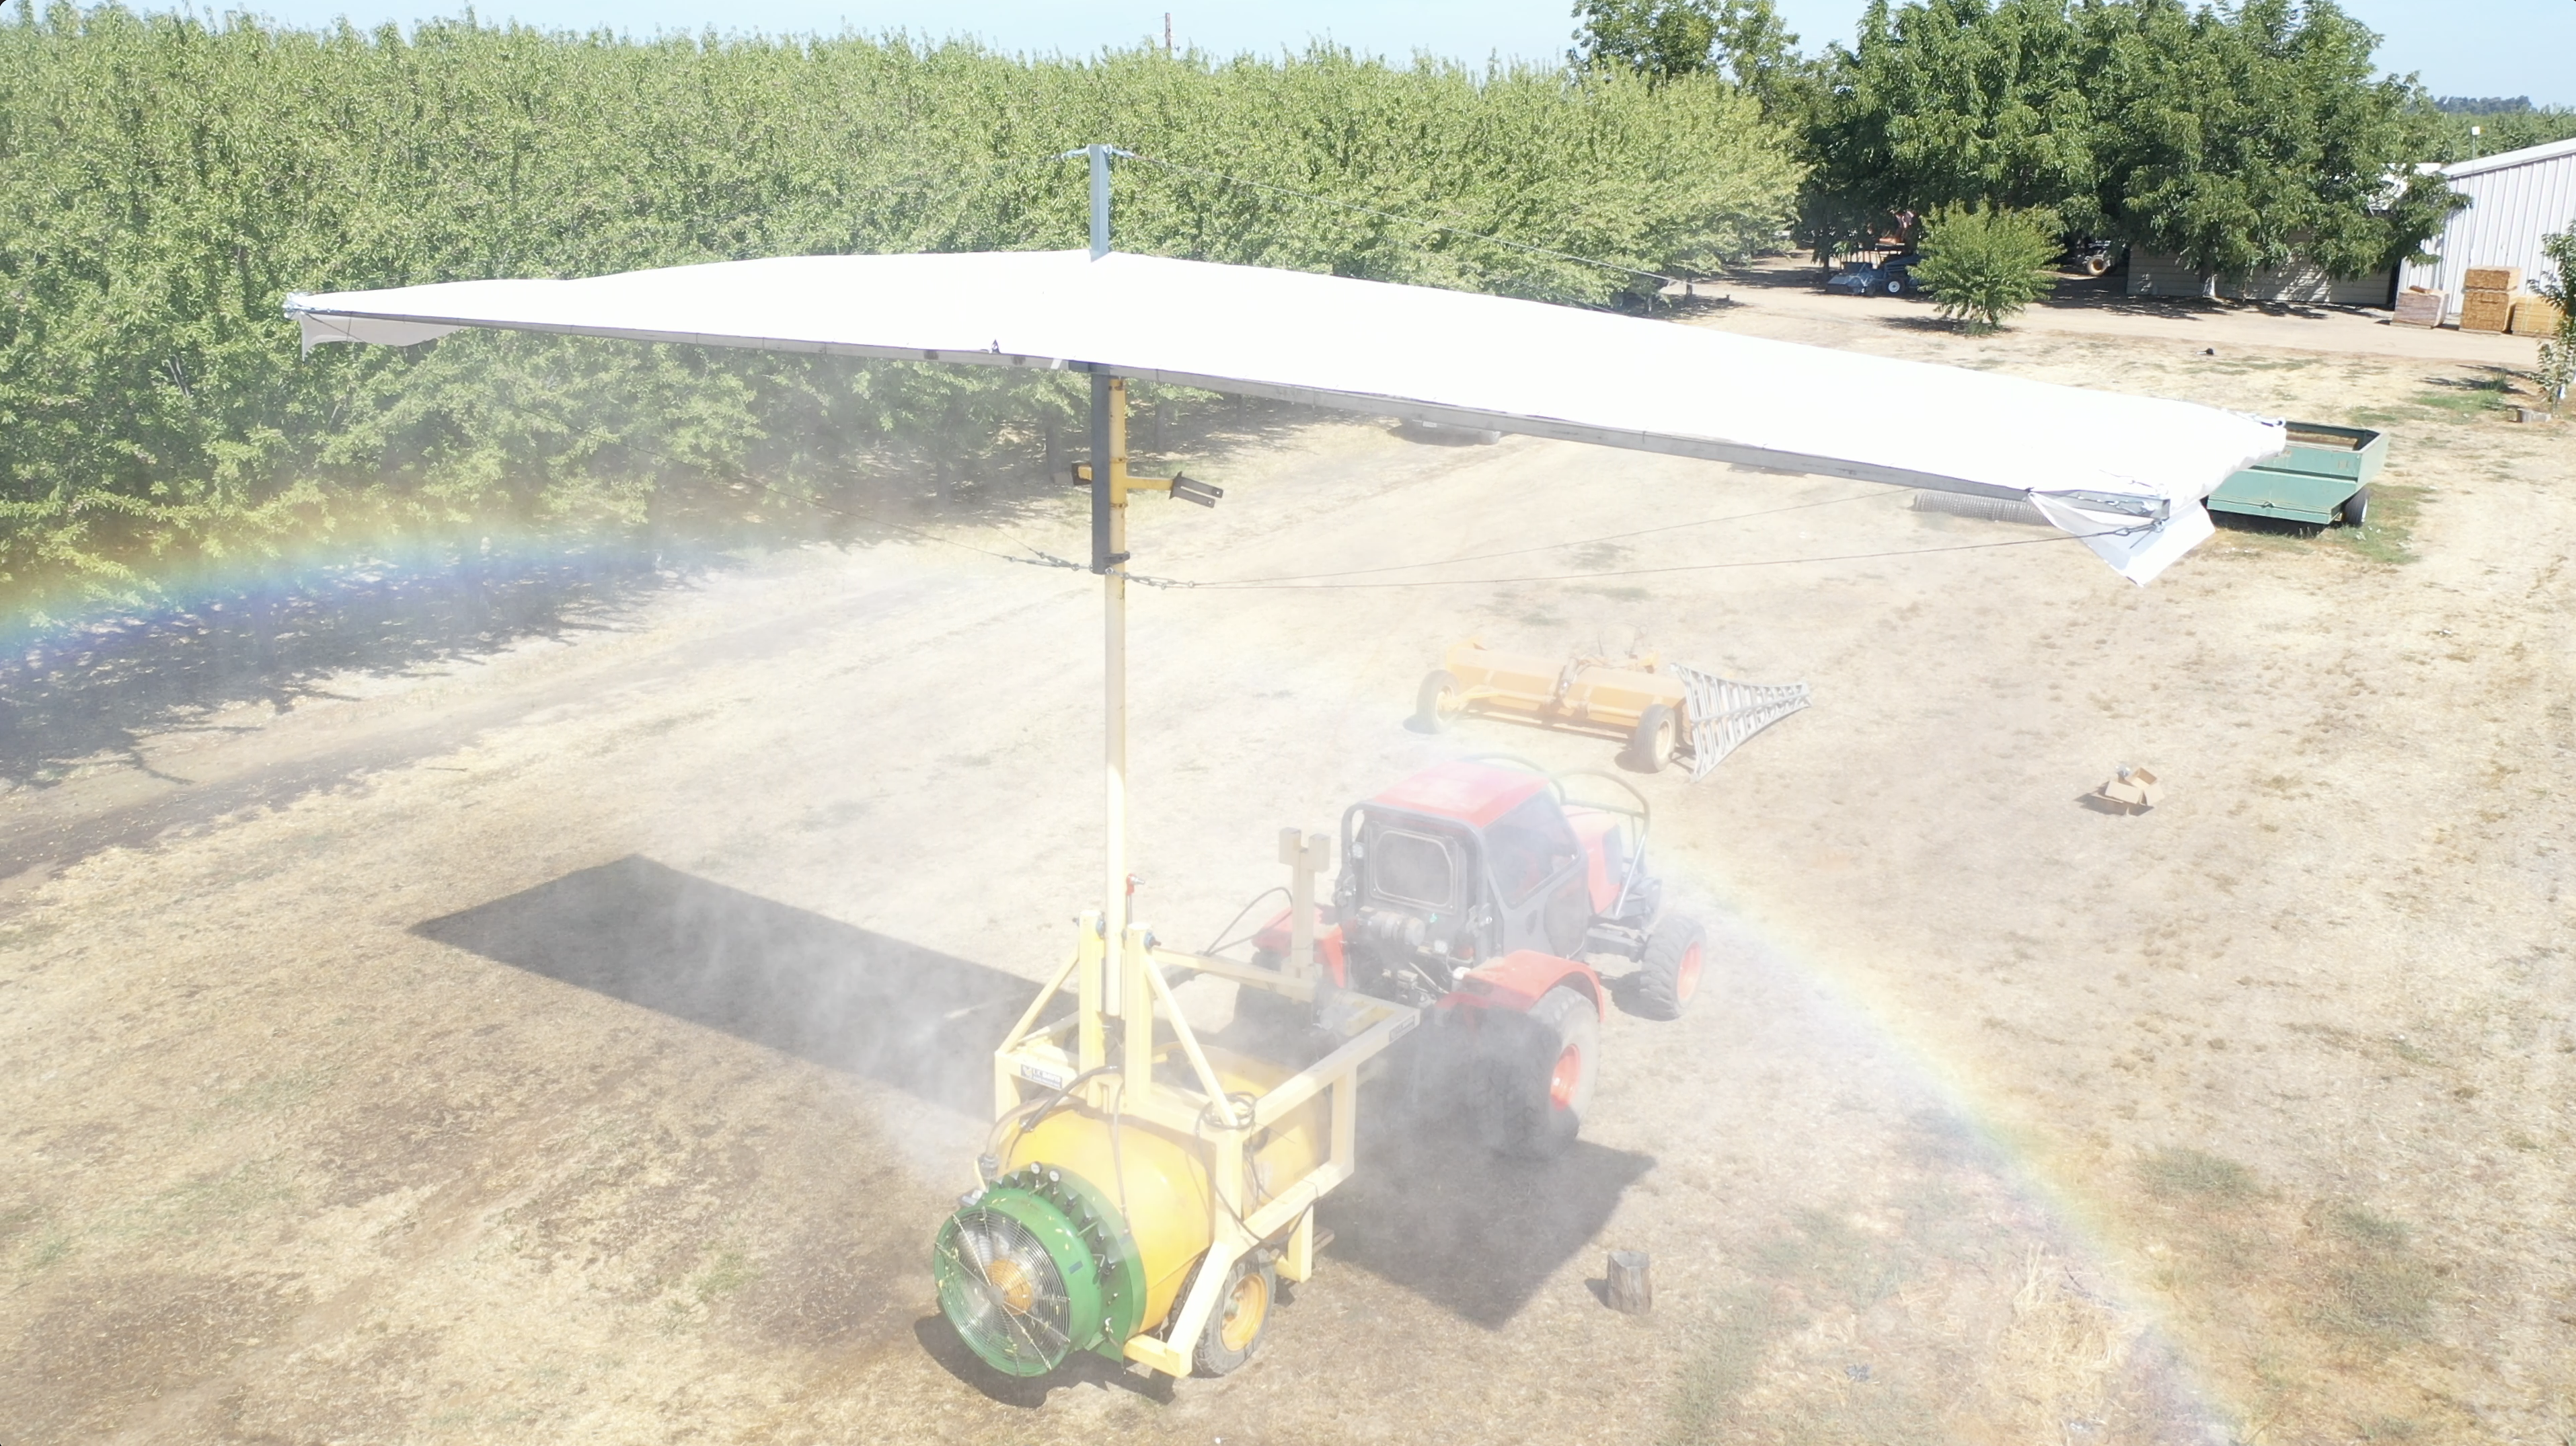
A prototype of the spray backstop system developed at the Digital Agriculture Lab at UC Davis.
Spray drift can be reduced by choosing the right type of nozzle, adjusting and calibrating sprayer settings, defining shelter zones and specifically modified practices in the downwind rows. Reducing the movement of spray droplets to sensitive areas might be accomplished by these methods, but they are in clear contrast with strategies that lead to a uniform on-target deposition. For instance, spraying with larger droplets can reduce the amount of drift, but it also decreases the effectiveness of the spray at higher parts of a tree. Likewise, reducing airflow results in reduced drift; however, it also diminishes the spray efficacy in zones farther from the sprayer, for example, on treetops. Drift can also be reduced when we use slower ground speed and higher liquid flow rate, but the impact is not significant.
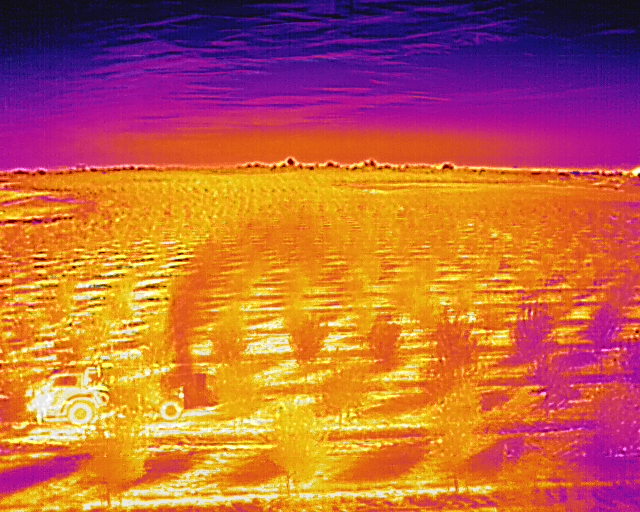
Thermal view of spray cloud escaping the canopy from the top.
Spray Backstop
At the Digital Agriculture Lab at UC Davis, a sprayer attachment system called Spray Backstop was developed to minimize drift potential and possibly improve spray coverage on the treetops. The backstop system is a screen structure that can be raised above the trees using a foldable mast.
A test was conducted in a mature almond orchard to determine how much drifting could be reduced with the backstop system. A cotton ribbon loop was stretched around the trees to quantify the droplets scaping the tree canopy. The ribbon could capture all spray droplets that did not deposit on-target and were not blocked by the backstop system.
The orchard was sprayed with a mix of water and fluorescent dye. The ribbon was cut into sub-samples and analyzed with the fluorometry method. Comparing the ribbon samples from the test with and without the backstop showed that the Spray Backstop system could effectively block the spray droplets escaping the canopy from treetops or sides and reduce drift potential by 78%. Leaf samples were also collected from trees in both spray application conditions and analyzed by the fluorometry technique. Unlike the conventional drift control methods, using the spray backstop system does not change overall canopy deposition and could also help improve deposition on treetops.
A sprayer working in a young almond orchard in Northern California (all photos courtesy Digital Agriculture Lab.)
Adopting the spray backstop system into the orchard spray application practice will reduce the environmental degradation while protecting residential areas and schools from exposure to chemicals. On the other side, growers can adjust their sprayer for more air and finer droplets (that will improve spray coverage and efficacy in the upper canopy area) without being concerned about drifting because the backstop system can stop spray droplet movement above the trees. A uniformly applied treatment will significantly reduce the risk of crop failure due to pests and diseases.
The spray backstop system is simple and could be easily implemented without significant modifications to the grower’s spray rigs. This system can help growers to be compliant with pesticide regulations and maintain good environmental stewardship. You can find more information about the spray backstop project at the digital Agriculture lab website: digitalaglab.ucdavis.edu.
Spray backstop blocking the spray cloud from moving upwards.
On-farm recharge has the potential to clean up groundwater that has been contaminated with nitrogen and/or pesticides (photo by H. Dahlke.)
Aquifers have become depleted from decades of overuse. Drilling deeper is an option for farmers, but prohibitively expensive for low-income residents in disadvantaged communities in the San Joaquin Valley.
A UC scientist believes managed aquifer recharge on agricultural lands close to populations with parched wells is a hopeful solution.
Helen Dahlke, professor in integrated hydrologic sciences at UC Davis, has been evaluating scenarios for flooding agricultural land when excess water is available during the winter in order to recharge groundwater. If relatively clean mountain runoff is used, the water filtering down to the aquifer will address another major groundwater concern: nitrogen and pesticide contamination.
“The recharge has the potential to clean up groundwater,” she said.
Five years ago, UCCE Specialist Toby O’Geen developed an interactive map (casoilresource.lawr.ucdavis.edu/sagbi/) that identifies 3.6 million acres of California farmland with the best potential for replenishing the aquifer based on soil type, land use, topography and other factors. Dahlke and her colleagues analyzed the map and identified nearly 3,000 locations where flooding suitable ag land will recharge water for 288 rural communities, half of which rely mainly on groundwater for drinking water. The research was published by Advancing Earth and Space Science in February 2021.
“If we have the choice to pick a location where recharge could happen, choose those upstream from these communities,” Dahlke said. “Recharge will create a groundwater mound which is like a bubble of water floating in the subsurface. It takes time to reach the groundwater table. That bubble floating higher above the groundwater table might just be enough to provide for a community’s water needs.”
Filling Reservoirs Under the Ground
Many climate models for California suggest long-term precipitation amounts will not change; however, the winter rainy season will be shorter and more intense.
“That puts us in a difficult spot,” Dahlke said. “Our reservoirs are built to buffer some rain storms, but are mainly built to store the slowly melting snowpack in the spring. In the coming years, all the water will come down earlier, snowmelt likely in March and April and more water in winter from rainfall events.”
She is working with water districts and farmers to consider a change in managing water in reservoirs.
“We want to think about drawing reservoirs empty and putting the water underground during the fall and early winter. Then you have a lot of room to handle the enormous amounts of runoff we expect when we have a warm atmospheric river rain event on snow in the spring,” she said. “However, farmers are hesitant. They like to see water behind the dams.”
Interest in groundwater banking has been lifted with the implementation of the 2014 Sustainable Groundwater Management Act (SGMA). The law requires governments and water agencies to stop overdraft and bring groundwater basins into balanced levels of pumping and recharge by 2040. Before SGMA, there were no statewide laws governing groundwater pumping, and groundwater was used widely to irrigate farms when surface supplies were cut due to drought.
“For some of the drought years, overdraft was estimated to be as high as nine million acre-feet a year,” Dahlke said.
Dahlke believes wintertime flooding for groundwater recharge can help water districts meet SGMA rules. “We have to do anything we can to store any surplus water that becomes available to save it for drier times, and our aquifers provide a huge storage for that,” she said.
Helen Dahlke, professor in integrated hydrologic sciences at UC Davis, has been evaluating scenarios for flooding agricultural land when excess water is available during the winter in order to recharge groundwater (photo by Joe Proudman, UC Davis.)
Farming Impacts
The Dahlke Lab is collaborating with UC ANR farm advisors and specialists as well as scientists at other UC campuses to learn about agronomic impacts of flooding a variety of agricultural crops, including almonds, alfalfa and grapes.
In the San Joaquin Valley, UCCE Irrigation Specialist Khaled Bali led an intermittent groundwater recharge trial on alfalfa. The researchers applied up to 16 inches per week with no significant impact on alfalfa yield.
“You could do groundwater recharge in winter and then turn the water off completely and still get a cutting or two of alfalfa before summer,” he said.
This past winter, Dahlke was prepared to flood 1,000 acres of land with water from the Consumnes River. Even though winter 2020-21 was another drought year, the research will go on. Her team was able to flood a 400-acre vineyard and, in collaboration with scientists from UC Santa Cruz, deploy sensors in the field to measure infiltration rates to better understand whether sediment in the flood water could clog pores in the soil. Her team also collaborates with Ate Visser of Lawrence Livermore National Laboratory in using isotope and noble gas data to determine the groundwater age and flow.
The Dahlke Lab’s groundwater banking project has planned more studies in groundwater basins across the state to close knowledge gaps on suitable locations, technical implementation and long-term operation. They also plan to address operational, economic and legal feasibility of groundwater banking on agricultural land.
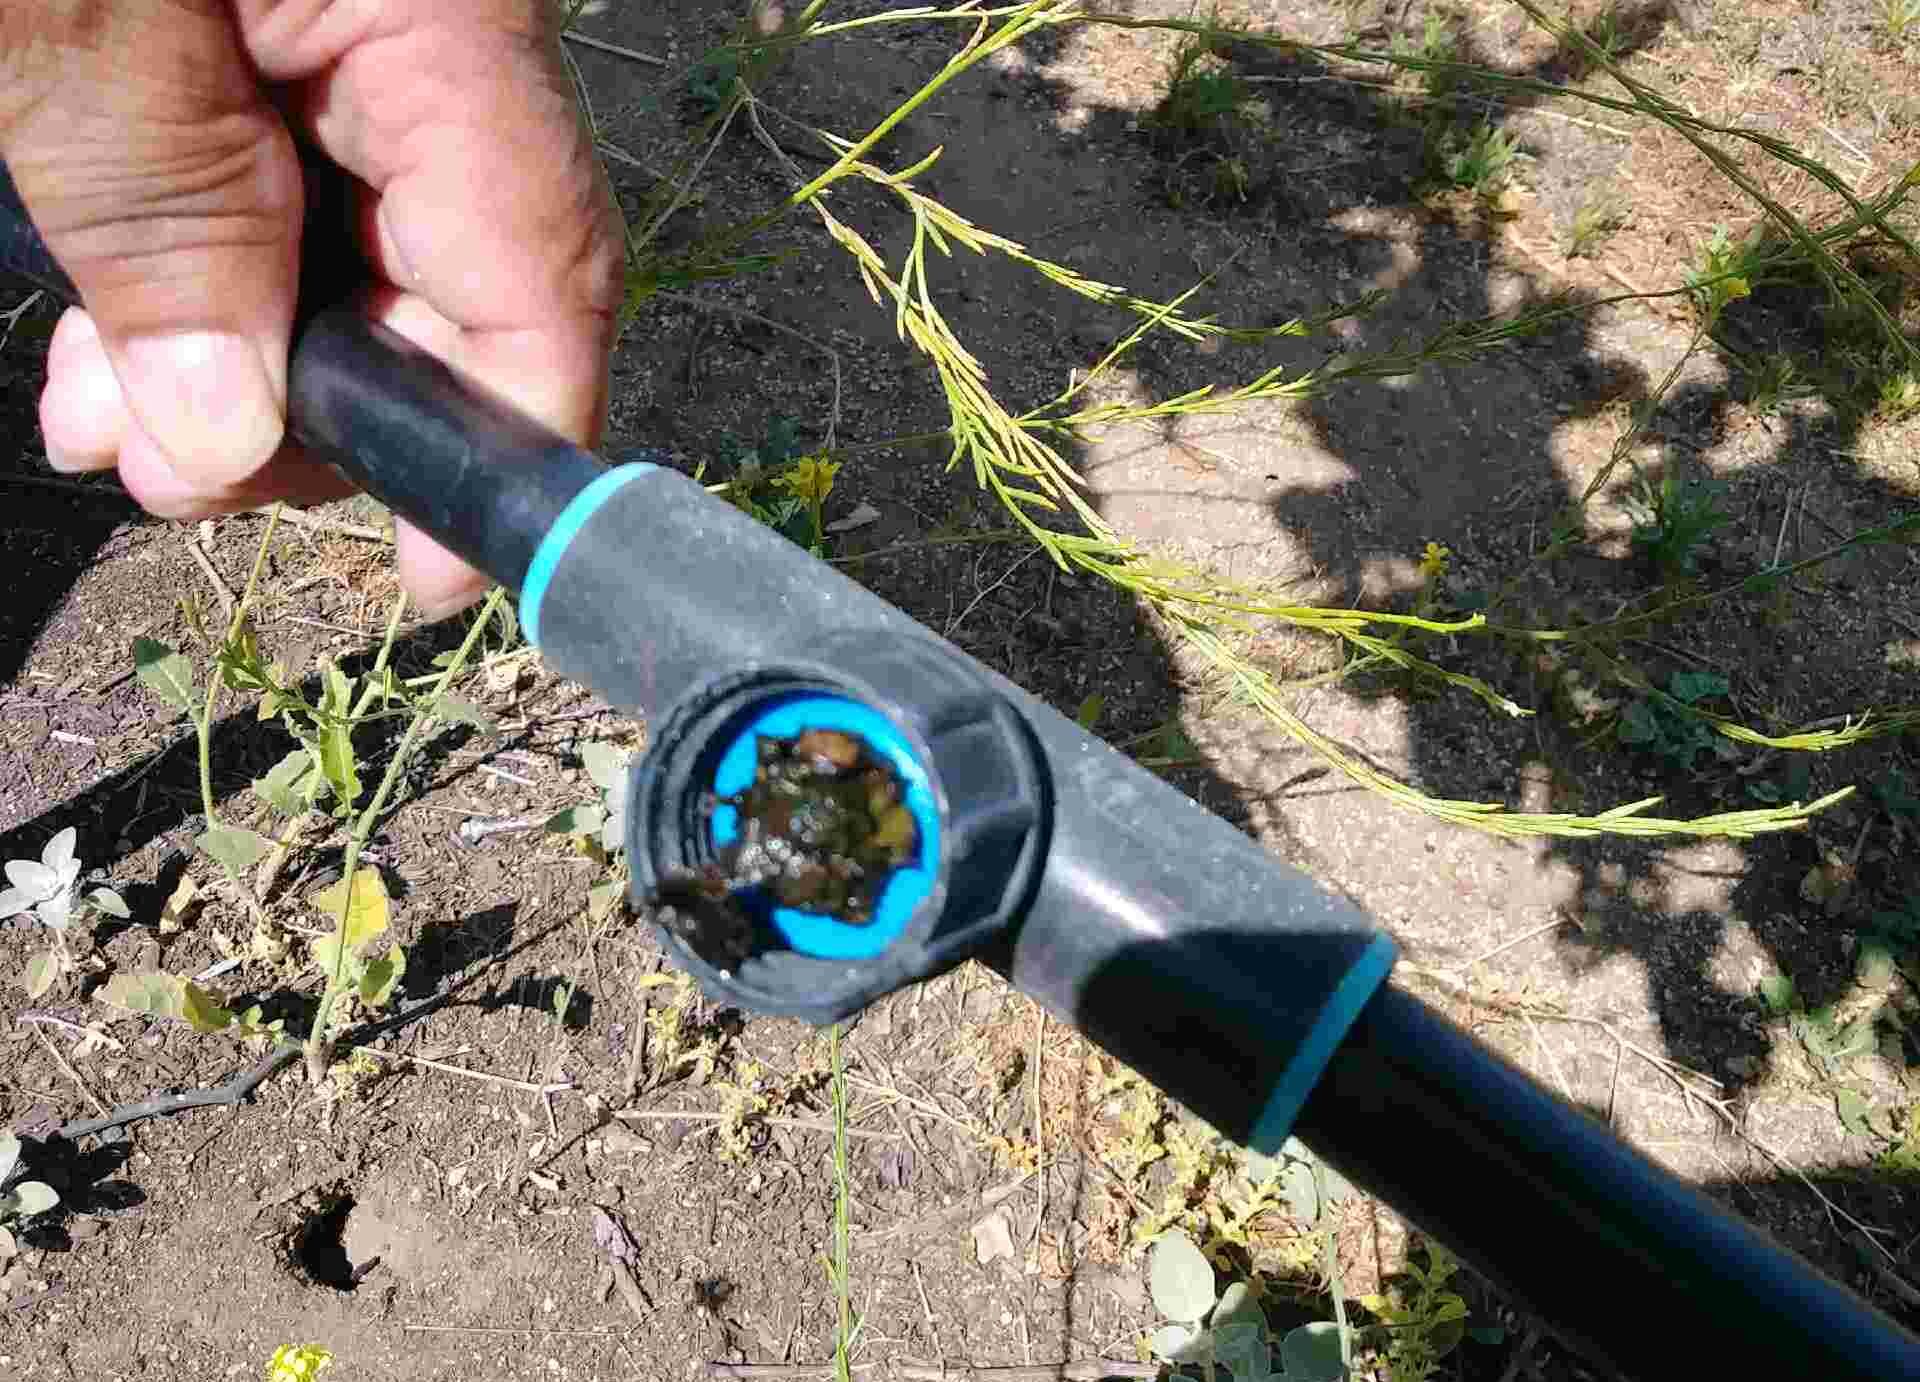
Flush lines regularly to prevent clogging, particularly after fertilizer injections (all photos courtesy Wilbur-Ellis Agribusiness.)
Nut growers are essentially paid in two ways: they can either produce higher yields or reduce the number of deductions from the processor. When nut trees aren’t receiving enough water, you’ll see an increased number of blanks, shriveled kernels and pinched kernels. It’s also common to see more disease and mite activity in the orchard. All of these issues can hurt final nut grade and yield, which ultimately affects grower payouts from the processor.
During this tight water year, it’s more important than ever to help growers implement a science-based approach to reduce the risk of disease and maximize orchard yields. In years of drought, salinity levels in the soil are going to rise, making it critical to keep orchards at proper field capacity so that trees do not suffer from physiological drought stress.
This is not as simple, however, as ensuring the right amount of water is applied to the orchard. Growers are going to be pressured to match water deliveries to crop stage and demands throughout the season, rather than honing in on evapotranspiration (ET) rates.
So the question for CCAs and PCAs is, “How do we help growers implement a strategic irrigation schedule?” My answer starts and ends with measurement. When you ask growers how much water they’re putting out, they often come back with a number of hours irrigated. But this number does not tell you how much water is being applied to an orchard; that can be drastically different based on application rates.
The first step in making the most of irrigation is working with your growers to understand how many inches of water per acre of soil the irrigation system puts out per hour. This piece of information is often overlooked but is essentially the backbone of a good irrigation schedule. Everything else should be calculated based on that application rate. When water is limited, it’s also helpful to know the exact depth of soil that needs to be wetted to avoid overirrigating.
An individualized irrigation plan and schedule takes into account a grower’s water quality and goals.
Measuring Orchard Demands
After the exact application rate is determined, growers can start designing an irrigation schedule that meets the needs of their orchards.
Irrigation scheduling maximizes the use of available water by applying the exact amount of water needed to replenish soil moisture. This practice offers growers numerous potential benefits:
Possibly reduces the grower’s cost of water through more efficiently timed irrigations.
Lowers fertilizer costs by limiting surface runoff.
Maximizes net returns by increasing crop yields and crop quality.
Aids in controlling root zone salinity accumulation through controlled leaching.
Decreases common disease pressures.
I once worked directly with a walnut grower who was able to increase edible yield by 4% just from having a better understanding of his irrigation output rates and adopting a more scientific irrigation approach. By measuring crop-water demand and optimizing water usage, the grower saw dramatic benefits in nut quality across the board, including both color and size advantages.
There are essentially three approaches to water management, and growers should use at least two of the following to design an irrigation schedule:
Soil-Based Approach
Soil-based methods are simply measuring how much water is being stored in the soil. If there is less water in the soil, and the water is held at a greater tension, it will be more difficult for the trees’ roots to take up that water, resulting in tree stress.
While irrigating based on the feel or appearance of the soil is a commonly used method, more precise measuring tools such as tensiometers, probes and electrical resistance blocks will provide more specific information that growers can utilize to produce healthier, more consistent nut crops.
Like the other approaches mentioned below, soil moisture readings can be used by themselves to schedule irrigations, but they are most beneficial when used in combination with other methods of irrigation scheduling.
Probes, for example, are very good at giving the user a snapshot of what the soil moisture looks like at varying depths. It will determine how deep in the soil profile water is infiltrating and ensure calculated water applications are not over- or under-irrigating trees. However, these probes do not tell you how often or how long to irrigate. Combining the data from the probes with ET measurements on a regular basis will provide enough information to make a strategic irrigation schedule.
Climate-Based Approach
This approach requires a deeper understanding and balancing of irrigation application rates and ET. This is the combination of transpiration, or water evaporation from plant leaves, and evaporation from the soil surface.
Many factors affect ET, including air temperature, humidity and wind speed; soil factors such as texture, structure and density; and plant factors such as plant type, root depth and canopy density, height and stage of growth.
Reference ET information is available from a variety of sources, but most well-known is the California Irrigation Management Information System (CIMIS) network of nearly 100 California weather stations that provide daily ET values.
Knowing how closely the amount of irrigation water plus rainfall matches estimates of real-time orchard ET can help make irrigation scheduling decisions, especially if this information is teamed with other measurement approaches.
Plant-Based Approach
Plants respond in different ways to keep their water supply and demand in balance, and most plant-based methods for irrigation management are based on the measurement of one or more of these responses.
The pressure chamber method for measuring the tension of water within the plant has been shown to be a reliable and commonly used measurement of stress in orchards.
One drawback of using a pressure chamber is that the tool doesn’t distinguish between types of stress. If you are utilizing a pressure chamber in a particularly weak or diseased portion of the orchard, it will not decipher between stress due to poor water supply, salinity and/or pests. This is why it’s important to measure crop-water demands with a climate- or soil-based approach in addition to the pressure chamber approach.
By using ET and a pressure chamber, we found that one almond grower was putting out the right amount of water in the orchard, but the watering interval was too wide. Once the water interval was shortened, trees experienced less stress and were able to produce a much better crop.
I always encourage growers to utilize at least two of the three water management approaches because in the orchard, data or feedback you get from each approach doesn’t always line up perfectly. There’s always some subjectivity. Carefully evaluating the information provided by multiple sources can help determine the best irrigation schedule for your growers’ orchards this year.
Maximizing Irrigation Scheduling ROI
There is not a one-size-fits-all irrigation approach or schedule, and choosing which tools to use depends on water quality available to the grower and operation goals.
Combining a plant-based approach with a climate-based approach has been the most effective in my experience, but there are certainly benefits to monitoring soil moisture status in combination with either of the other two methods .
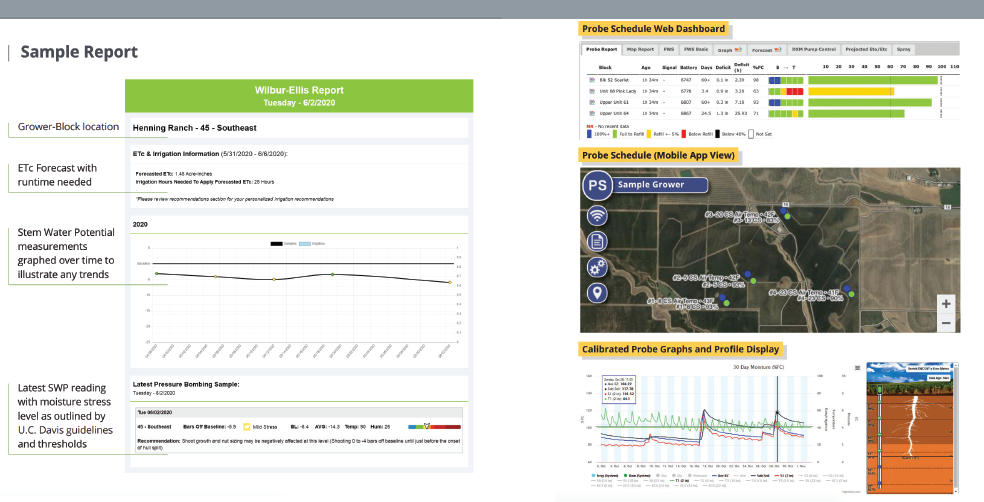
Companies like Wilbur-Ellis Agribusiness are beginning to offer irrigation scheduling services (Figure 1), that include weekly plant stress readings, soil moisture conditions and watering interval recommendations based on replacement ET.
Figure 1: Soil monitoring reports can help growers and crop advisors understand what is happening with soil moisture in real time.
These programs have been shown to reduce drastic swings in irrigation protocols, which in turn reduces pest and disease pressures on orchards. These programs also allow growers to focus on other aspects of irrigation and orchard management rather than worrying about interpreting results.
Another critical piece of irrigation management to keep in mind is system maintenance, which includes in-season flushing. Keeping a clean system with good distribution uniformity is essential when growers are trying to get the most out of orchard irrigation scheduling (Figure 2).
Figure 2: System maintenance is key to more efficient water delivery.
Key In-Season Flushing Protocols
Regularly flush laterals (monthly, bi-weekly if needed).
Flush complete system after fertilizer injections.
Flush from larger to smaller lines; mains and submains, then laterals.
When flushing lateral lines, ensure proper velocity and volume to purge contaminants.
Never open more than five to eight laterals at a time, as additional open lines will reduce the velocity of flow, which reduces the effectiveness of the flush (dependent upon the total number of laterals per block).
Always note pressures and flows at the initial system start-up. Changes in these parameters often indicate in-season issues.
Honey bee on brassica flower in Shafter (all photos courtesy S. Shroder.)
Cover crops can provide many benefits to growers, like improving water infiltration and reducing nutrient loss. However, growers in California’s southern San Joaquin Valley worry that the lack of consistent winter rainfall and high cost of water in the area make cover cropping impractical (Mitchell et al. 2017).
In this article, we’ll discuss how well different cover crop mixes suppressed weeds, provided resources for beneficial insects and improved water infiltration. We’ll also delve into water requirements and effects on soil nitrate.
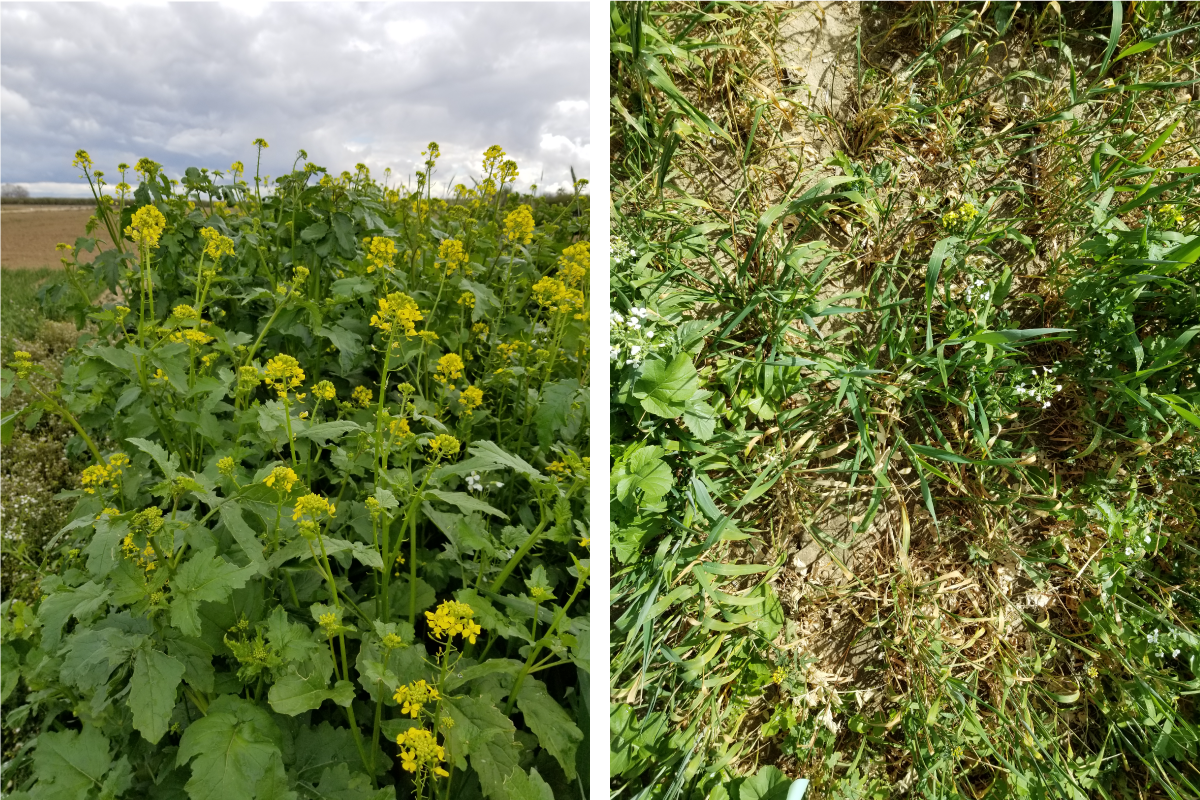
Irrigated (left) and non-irrigated (right) soil builder mix in Shafter on March 11, 2021.
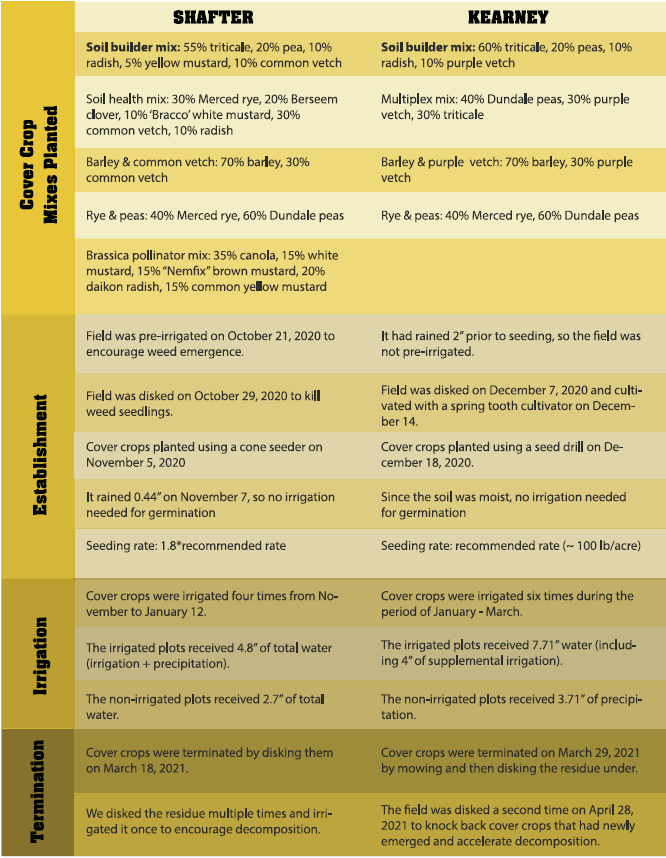
Location of Trials & Cover Crop Species Selection
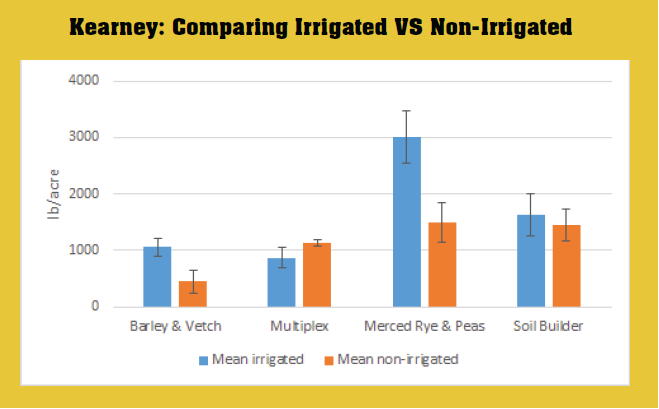
These trials took place at UC-managed research farms in Shafter (Kern County) and Parlier (Fresno County). The Parlier research farm is the Kearney Agricultural Research and Extension Center and will be referred to as “Kearney” for the remainder of this article.
Four common cover crop mixes were planted at Kearney and five mixes were planted at Shafter (Table 1). Three of the mixes were similar in both locations. We worked with Kamprath Seeds to select cover crop species based on mixes that had done well in a demonstration trial in Shafter the previous year. Two beginner-friendly simple mixes were also evaluated.
Based on the results of our trial, we have outlined some suggestions for trying out cover crops on your farm. Our suggestions depend on your goals for planting cover crops and your concerns about fitting them into your existing cropping system.
Goal: Weed Suppression
Based on the trial results, if your goal is weed suppression, you may consider the following.
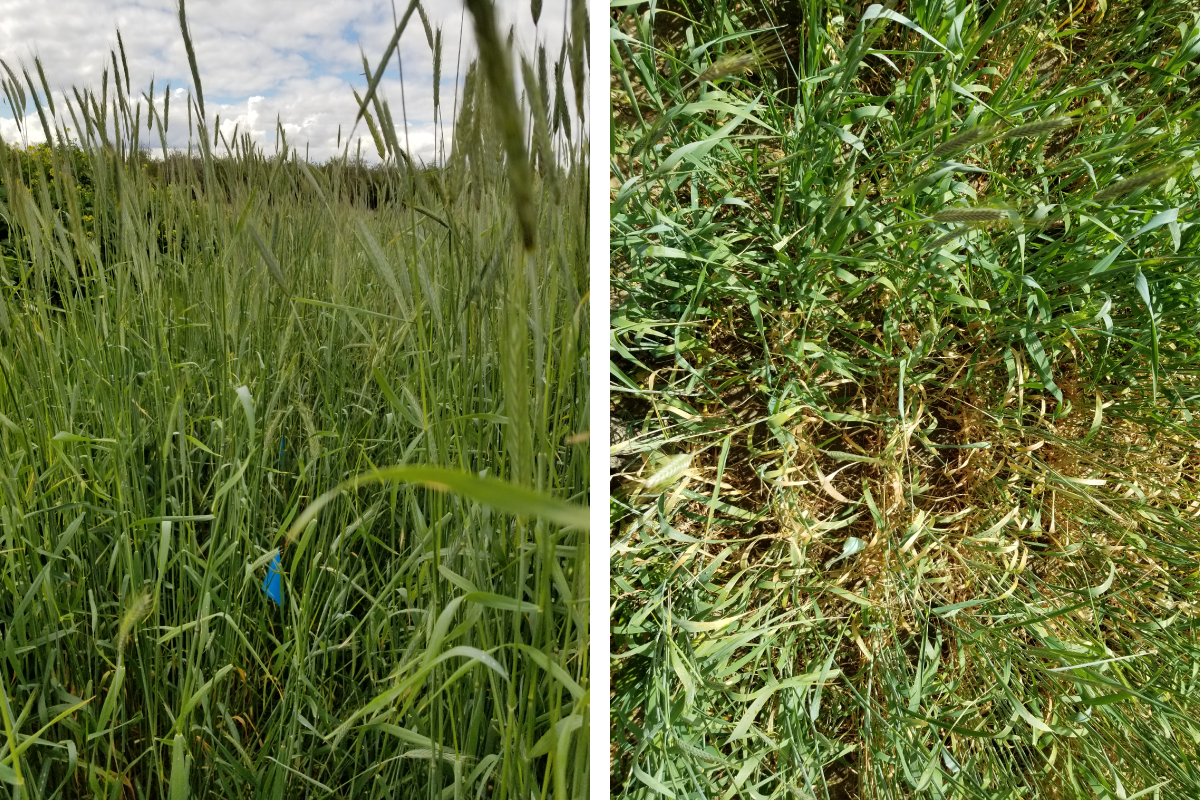
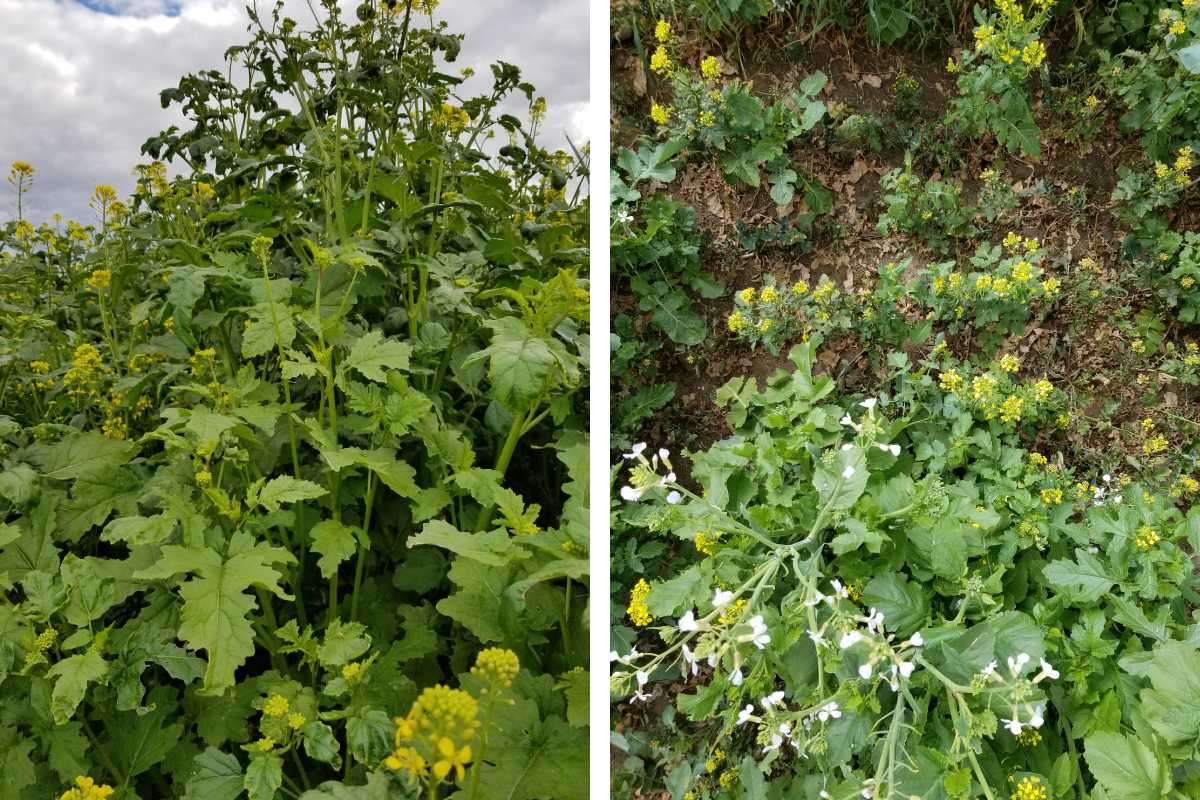
Grasses appeared to be most effective at suppressing weeds, especially Merced rye which grew vigorously in both irrigated and non-irrigated plots at both locations. Brassicas also contributed to weed suppression, while legumes were least competitive with weeds, especially at Kearney.
If your goal is weed suppression, consider higher percentages of grasses and brassicas in your seed mix.
Irrigated (left) and non-irrigated (right) barley & common vetch in Shafter on March 11, 2021.
Higher seeding rates led to greater weed suppression. If weed suppression is your goal, consider seeding at rates higher than recommended.
If it is not realistic to purchase enough seed for higher seeding rates, pre-irrigating before the first rain to allow weeds to germinate, followed by cultivation prior to planting, can help knock back weeds that may compete with cover crops at germination.
If pre-irrigation is not possible, consider waiting for weed seeds to germinate after the first decent rain, then cultivating your field before planting your cover crop.
However, try to not wait too long, as colder temperatures may inhibit germination. This may have been another reason why cover crop establishment was not as vigorous at Kearney; we planted on December 18 when the high temperature was 53 degrees F and the low was 40 degrees F. Compare this to the planting date of November 5 in Shafter where the high was 20 degrees F warmer (high of 73 degrees F, low of 52 degrees F).
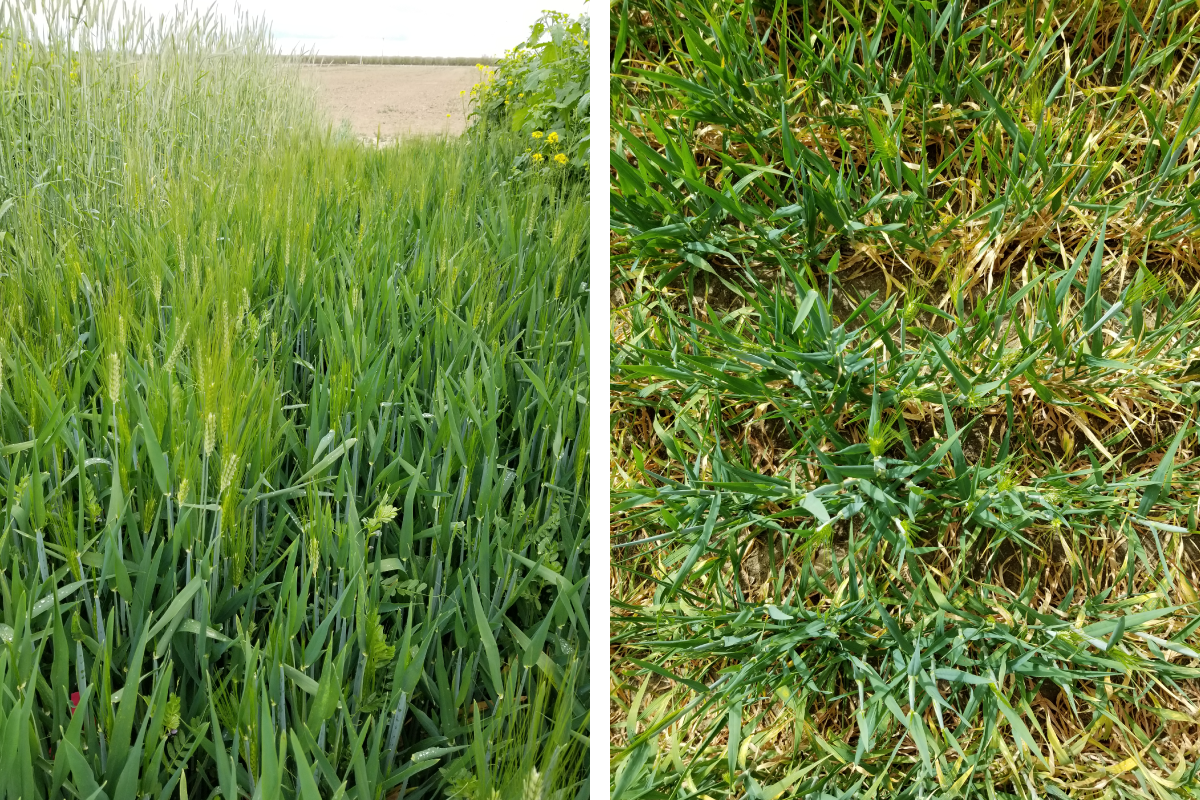
Irrigated (left) and non-irrigated (right) rye & peas in Shafter on March 11, 2021
With legume species, in particular, less initial germination correlated with a low percentage of legume species in the final stand. Grasses, however, germinated well in both locations and dominated the final stand.
Therefore, if you cannot plant until later in the winter, consider seeding grass seeds in higher proportions, especially if weed suppression is your goal.
Irrigating directly after seeding may help cover crops establish more vigorously and compete with weeds. If you are not able to irrigate your cover crop, planting right before a rain event can help your cover crops establish a better stand.
Do not assume that there is enough moisture in the soil to help your cover crops properly germinate if you are planting after a rain event.
Irrigated (left) and non-irrigated (right) soil health mix in Shafter on March 11, 2021.
Goal: Provide Resources for Beneficial Insects
The legumes in both locations did not perform well, so they did not offer much sustenance for pollinators.
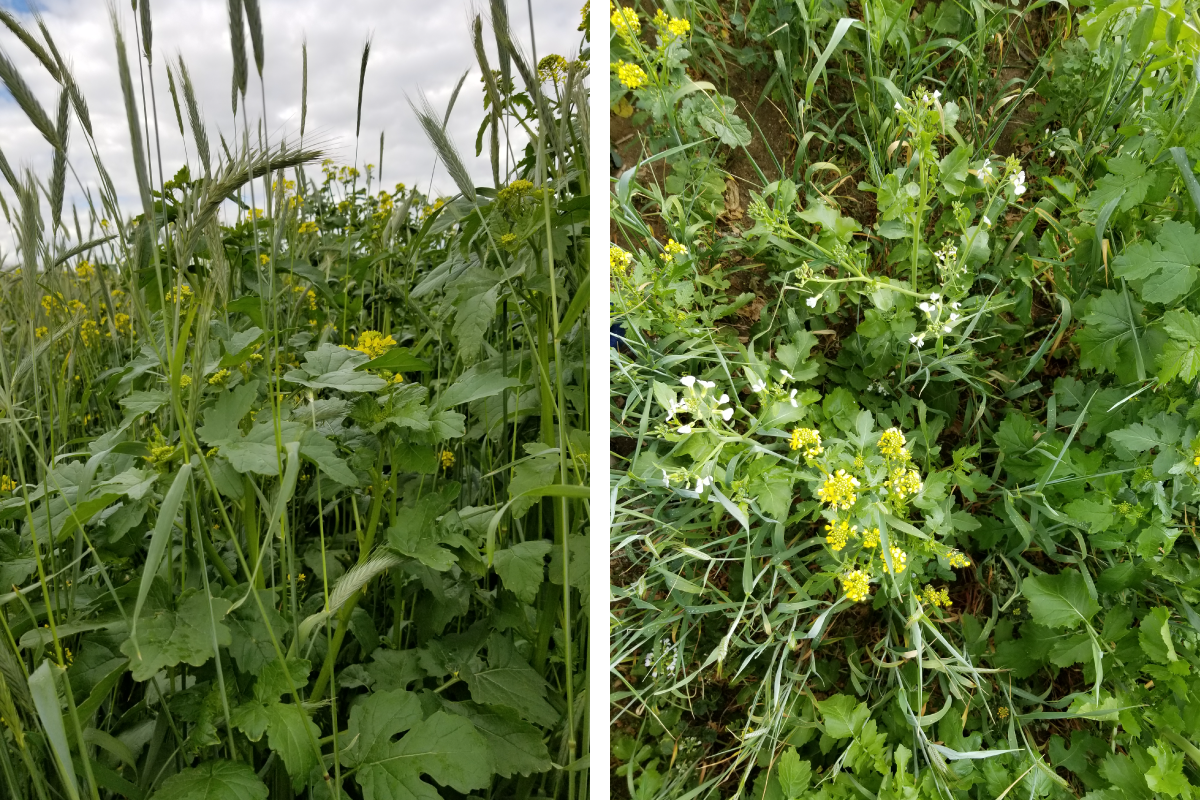
The brassicas in Shafter started blooming at the beginning of February, while the radishes at Kearney started blooming in mid-March. This provided forage and diversity for the pollinating bees from the surrounding almond orchards. Butterflies were also observed on these flowers.
Ladybugs were seen on the grasses in both locations, which can serve to keep aphid populations low on surrounding or subsequent crops.
Goal: Improve Water Infiltration
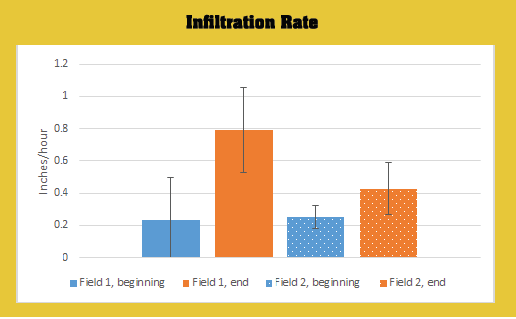
At Kearney, water infiltration was measured using a mini disk infiltrometer before planting cover crops and right before termination of cover crops.
Infiltration rates were higher when cover crops were in the ground compared to the bare soil prior to planting cover crops (Figure 1).
Figure 1: Infiltration rates in both fields at Kearney before the cover crops were planted (blue) and while the cover crops were fully established (orange).
There were no significant differences in infiltration across seed mixes. Therefore, based on our results, there is not one particular mix we would recommend to improve water infiltration.
Having roots in the ground improves the ability of water to enter the soil surface. Roots create channels for water to enter so that more water can be stored in the soil.
With lower infiltration rates, water is more likely to run off the surface. This is why avoiding bare soil is important if your goal is to increase the amount of water that can be stored in your soil.
Concern: Will the Cover Crops Tie Up Soil Nitrogen?
In Shafter, we took soil samples zero to six inches deep on April 21 in the irrigated plots five weeks after termination. The fallow samples had an average soil nitrate level of 45.8 mg/kg, which was similar to the soil nitrate level that we measured before planting the cover crops.
Two of the mixes had soil nitrate levels that were very close to that of the fallow area: the brassica pollinator mix and the soil builder mix. Those mixes were mostly or entirely brassicas, so they decomposed quickly enough that the nitrate they had taken up had returned to the soil. The other three mixes (soil health, rye and peas, and barley and vetch) led to significantly lower soil nitrate levels.
Grasses have higher C:N ratios, which meant that soil microbes took longer to decompose their residue and needed to mine soil nitrogen to do so.
Concern: Can I Really Grow Cover Crops Without Irrigation?
Shafter
All of the non-irrigated plots contributed some amount of biomass. This means that even if you cannot irrigate your cover crops, you can still reap some soil health benefits.
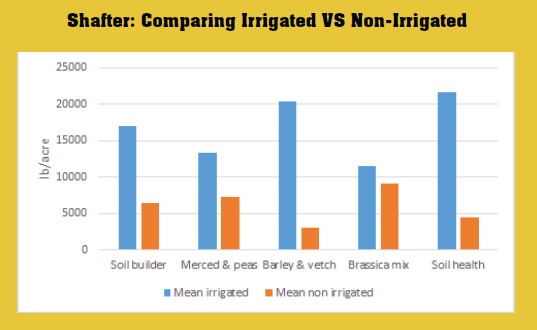
For four of the mixes, the irrigated plots produced at least twice as much biomass as the non-irrigated plots. In contrast, the non-irrigated brassica plots produced almost as much biomass as the irrigated brassica plots (Figure 2).
Figure 2: Aboveground dry biomass was collected in Shafter on March 17, 2021.
Kearney
The differences in biomass between the irrigated and non-irrigated plots were not significant, except for the irrigated Merced rye and peas and the irrigated barley and vetch. These two irrigated mixes yielded nearly twice as much biomass as their non-irrigated counterparts (Figure 3). This biomass was mostly attributable to the grasses in both mixes.
Figure 3: Aboveground dry biomass was collected in Kearney on March 22, 2021.
The non-irrigated side produced an impressive amount of biomass given that it only received 3.71 inches of water.
The mixes that performed best without irrigation were the Merced rye and peas and the soil builder mix. The daikon radish performed well in the soil builder mix without supplemental irrigation, and the Merced rye performed well in the rye and peas mix without supplemental irrigation. Therefore, Merced rye and radish would be good options if you are unable to irrigate your cover crops.
Conclusion
Based on the results of our trial, cover crops can still produce biomass without irrigation in the San Joaquin Valley, even during a drier winter. While they may not produce huge amounts of biomass without irrigation, having roots in the ground is still beneficial for suppressing weeds, providing beneficial insect habitat, increasing water infiltration and feeding your soil biology.
Cover crops turn sunlight into carbon that feeds your soil microbes through their root system. Therefore, by simply maintaining living ground cover, you are feeding your soil. In addition, when you return cover crop residues to your soil, microbes will decompose them and slowly release available nutrients that can be used by your cash crop.
If you are growing cover crops in a limited water environment, consider planting Merced rye and brassica species, such as daikon radish or mustards. These are also good options if you plant your cover crops later in the winter.
Irrigated (left) and non-irrigated (right) brassica pollinator mix in Shafter on March 11, 2021.
Triticale also grows well with limited water and decomposes more quickly than Merced rye, which is something to consider if you are disking in your cover crop and planting an annual crop shortly after.
In both Shafter and Kearney, the legume species did not perform well because of the high soil nitrate levels and low water conditions. If your field is in a similar situation, it might be better to save money and not buy legume seeds.
You should also think about the cash crop that will follow the cover crop. For example, you do not want to plant a brassica cash crop after a brassica cover crop. This might increase pest pressure for your brassica cash crop.
Interested in trying out cover crops? The USDA and the California Department of Food and Agriculture have programs to help you pay for it. For more information about the USDA resources, reach out to your local USDA Natural Resource Conservation Service office. For more information about the CDFA Healthy Soils Program or getting started with cover crops, reach out to Shulamit Shroder at sashroder@ucanr.edu or Jessie Kanter at jakanter@ucanr.edu.
Resources
Mitchell, J. P., Shrestha, A., Mathesius, K., Scow, K. M., Southard, R. J., Haney, R. L., Schmidt, R., Munk, D.S. & Horwath, W. R. (2017). Cover cropping and no-tillage improve soil health in an arid irrigated cropping system in California’s San Joaquin Valley, USA. Soil and Tillage Research, 165, 325-335.
Damaged citrus leaves due to Asian Citrus Psyllid feeding. Researchers have identified a list of candidate plant immune regulators that may contribute to HLB-tolerance (photo courtesy USDA-ARS.)
Citrus Huanglongbing (HLB, citrus greening disease) is caused by the vector-transmitted phloem-limited bacterium Candidatus Liberibacter asiaticus (CLas). It is the most destructive disease which infects all commercial citrus varieties and threatens citrus industries worldwide (Bove 2006; Graham et al. 2020). Current management strategies include insecticide application to control the transmission vector Asian citrus psyllids (ACP) and antibiotics treatment to inhibit CLas (Barnett et al. 2019), but neither could control HLB effectively. Since the first report of HLB in Florida in 2005, citrus acreage and production in Florida decreased by 38% and 74%, respectively (Graham et al. 2020; Stokstad 2012). The disease has spread to citrus-producing states, including Texas and California. In severely affected areas, such as Florida, effective therapy is demanded because disease eradication is impractical. In recently impacted areas, such as California, preventing new infections is most urgent. Hence, innovative therapeutic and preventive strategies to combat HLB are urgently needed to ensure the survival of the citrus industry.
One of the most effective and eco-friendly strategies for disease management is to utilize plant innate immunity-related genes from disease-resistant or tolerant varieties for plant protection. Upon pathogen infection, plant defense response genes undergo expression reprogramming to trigger plant innate immunity. Plant endogenous small RNAs play a pivotal role in this regulatory process (Huang et al. 2019; Zhao et al. 2013b), including phytohormone- and chemical-induced systemic acquired resistance or defense priming, which can promote robust host immune responses upon subsequent pathogen challenges (Brigitte et al. 2017; Zheng Qing and Xinnian 2013).
Our Approaches
HLB tolerance has been observed in some hybrids (e.g., US-942 and Sydney hybrid 72 (Albrecht and Bowman 2011, 2012a)) or citrus relatives (e.g., Microcitrus australiasica, Eremocitrus glauca and Poncirus trifoliata) (Ramadugu et al. 2016). By comparative analysis of small RNA profiles and the target gene expression between HLB-sensitive cultivars and HLB-tolerant citrus hybrids and relatives (Albrecht and Bowman 2011, 2012a), we identified a list of candidate natural defense genes potentially responsible for HLB tolerance (Huang et al. 2020). One of the candidate regulators is a novel anti-microbial peptide (AMP), which we named “stable antimicrobial peptide” (SAMP). Here, we demonstrate that SAMP not only has antimicrobial activity but also has priming activity and can induce citrus systemic defense responses. This dual-functional SAMP can reduce CLas titer, suppress disease symptoms in HLB-positive trees and activate plant systemic defense responses against new infection.
Results
Through the comparative expression analysis of small RNAs and the target genes between HLB-sensitive cultivars and HLB-tolerant citrus US-942 (Poncirus trifoliata x Citrus reticulata) and microcitrus Sydney hybrid 72 (Microcitrus virgate from M. australis × M. australasica) (Huang et al. 2020), we identified a list of candidate plant immune regulators that are potentially contributable to HLB-tolerance. One candidate regulator is a 67-amino acid (aa) peptide, SAMP, that was predicted with antimicrobial activity (Park et al. 2007). SAMP has significantly higher expression levels in both HLB-tolerant hybrids US-942 and Syd 72 than the HLB-susceptible control trees. We further cloned SAMP genes from HLB-tolerant citrus relatives. We found that SAMP transcripts are closely related and have a significantly higher expression level in HLB-tolerant varieties. We further detected the 6.7kD SAMP in the phloem-rich tissue; bark peels of HLB-tolerant Ma and Pt but not in the susceptible Cs. These results support that the SAMPs are likely associated with the HLB-tolerance trait. According to our functional analysis of SAMP, we list the advantages of using SAMP to manage citrus HLB as the following:
SAMP has bactericidal activity and is heat stable.
We screened SAMPs from several citrus relatives using a C. Liberibacter solanacearum (CLso)/potato psyllid/Nicotiana benthamiana interaction system to mimic the natural transmission and infection circuit of the HLB complex. We found that the SAMP from Ma Australian finger lime (MaSAMP) had the strongest effect on suppressing CLso disease and inhibiting bacterial growth in plants. To directly determine the bactericidal activity of MaSAMP on Liberbacter spp, we developed a viability/cytotoxicity assay of Lcr, a close culturable relative of the CLas and CLso (Fagen et al. 2014; Leonard et al. 2012; Merfa et al. 2019). Using this assay, we found that MaSAMP can rapidly kill the bacterial cells within five hours, which is more efficient than the bactericidal antibiotic, Streptomycin. While the heat sensitivity of antibiotics is a major drawback for controlling CLas in citrus fields, we found that SAMPs are surprisingly heat stable. A prolonged exposure to extreme temperatures of 60 degrees C for 20 hours had minimal effect on MaSAMP, which still retained most of its bactericidal activity, whereas Streptomycin lost its antibacterial activity following the same temperature incubation. Thus, SAMP is a heat-stable, plant-derived antimicrobial peptide that can directly kill Lcr and suppress CLso in plants.
SAMP suppresses CLas in HLB-positive citrus trees.
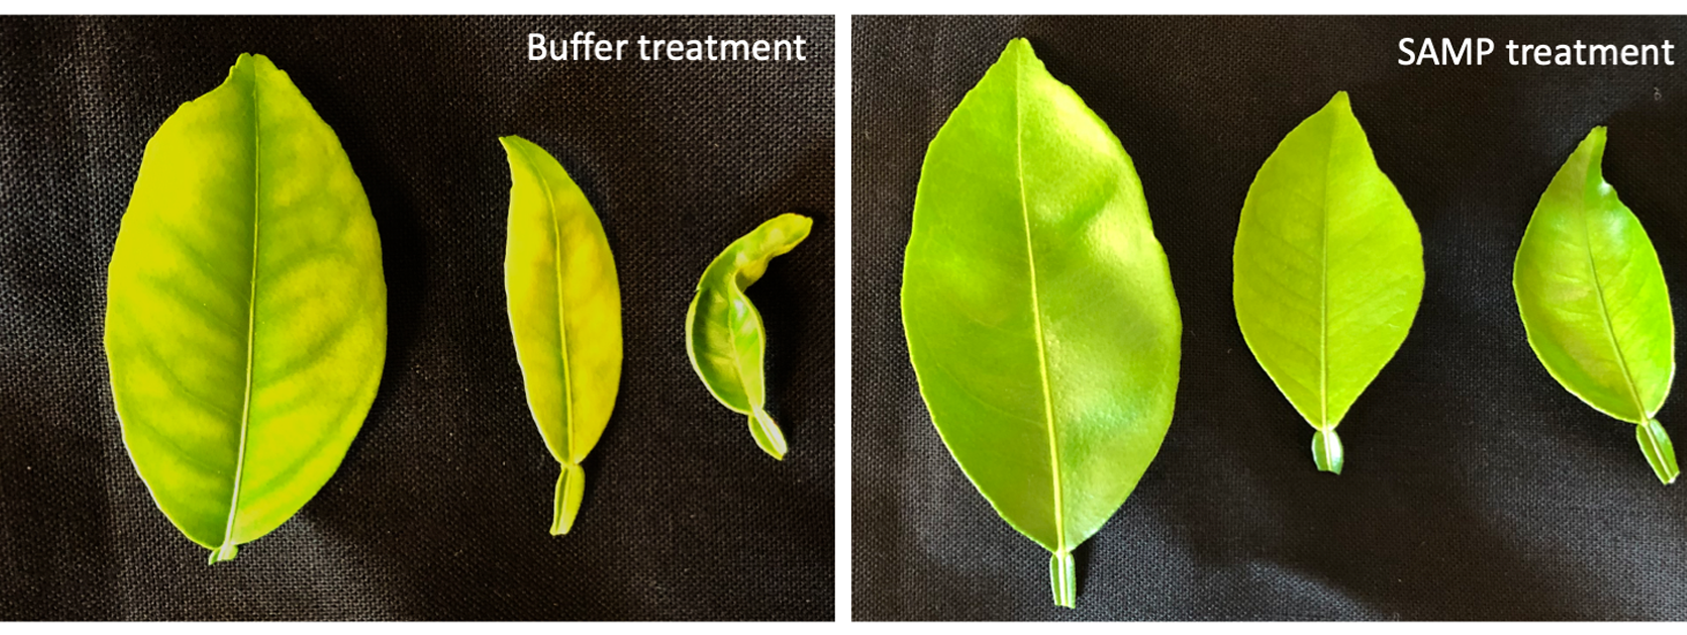
To determine whether MaSAMP can also suppress CLas in citrus trees, we used the pneumatic trunk injection method to deliver the MaSAMP solution into the HLB-positive trees. We first tested with eight CLas-positive Citrus macrophylla with similar bacterial titer and disease symptoms for the treatment. At eight weeks following two doses injected, separated by two months of MaSAMP injection, the disease symptoms and the bacterial titer in all six treated trees were drastically reduced compared to the mock-treated (buffer only) plants and one tree with no CLas detected. We further tested with HLB-positive ‘Madam Vinous’ sweet oranges and Lisbon Lemon trees; those appeared to have declining symptoms and similar CLas titer. After MaSAMP treatments, the trees had developed symptomless new flushes, while mock trees exhibited symptomatic flushes (Fig. 1). The CLas titer was reduced in MaSAMP-treated trees, while it increased in the mock-treated trees. Taken together, these results demonstrate across three trials that SAMP injection can suppress CLas titer in three different HLB-susceptible citrus varieties and can cause trees in declining health to recover.
Figure 1: New growth leaves form buffer- (set as mock, left) or SAMP-treated (right) HLB-positive ‘Madam Vinous’ sweet oranges trees.
SAMP treatment safeguards healthy citrus trees from CLas infection.
Protecting healthy trees from CLas infection is critical for managing HLB. The establishment of defense priming in plants can promote faster and/or stronger host immune responses upon pathogen challenges (Brigitte et al. 2017; Zheng Qing and Xinnian 2013). To determine whether MaSAMP has priming activity, we applied it by foliar spray to citrus plants. We found that MaSAMP applications triggered prolonged induction of defense response genes. Thus, SAMP can potentially “vaccinate” uninfected citrus trees and induce defense responses to combat against HLB. To test the protection ability of SAMP on citrus trees, we applied the MaSAMP solution or buffer as mock treatment by foliar spray onto young, healthy ‘Madam Vinous’ sweet orange trees. Five days after treatment, the trees were exposed to ACP carrying CLas under the “no choice feeding” condition for 21 days. We treated trees with MaSAMP solution by foliar spray every two months subsequently. The result indicates that MaSAMP-treated trees have a lower infection rate.
SAMP disrupts the outer membrane and causes cell lysis of the bacterial cell.
To understand the mechanism of MaSAMP bactericidal activity, morphological changes of Lcr post-MaSAMP treatment were observed using transmission electron microscopy. Application of 10 μM MaSAMP to Lcr caused cytosol leakage and the release of small extracellular vesicles after 30 minutes of incubation. The Lcr cells were lysed within two hours of incubation. We isolated the membrane fraction from the MaSAMP treated Lcr and detected the enrichment of MaSAMP in the outer membrane fraction compared with the inner membrane fraction. Thus, MaSAMP likely disrupts mainly the outer membrane of Lcr and breaks the bacterial cells, which leads to cell lysis.
SAMP has Low toxicity.
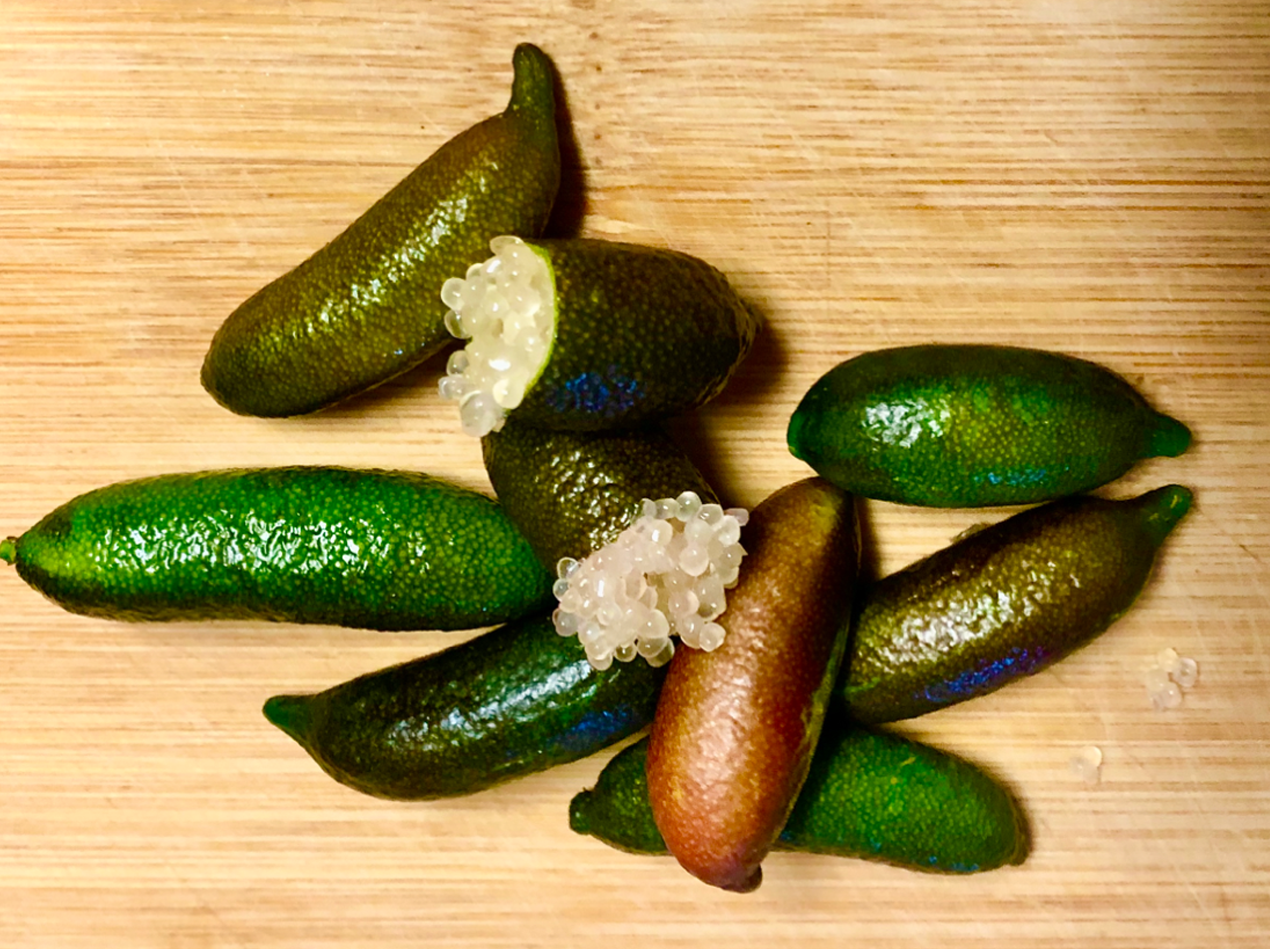
Because SAMP is internalized by citrus, it is important to test its phytotoxicity. We injected different concentrations of MaSAMP solution directly into citrus leaves and found that MaSAMP has little phytotoxicity. Furthermore, we found that MaSAMP can be detected in fruit tissue of both Australian finger lime and trifoliate orange by Western blot analysis and is very sensitive to human endopeptidase Pepsin, a major gastric enzyme produced by stomach chief cells. Thus, MaSAMP in Australian finger lime has already been consumed by humans for hundreds of years and can be easily digested (Figure 2). These results suggest a low possibility of toxicity of SAMP on citrus and humans, although additional safety assessment tests are necessary for regulatory approval.
Figure 2: Fruits of Australian finger lime contain MaSAMP, which has already been consumed by humans for hundreds of years and is easily digested.
Conclusion
Current methods for HLB management include insecticidal control of the vector (Stansly et al. 2014), antibacterial treatments (Blaustein et al. 2018; Gottwald 2010; Hu et al. 2018; Zhang et al. 2014) and nutrient supplements (Rouse 2013; Zhao et al. 2013a). The overuse of insecticides and antibiotics is known to pose threats to human and animal health and select for resistance in the target insect population (Tiwari et al. 2011). Further, current bactericidal or bacteriostatic treatments mostly involve sprays of antibiotics, such as streptomycin and oxytetracycline, which are likely to select for antibiotic-resistant bacteria strains and disrupt the citrus microbiome and ecosystem and may further affect the effectiveness of these antibiotics for medical antibacterial treatment in humans and animals.
On the contrary, SAMPs have a distinct mode of action and tend to interact with the bacterial cell membrane through nonspecific mechanisms, making the emergence of resistant bacteria less likely (Jochumsen et al. 2016; Rodriguez-Rojas et al. 2014). Moreover, SAMP kills bacteria faster than antibiotics, reducing bacterial generations and further lowering the possibility of evolved resistance (Fantner et al. 2010). Most importantly, the heat stability of SAMP can provide a prolonged and durable effect in the field compared to heat-sensitive antibiotics. SAMP not only kills bacteria cells but can also prime plant immune responses to prevent/reduce infection. In our greenhouse trials, SAMP has been shown to treat HLB-positive trees and inhibit the emergence of new HLB-infection in healthy trees. Field trials, which can take several years, are currently being initiated in Florida to confirm the efficacy of SAMP in controlling HLB. Field trials also include testing multiple peptide application methods for citrus growers to prevent and treat HLB.
Contact Hailing Jin at hailingj@ucr.edu for more information.
References:
Albrecht, U., and Bowman, K.D. (2011). Tolerance of the trifoliate citrus hybrid US-897 (Citrus reticulata x Poncirus trifoliata) to huanglongbing. HortScience 46, 16-22.
Albrecht, U., and Bowman, K.D. (2012a). Tolerance of trifoliate citrus hybrids to Candidatus liberibacter asiaticus. . Sc Horticulturae 147, 71-80.
Barnett, M.J., Solow-Cordero, D.E., and Long, S.R. (2019). A high-throughput system to identify inhibitors of Candidatus Liberibacter asiaticus transcription regulators. Proceedings of the National Academy of Sciences of the United States of America 116, 18009-18014.
Blaustein, R.A., Lorca, G.L., and Teplitski, M. (2018). Challenges for Managing Candidatus Liberibacter spp. (Huanglongbing Disease Pathogen): Current Control Measures and Future Directions. Phytopathology 108, 424-435.
Bove, J.M. (2006). Huanglongbing: a destructive, newly-emerging, century-old disease of citrus. . J Plant Pathol 88, 7-37.
Brigitte, M.-M., Ivan, B., Estrella, L., and Victor, F. (2017). Defense Priming: An Adaptive Part of Induced Resistance. Annual review of plant biology 68, 485-512.
Fagen, J.R., Leonard, M.T., Coyle, J.F., McCullough, C.M., Davis-Richardson, A.G., Davis, M.J., and Triplett, E.W. (2014). Liberibacter crescens gen. nov., sp. nov., the first cultured member of the genus Liberibacter. International journal of systematic and evolutionary microbiology 64, 2461-2466.
Fantner, G.E., Barbero, R.J., Gray, D.S., and Belcher, A.M. (2010). Kinetics of antimicrobial peptide activity measured on individual bacterial cells using high-speed atomic force microscopy. Nature nanotechnology 5, 280-285.
Gottwald, T.R. (2010). Current epidemiological understanding of citrus Huanglongbing. Annu Rev Phytopathol 48, 119-139.
Graham, J., Gottwald, T., and Setamou, M. (2020). Status of Huanglongbing (HLB) outbreaks in Florida, California and Texas. Trop Plant Pathol.
Hu, J., Jiang, J., and Wang, N. (2018). Control of Citrus Huanglongbing via Trunk Injection of Plant Defense Activators and Antibiotics. Phytopathology 108, 186-195.
Huang, C., Niu, D., Kund, G., Jones, M., Albrecht, U., Nguyen, L., Bui, C., Ramadugu, C., Bowman, K., Trumble, J., et al. (2020). Identification of citrus defense regulators against citrus Huanglongbing disease and establishment of an innovative rapid functional screening system. Plant Biotechnology Journal.
Huang, C.Y., Wang, H., Hu, P., Hamby, R., and Jin, H. (2019). Small RNAs – Big Players in Plant-Microbe Interactions. Cell host & microbe 26, 173-182.
Jochumsen, N., Marvig, R.L., Damkiaer, S., Jensen, R.L., Paulander, W., Molin, S., Jelsbak, L., and Folkesson, A. (2016). The evolution of antimicrobial peptide resistance in Pseudomonas aeruginosa is shaped by strong epistatic interactions. Nature communications 7, 13002.
Leonard, M.T., Fagen, J.R., Davis-Richardson, A.G., Davis, M.J., and Triplett, E.W. (2012). Complete genome sequence of Liberibacter crescens BT-1. Standards in genomic sciences 7, 271-283.
Merfa, M.V., Perez-Lopez, E., Naranjo, E., Jain, M., Gabriel, D.W., and De La Fuente, L. (2019). Progress and Obstacles in Culturing ‘Candidatus Liberibacter asiaticus’, the Bacterium Associated with Huanglongbing. Phytopathology 109, 1092-1101.
Park, S.C., Lee, J.R., Shin, S.O., Park, Y., Lee, S.Y., and Hahm, K.S. (2007). Characterization of a heat-stable protein with antimicrobial activity from Arabidopsis thaliana. Biochemical and biophysical research communications 362, 562-567.
Ramadugu, C., Keremane, M.L., Halbert, S.E., Duan, Y.P., Roose, M.L., Stover, E., and Lee, R.F. (2016). Long-Term Field Evaluation Reveals Huanglongbing Resistance in Citrus Relatives. Plant Dis 100, 1858-1869.
Rodriguez-Rojas, A., Makarova, O., and Rolff, J. (2014). Antimicrobials, stress and mutagenesis. PLoS pathogens 10, e1004445.
Rouse, B.B. (2013). Rehabilitation of HLB Infected Citrus Trees using Severe Pruning and Nutritional Sprays. Proc Fla State Hort Soc 126, 51-54.
Stansly, P.A., Arevalo, H.A., Qureshi, J.A., Jones, M.M., Hendricks, K., Roberts, P.D., and Roka, F.M. (2014). Vector control and foliar nutrition to maintain economic sustainability of bearing citrus in Florida groves affected by huanglongbing. Pest Manag Sci 70, 415-426.
Stokstad, E. (2012). Agriculture. Dread citrus disease turns up in California, Texas. Science 336, 283-284. Tiwari, S., Mann, R.S., Rogers, M.E., and Stelinski, L.L. (2011). Insecticide resistance in field populations of Asian citrus psyllid in Florida. Pest management science 67, 1258-1268.
Zhang, M., Guo, Y., Powell, C.A., Doud, M.S., Yang, C., and Duan, Y. (2014). Effective antibiotics against ‘Candidatus Liberibacter asiaticus’ in HLB-affected citrus plants identified via the graft-based evaluation. PloS one 9, e111032.
Zhao, H., Sun, R., Albrecht, U., Padmanabhan, C., Wang, A., Coffey, M.D., Girke, T., Wang, Z., Close, T.J., Roose, M., et al. (2013a). Small RNA profiling reveals phosphorus deficiency as a contributing factor in symptom expression for citrus huanglongbing disease. Mol Plant 6, 301-310.
Zhao, H., Sun, R., Albrecht, U., Padmanabhan, C., Wang, A., Coffey, M.D., Girke, T., Wang, Z., Close, T.J., Roose, M., et al. (2013b). Small RNA Profiling Reveals Phosphorus Deficiency as a Contributing Factor in Symptom Expression for Citrus Huanglongbing Disease. Molecular Plant 6, 301-310.
Zheng Qing, F., and Xinnian, D. (2013). Systemic Acquired Resistance: Turning Local Infection into Global Defense. Annual review of plant biology 64, 839-863.
From top left to top right: poor and uneven budbreak; stunted shoot growth (Front: Petite Verdot on 5BB rootstock; Back: Cabernet Sauvignon on 1103P rootstock). From bottom left to bottom right: stunted canopy growth on Pinot Gris on Freedom rootstock with suckers pushing vigorously at the base; poor fruit set with excessive berry abscission (all photos courtesy G. Zhuang.)
This past winter was a dry year with a total of <8.5 inches of precipitation (November 2020 to March 2021) and that was significantly lower than the historical average of 11 inches for the San Joaquin Valley (SJV). Winter drought and freeze temperatures last November and December (minimal temperature was as low as 20 degrees F) caused some severe damages on grapevines, and the delayed spring growth (DSG) was mostly reported by growers. DSG includes erratic bud break, stunted shoot development, dead shoot tips and excessive berry abscission with suckers pushing vigorously at the base of the vine. Some DSG symptoms were very similar to the symptoms of drought or grapevine water stress. Generally, most DSG vines recover after an irrigation event starts; however, the impact of DSG on yield might persist (poor fruit set and small bunch size), and growers likely suffer from the economic loss.
In the face of upcoming drought challenges, growers need to focus on three main areas to improve irrigation efficiency and maximize yield and quality: soil, grapevine canopy and weather condition.
Soil
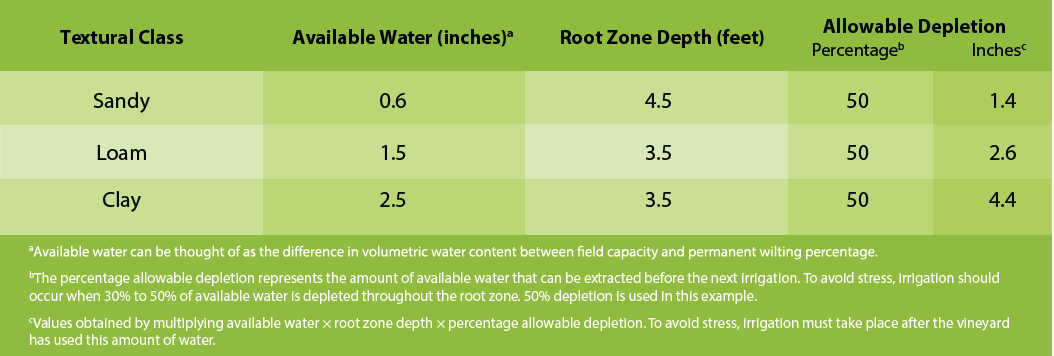
Most grape roots are in the top three feet of soil, and this is the main area where our irrigation works. Due to the lack of winter precipitation, dormant or early season irrigation is necessary to restore the soil moisture, which supports grapevine budbreak as well as early season shoot elongation. Given that the severe drought condition persists in most of SJV, growers need to assess the soil dryness and moisture content at individual sites, since different soil types can hold moisture quite differently (Table 1). Sandier soil holds water poorly in comparison to clay soil. Conversely, water percolates more rapidly in sandy soil than clay soil. Therefore, with the same amount of precipitation or irrigation, clay soil can hold more than sandy soil and grapevine/cover crop can deplete the soil moisture much faster at sandier sites. Soil type can be accessed through UC Davis SoilWeb (casoilresource.lawr.ucdavis.edu/gmap/), or can be analyzed through commercial laboratories by collecting representative soil samples at a site. Cover crop and middle row vegetation should be mowed earlier under drought conditions to preserve soil moisture.
Table 1: Representative values for available water content, rooting depth and allowable depletions for different soil types. Table is elaborated in Raisin Production Manual (L.P. Christensen 2000).
After understanding the different soil types and their water-holding characteristics, growers need to make the decision for first irrigation based on the soil moisture content, and that can be quite important during the current drought condition. Numerous tools are available for growers to use to measure soil moisture content, the most commonly used method being ‘feel and appearance’, where growers use a shovel or auger to dig out soil samples at different depths and feel the moisture by squeezing the soil in their hand.
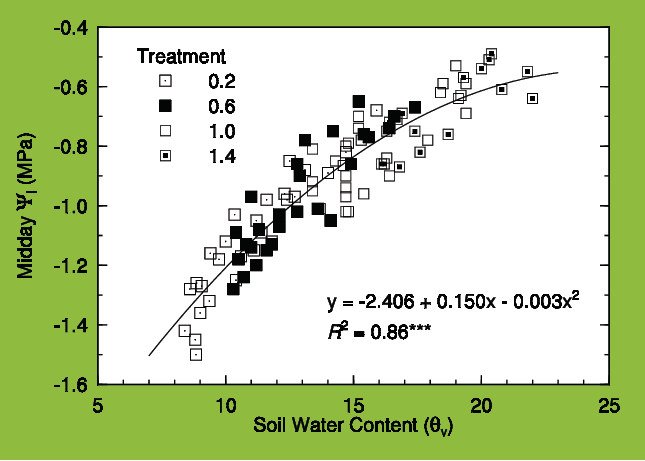
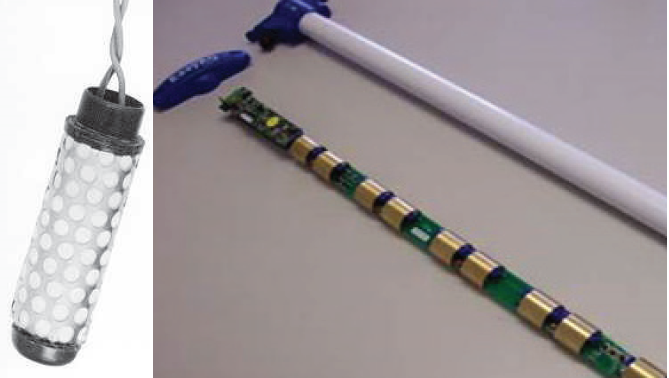
Currently, growers have access to many inexpensive soil moisture sensors which can help to measure soil moisture in real time. There are mainly two types of soil moisture sensors: one measures soil water tension (e.g., tensiometer or WaterMark™) and the other measures soil volumetric water content (e.g., Neutron probe and capacitance sensor). Soil-water tension tells you how hard it is for the grapevine roots to pull water from the soil particles, and the reading is typically negative with units of centibar. The more negative the reading, the harder it is for the grapevine roots to absorb water. Growers can set up the pre-determined value of soil-water tension (e.g., -30 centibar) at a certain soil depth {e.g., two feet). Once the soil-water tension reaches the value, the irrigation should start. The pre-determined soil-water tension is usually between -30 and -40 centibar in SJV, varying across different soil types. However, soil-water tension does not tell you how much water has been depleted or the available water content. Soil volumetric water content, on the other hand, offers the percentage of water volume versus the total soil volume and tells you the amount of water stored in the soil and how much you need to irrigate to maintain the desired water content. Growers should irrigate the vineyard when 30% to 50% of allowable water is depleted throughout the root zone (Table 1). The soil volumetric water content is also well correlated to plant water stress measured by midday leaf water potential, and growers can potentially use soil volumetric water content to assess grapevine water stress (Figure 1).
Overall, growers can use both soil-water tension and soil volumetric water content mentioned above to monitor the soil moisture either indirectly or directly and schedule irrigation.
Figure 1: Soil volumetric water content is correlated with midday leaf water potential. Data were collected from various irrigation treatments: 0.2 ETc, 0.6 ETc, 1.0 ETc and 1.4 ETc. Figure is elaborated in Williams and Trout 2005.
Grapevine Canopy
Grapevine canopy growth (e.g., budbreak and shoot elongation) depends on the availability of water and nutrients in the soil. Lack of soil moisture during the dormant season increases the risk of freeze damage and hinders the start of budbreak and early season shoot elongation, causing DSG. DSG usually occurs when the grapevine suffers water stress at the beginning of the growing season. If the drought condition persists, shoot elongation might be hampered, and the shoot tip might die off due to lack of water. Under severe drought stress, inflorescences will die off and cause significant yield loss.
To prevent early season vine water stress, soil moisture is the key measurement to decide when to irrigate as was previously mentioned. However, canopy appearance and visual assessment can help to confirm the success of an irrigation program. First, upward-growing shoot tips and tendrils are the most obvious signs of a healthy canopy. Second, a pressure chamber to measure midday leaf water potential might offer a powerful tool to validate the irrigation program (Table 2).
Table 2: Midday leaf water potential readings and related grapevine water stress.
Grapevine water demand is directly related to the amount of sunlight captured by the canopy, and a larger canopy needs more water than a smaller canopy due to receiving more light. Therefore, as the shoot grows and the canopy expands, grapevines generally use more water. Most grapevine irrigation recommendations are based on the canopy size and climatic condition. Canopy management (e.g., leafing, shoot tucking/thinning and hedging) has the potential to influence the canopy size and amount of light received, and ultimately water use.
Soil water tension sensor (left) and soil volumetric water content sensor (right)
Grapevines at different growth stages have different sensitivity and tolerance to water stress. From budbreak to bloom, the grapevine is very sensitive to water stress, and even a mild stress will hinder growth and cause irreversible yield loss. Generally, water stored in the soil profile after winter precipitation is enough to support vine growth. However, in years of drought such as this year, soil moisture may be inadequate to support growth, and irrigation is needed to replenish soil moisture. From bloom to fruit set, the grapevine is also sensitive to water stress, and severe stress causes poor set and yield loss. Fruit set to veraison is a good time to apply some stress if growers are looking to reduce berry size (e.g., smaller berry) and improve berry quality (e.g., color). However, the benefit of improved berry quality might come with the sacrifice of yield. Typically, in SJV, mild stress is recommended at this period to balance quality and yield. From veraison to harvest may be the best time to apply some stress to advance berry ripening and reduce disease pressure (e.g., bunch rot). However, growers need to avoid severe stress which results in excessive defoliation, since a healthy canopy is required for photosynthesis. Postharvest, it is generally recommended to replenish the soil profile, since the photosynthetic active canopy still produces the carbon to refill the reserve of trunk and roots, and the reserve will be used to support the vine growth of the following season. Postharvest irrigation in abundant quantities can also help to leach the salts and alleviate the concern of salinity.
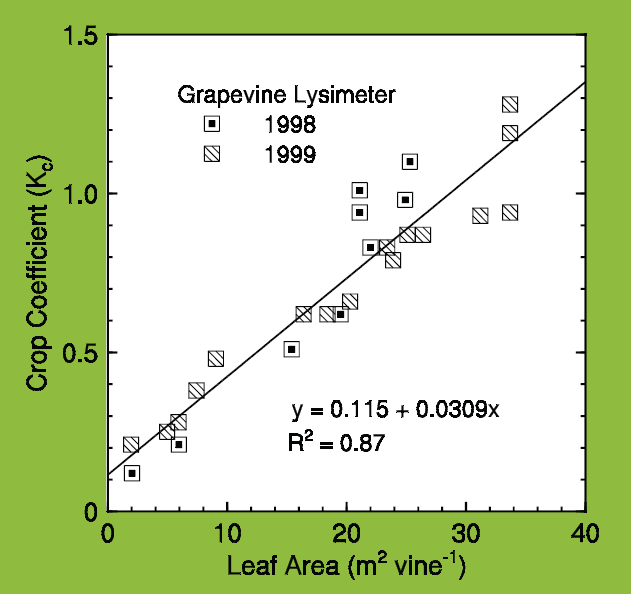
Figure 2: Crop coefficient (Kc) is correlated with canopy size measured by leaf area. Figure is elaborated in Williams and Trout 2005.
Weather Conditions
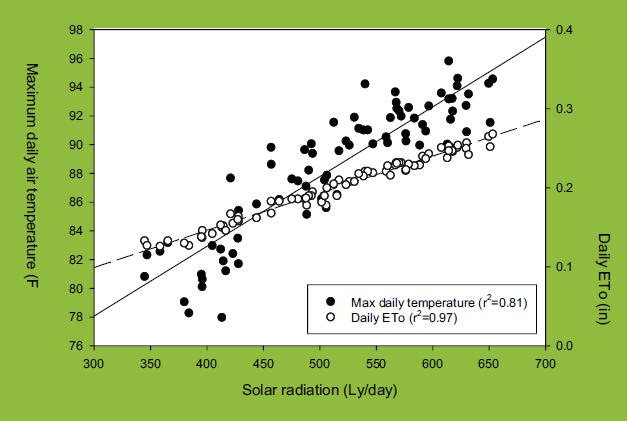
As was previously mentioned, grapevine water use depends on two main factors: canopy size and weather. Most growers know crop evapotranspiration (ET) and can calculate grapevine water demand over a given period through the calculation: grapevine evapotranspiration (ETc) = reference evapotranspiration (ETo) × crop coefficient (Kc). Growers can simply use ETc to irrigate the grapevines weekly by using gallons/vine/week or hours/vine/week after factoring in the application rate. Kc is related to canopy size (Figure 2, see page 38) and ETo is related to weather condition (Figure 3). ETo is strongly correlated with sunlight and the ambient temperature. A sunny and cloudless day will drive more grapevine water use than a cloudy and foggy day or a smokey day as occurred last year due to the wildfires. Similarly, a forecasted heat wave will cause severe water stress if there is lack of irrigation. Water stress coupled with temperatures >100 degrees F disrupts berry growth and sugar accumulation and causes yield loss and maturation delay.
Figure 3: Sunlight is strongly correlated with ETo and ambient temperature. Data points are extracted from last 10 years’ average during months of August, September and October at CIMIS station #56 in Los Banos.
Currently, there are different ways growers can adjust irrigation based on weather condition: 1) National Weather Service (digital.weather.gov/) provides the weather forecast as well as forecasted ETo. Growers can adjust the irrigation amount based on forecasted weather and ET. 2) UCCE is launching weekly crop ET reports (ucanr.edu/sites/viticulture-fresno/Irrigation_Scheduling/), so growers do not need to calculate weekly grapevine ET or gallons/vine/week themselves. Irrigation can be simply followed on the ET reports.
Finally, growers need to put economic consideration into water management. Water might be better used for younger blocks than a vineyard which is near the end of its lifespan, and it also makes more economic sense to use water for the cultivar which has a better price when the water is scarce. The take-home message on vineyard water management is:
Check soil moisture at all levels.
Assess canopy, vine water status and weather condition.
Spend water when it is needed the most.
Salinity becomes an important factor in determining water management.
Mow cover crop or middle row vegetation early to preserve soil moisture.
Upward growing shoot tip and tendril (left), before pressure bomb, bagging leaf before cutting the petiole (top right), during pressure bomb, using magnified glass to observe popping water from the petiole (bottom right).
References
Williams, L. and Trout, T. 2005. Relationships among Vine- and Soil-Based Measures of Water Status in a Thompson Seedless Vineyard in Response to High-Frequency Drip Irrigation. Am J Enol Vitic. 56: 357-366. L. P. Christensen. 2000. Raisin Production Manual. University of California Agriculture and Natural Resources Publication 3393.


 Invading California")

