Multiple control options for western flower thrips are important to prevent development of pesticide resistance. Rotating among pesticides with different modes of action as well as cultural and biological controls are advised (photos by Jack Kelly Clark, UC IPM.)
An integrated approach is essential for successful management of western flower thrips (WFT), a serious insect pest in California lettuce.
Surendra Dara, UCCE entomology and biologicals advisor in San Luis Obispo County, said regular monitoring and use of multiple control options, including cultural and biological solutions, are involved in this process.
Multiple options are important, Dara said, because pesticide resistance can easily develop in WFT populations. Keeping WFT populations in the field under control while maintaining efficacy of existing pesticides requires understanding of WFT biology and feeding.
Adult female WFT insert their eggs into plant tissue. The first two instar stages feed on plant tissue and the second stages are non-feeding and reside in soil and emerge as adults.
WFT prefers to feed on flowers, but will also feed on developing buds, fruit and foliage.
While feeding on plant juices, WFT can also transmit Tomato spotted wilt virus. This pest is also the sole vector of Impatiens necrotic spot virus in lettuce.
Only the larval stages of WFT acquire these tospoviruses, and the adults transmit the viruses to other plants as they spread in the field.
Cultural control involves removal of weeds and host plants for WFT or viruses. Destroying previous lettuce crop residues will destroy surviving stages of WFT. Optimum plant nutrition can help lettuce withstand pest damage.
Dara said there are biostimulants or biological soil amendments for lettuce that help activate the plant’s natural defenses.
Biological control involves nurturing populations of predators, including lacewings, minute pirate bugs and predatory mites in the field.
Dara said that the insecticide and anti-feedant Azadirachtin alone or in combination with entomopathogenic fungi or insecticides could be used against multiple life stages of WFT for control. Pyrethrins can also be used alone or with other biological or synthetic insecticides. Botanical insecticides that contain soybean oil, rosemary oil, thymol and neem oil also provide control against WFT.
Insecticidal soaps or mineral oils can be used against different life stages of thrips. Dara said that Spinosad, and a mixture of spinosyn A and spinosyn D, is very effective for control. He noted that overuse of Spinosad could lead to resistance in thrips and other pest insects.
Dara lists several synthetic insecticides that are effective against thrips, noting it is important to rotate chemicals among different mode of action groups to reduce the risk of insecticide resistance. The active ingredients and modes of actions for thrips control are methomyl (1A), bifenthrin (3A), lambda-cyhalothrin (3A), zeta-cypermethrin (3A), clothianidin (4A), spinetoram (5) and cyantraniliprole (28).
Sunburn on avocadoes leaves the fruit open to infection by a Botryosphaeria fungi, Dothiorello, or fruit rot. Sunburn is one of the conditions linked to poor irrigation management (photo courtesy UC Statewide IPM Program.)
Orchard irrigation management on the Central Coast of California can be challenging when fog and cool night and morning temperatures alternate with warm and dry days. Irrigation rates that exceed tree need or fail to meet it not only lead to production losses, but diseased trees.
In a UC Ag Experts webinar, Ben Faber, UCCE soils/water/subtropical crops advisor for Ventura and Santa Barbara counties, explained how to identify water stress-related symptoms and modify orchard management.
Avocado trees are sensitive to under- or over-irrigation, Faber said. Wilted leaves on a tree can be a sign of water stress, and also a signal that roots are suffering from lack of oxygen due to excess water. Avocado root rot, a serious disease, caused by the pathogen Phytopthora cinnamomi, thrives in excess soil moisture and poorly drained soils. Symptoms of this disease are small, pale leaves and a thinning tree canopy.
Irrigation management, gypsum, mounding, phosphonates and mulching can improve tree health, Faber said.
Phosphorous acid is registered as a fertilizer in California, Faber explained, but applications can act to rejuvenate root systems affected by root rot. The phos products are only effective on Phytopthora and pithium fungi.
Mulching is also an effective practice in an orchard. As it decomposes, it creates an environment that is hostile to Phytopthora. Botryosphaeria fungi are a common decomposer that, when feeding on dead root tissue, create enzymes that break down Phytopthora.
Another Phytopthora pathogen that affects citrus and avocado causes trunk cankers. Water hitting the tree trunks spreads the pathogen. This condition is treatable with phosphonate products as well, Faber said.
Drought and high salt levels can also be the cause of disease, poor tree growth and high insect pest levels. Most of these conditions are linked to poor irrigation management. Leaf loss, tip burn and sunburn on fruit are obvious symptoms in avocados. With citrus, the fruit is affected more than the tree. Dead tissue on leaves and fruit, Faber warned, will open the door to infection caused by one of the Botryosphaeria fungi, Dothiorello, or fruit rot. Phosphonate products will not help with those infections.
Salts can become more concentrated in orchards with poor irrigation management. While avocados are tolerant to boron, boron or chloride toxicity affects citrus. Avocados are more sensitive to sodium.
Lack of water also contributes to nutrient deficiencies as water is needed to move nutrients into the plants.
Water-stressed trees are also more prone to insect pests, including citrus red mite and Persia mite. Water-stressed trees have the opposite effect on Asian citrus psyllid, Faber said. Less new flush is found on water-stressed trees, drawing less ACP activity.
THE BEE CORP PARTNERS WITH SYNGENTA SEEDS AND NATIONAL SCIENCE FOUNDATION FOR PILOT STUDY ON INNOVATIVE HIVE GRADING TECHNOLOGY
HIVE GRADING TECHNOLOGY TESTED IN SUNFLOWER FIELDS
INDIANAPOLIS, IND. | APRIL 20, 2021 — The Bee Corp and Syngenta Seeds recently announced a partnership to trial Verifli hive grading technology on a pilot sunflower plot. Verifli is a technology that uses infrared imagery and data analytics to predict the size of the colony inside the hive without disturbing hives for manual inspection. This is the first time hive grading technology has been introduced in sunflower pollination. Planned to commence in June 2021, this trial will take place on seed production fields located in the Sacramento Valley area in California.
“We are continually leveraging digital technologies to enable data-driven decisions,” said Itacir Feldhaus, North America Seeds Production Research Leader at Syngenta. “This partnership with The Bee Corp will allow us to test and prove Verifli has the potential to help Syngenta Seeds, growers and beekeepers to improve beehive management and pollination in seed production. If proven, Verifli will help make seed production more efficient and environmentally sustainable.”
Funding for this pilot study will come in part from the National Science Foundation (NSF) through The Bee Corp’s Phase II Small Business Innovation Research grant.
Hive grading, though vital to pollination success, is still often a heavily manual process. Verifli is stepping in to provide a solution that delivers consistent, accurate and objective data to ensure optimal pollination for successful seed production. With pollination being critical for seed production worldwide, this could open up Verifli to a $70 billion global market. The Bee Corp has built a strong foundation in successful almond pollination, and they are confident in Verifli positively impacting additional crop industries.
“We’re grateful to Syngenta Seeds and NSF for supporting our effort to introduce Verifli to more areas of agriculture production dependent on pollination,” said Ellie Symes, The Bee Corp Co-founder. “Standardizing how bee colonies are measured is a pressing need for growers of a wide-variety of crops who lack information on pollination effectiveness.”
Verifli is a digital hive grading service powered by infrared (IR) image analysis. The Bee Corp team uses Verifli to grade hives overnight when IR is most accurate. Growers wake up to results on Verifli’s hive strength dashboard, where they can assess pollination potential across different sites, compare beekeeper performance and pinpoint the location of weak bees. Verifli’s non-invasive technology allows early recognition of issues before they have detrimental impacts on crop yields.
“Though initially built for almond growers, we designed the Verifli platform to deliver objective hive strength data for all crops that rely on honey bee pollination,” said Wyatt Wells, The Bee Corp Co-founder. “Verifli offers a fast and reliable way for growers to evaluate pollination and for beekeepers prove the value they provide.”
###
Drive decisions from the palm of your hand with non-invasive, unbiased hive grading. Snap. Grade. Go about your day — with Verifli. For more information about The Bee Corp and Verifli’s new hive-grading technology, visit www.thebeecorp.com or contact info@thebeecorp.com.
Damaged citrus leaves due to Asian Citrus Psyllid feeding. Research is underway at USDA-ARS to understand how insects transmit plant pathogens and how pathogens manipulate host plants to ensure replication and transmission (photo courtesy USDA-ARS.)
Two emerging technologies aim to protect citrus production on a global level by altering the invasive Asian Citrus Psyllid’s (ACP) ability to feed and targeting ACP populations that are less adept at transmitting the bacterium that causes citrus greening.
Dr. Michelle Heck, a USDA-ARS molecular scientist, outlined the ongoing research in a Science for Citrus Health webinar hosted by UC ANR.
Heck is a member of the research team on a USDA-NIPA funded project: Therapeutic Molecular Evaluation and Field Delivery Pipeline for Solutions to Citrus Greening.
Her research program uses a combination of molecular, genetic and proteomics approaches to understand how insects transmit plant pathogens and how pathogens manipulate host plants to ensure replication and transmission. A second area of research is the development of new pest management tools to enhance cultural control and to provide new management strategies for insect vector-borne diseases in plants.
Heck said scientists are looking for molecules to control huanglongbing (HLB) to develop solutions for this disease based on multiple control points. This strategy will deal with the potential for developing resistance to a single molecule or mode of action. New therapies include nanobodies, RNA aptamers and antimicrobial peptides.
An important part of the molecular strategy, Heck said, is to improve the economics of delivery. Molecules for use in these strategies are expensive, and scientists are working on tools to allow them to be economically viable solutions, she added.
The RNA aptamers being studied block feeding structures of ACP, binding and blocking their function. How to deliver the RNA aptamers to citrus trees is part of continuing research.
Plant-based antimicrobial peptides are another potential solution. The peptides suppress growth of the bacteria that causes citrus greening. Another strategy for controlling ACP is use of insect neuropeptides and peptide hormones to control HLB. The neuropeptides may act in several manners to control HLB, including blocking Clas transmission through psyllid feeding disruption or inducing insect mortality.
Methods to deliver the molecules to the citrus trees include greenhouse delivery as plants are being grown or direct plant infusion into vascular tissue where the pathogen that causes HLB resides.
A long-term solution involves transgenics, breeding a citrus tree that is resistant to HLB. This would also be the most cost-effective solution to HLB, Heck said.
Not all populations of HLB transmit the HLB bacteria equally, Heck said. ARS scientists are using genomics to identify the genes that transmit the bacteria.
Meanwhile, her research team will continue to develop and deliver therapeutic molecules with commercial potential.
Field studies in the Sacramento Valley compared the performance of a small six-rotor UAV drone sprayer versus a traditional manned airplane for applying insecticides for summer worm control in alfalfa hay fields, 2020 (photo by Ian Grettenberger, UC Davis.)
Drones are a viable option for aerial application of pesticides in alfalfa. UCCE Farm Advisor Rachel Long in Yolo County, along with Dr. Ken Giles, Dr. Xuan Li and Bill Reynolds from UC Davis, reported on field trials where drones were compared to fixed wing aircraft in pesticide applications for summer worm control in alfalfa.
The research team conducted two trials in Yolo County using the insecticide Prevathon. Fields were divided with one part sprayed by airplane and the other by a drone. Application rates were five gallons per acre for one field and ten gallons per acre for the second field.
Spray cards to assess coverage were set out in the alfalfa canopy prior to the pesticide application and plant samples were taken after the application to determine residue concentrations. Summer worm counts were also taken with a sweep net to compare efficacy of each spray application method.
In the UC ANR Alfalfa and Forage News, Long described the results of the trial. The spray cards showed that both the drone and airplane application had equivalent spray coverage. The drone application had more variability in deposition uniformity. This is due to refinement of airplane application technology over a 60-year period, Long noted, while drone applications need to be fine tuned for optimum pest control.
There were few differences in the residue concentrations of Prevathon between the airplane and drone for both spray rates.
Drones can be another tool for growers to use for aerial application of pesticides, Long wrote. California now has a specific UAV (unmanned) ag pilot license category where the pilot of the drone is not required to have a commercial pilot certificate, only the UAV certificate. Obtaining a California ag pilot unmanned license is now an established process.
Current limitation in the use of drones for aerial application on crops is a 55-pound weight limit on drone carrying capacity. Some drone companies have obtained certificates for handling more than 55 pounds in California, but Giles notes that only Yamaha has current certification for an over 55-pound spray application.
After three to four seasons of experience with the Yamaha carrying 220 pounds, Giles reports good deposition with insecticide in orchards for hull split sprays.
Drone technology is being used in China and other areas in Southeast Asia, but is not yet common in the US. Giles said use of UAV drones for pesticide applications is increasing.
Cal Poly, San Luis Obispo field experiments were carried out to determine if soil solarization can reduce weed and pathogen pressure and improve plant health and strawberry yields. Field trials also looked at the effect of sudangrass cover crops and if they enhanced effectiveness of soil solarization (photo courtesy Cal Poly, SLO.)
Solarization trials showed that 4 to 8 weeks of temperatures above 122 degrees F are necessary to kill the toughest weed seeds in soil.
Soil solarization uses clear, polyethelene material to cover irrigated ground and achieve high temperatures to kill soil pests including weed seeds. Research trials at the Cal Poly, San Luis Obispo organic farm were done to determine temperatures and time it took to kill weed seeds in the soil.
The field experiments were carried out to determine if soil solarization can reduce weed and pathogen pressure and improve plant health and strawberry yields in San Luis Obispo County. Field trial also looked at the effect of sudan grass cover crops and if they enhanced effectiveness of soil solarization.
Effectiveness of solarization is based on ambient soil and air temperatures and the intensity of solar radiation.
The time the tarp is left on the soil depends on the soil temperatures generated. In most cases, Cal Poly researchers report, solarization should raise the ambient soil temperatures between 10 and 20 degrees in the top six inches of the soil. Solarization is most effective when used during the summer months when solar radiation is high in sunny, warm climates.
Researchers also report that the best plastics to use are clear, one to three millimeters thick and UV-inhibited to prevent breakdown in sunlight. Cost for the material ranges from $150 to $300 per acre.
Summary of the solarization trial includes finding that solarization provided efffective weed control for three and a half months after tarp removal. Verticillium wilt populations were reduced 80.7% compared to non-solarized test plots. Solarized test plots experienced almost no disease pressure until late May when temperatures warmed. Solarized plants did experience disease pressure from charcoal rot, a warm season pathogen. Total plant mortality was higher in non-solarized plots with 35% compared to 16% in solarized plots. Solarized plots had higher strawberry yields.
Effectiveness of solarization depends not only on the temperatures achieved with tarping, but also on the weed seed and disease species present in the soil. In areas with cooler climates or frequent foggy or cloudy days during the summer, knowing temperature thresholds required to kill the pests in the field can be important in determining if solarization is a viable option.
Rusty red spores cover a Ganoderma conk on an almond tree trunk. Other signs on trees are white rot and mycelium at infection sites. The fungus causes heartwood and sapwood to decay, reducing structural stability (photo by Bob Johnson, UC Davis.)
UC plant pathologists are currently conducting spore surveys to assess the spread of Ganoderma root rot in Central Valley almond orchards.
This disease, Ganoderma adspersum, is much more prevalent in the southern Central Valley where it was likely first introduced, said Daisy Hernandez, a researcher in the UC Davis plant pathology department. The fungus has recently been found further north in the valley, a sign that it is spreading.
This wood-rotting and airborne fungi causes trees to rot from the inside out, leaving weakened trunks at the soil line and causing infected trees to fall. There is no known control once trees are infected. Fourth leaf trees can be infected. Average age of infected trees is 14.
Conks, the fungal fruiting bodies, grow at the soil line on exposed roots and are a sign of a Ganoderma infection. Live conks are a brilliant white color on the underside and release rust-colored spores which often accumulate on the upper surface of the conk making it appear red.
Other signs on trees are white rot and mycelium at infection sites. The fungus causes heartwood and sapwood to decay, reducing structural stability.
Trees with Ganoderma infections show signs of general decline. There may also be a flat strip on the tree trunk or clefting at the graft union. Many infected orchards are first-generation and have a high incidence of conks. These produce “astronomical” numbers of spores, 12 to 40 million a day.
Hernandez said spread of Ganoderma infections in orchards is attributed to airborne spores from mature conks. A common factor among infected almond orchards is the sandy loam soil that allows for proper drainage. Hernandez said it might be possible that this soil type contributes to the fungus’ ability to spread via spores that percolate up to 60 centimeters into the soil. When the trees are irrigated, the spores infect roots that have become damaged during shaking for harvest and sanitation. Sweeping also promotes spore dispersal throughout the orchard. There is no evidence the infection spreads from root to root. Each infection is spore-related.
Conks on trees may be removed and destroyed to delay infections, but care must be taken to not cause further spread of spores in the orchard. Delay is the keyword here, Hernandez noted, as conks can regrow at the same site in five to ten weeks.
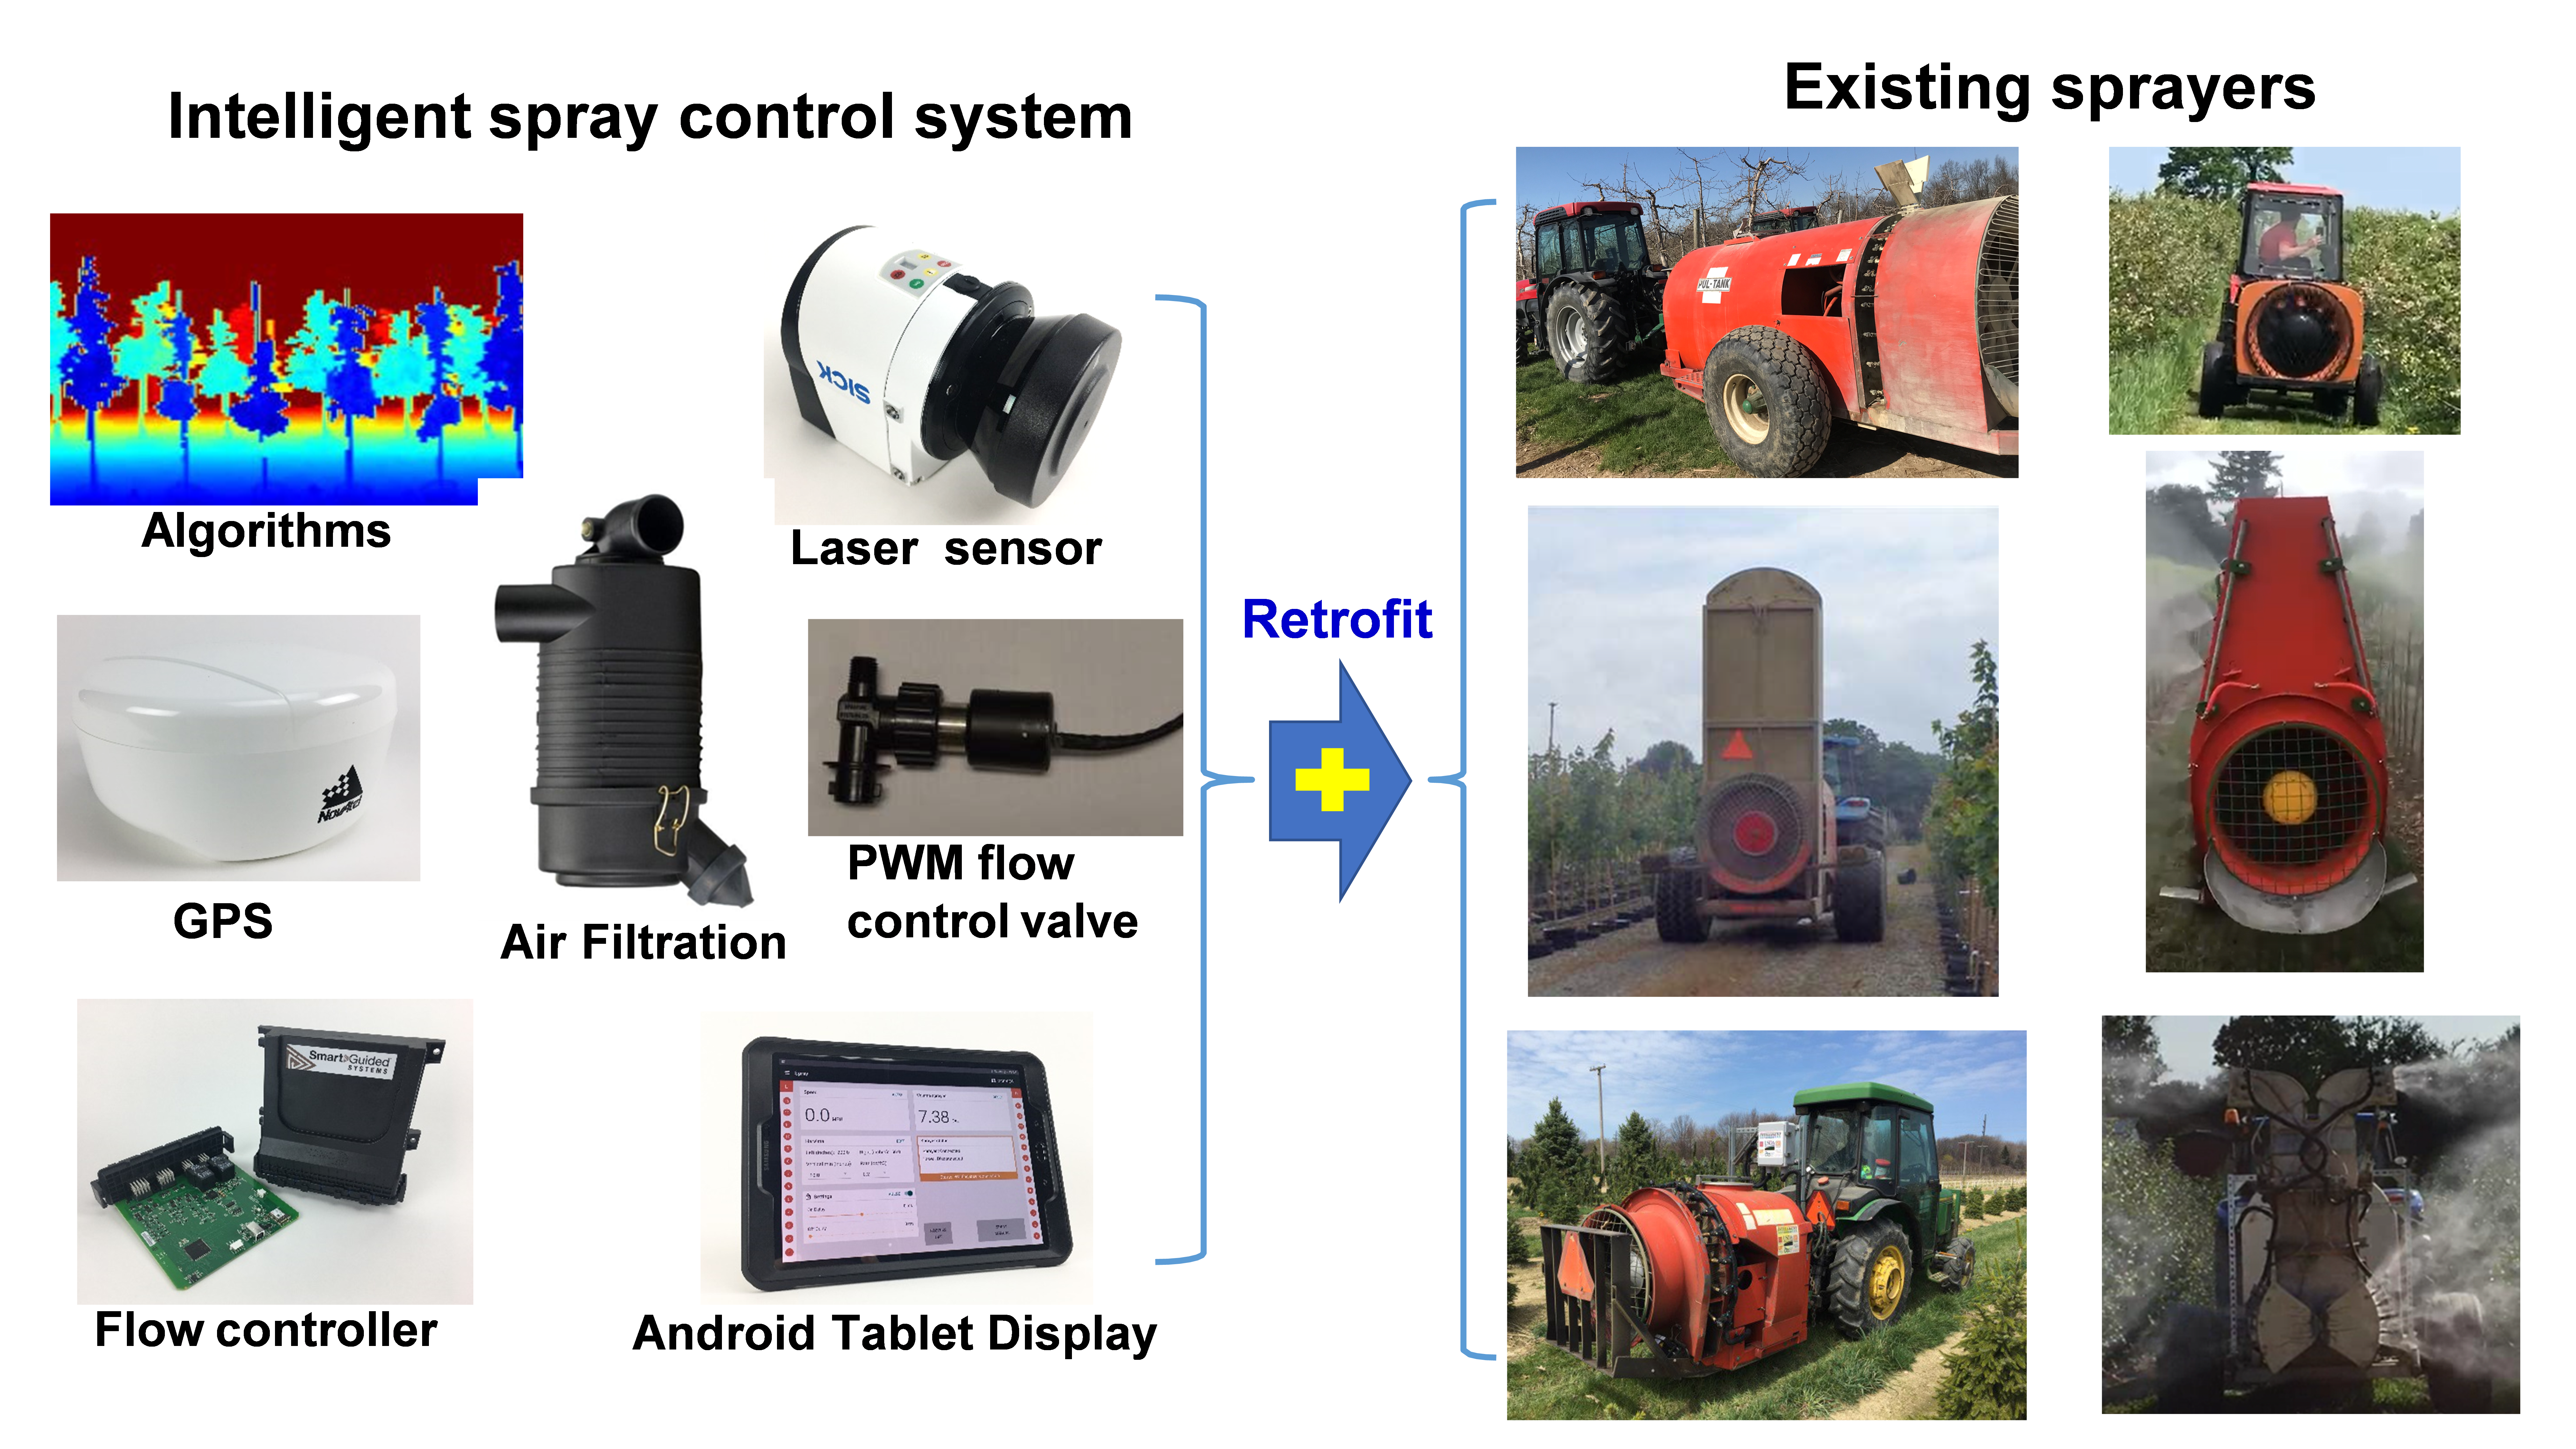
All components of the smart sprayer retrofit kit are attached to the sprayer body without changing the sprayer structure, with the exception of connecting a variable-flowrate solenoid valve to each nozzle.
Fruit, nut, ornamental nursery, horticultural and greenhouse industries are among the fastest-growing enterprises in US agriculture. Application of pesticides and other production strategies have ensured their high-quality products meet stringent market requirements. However, low-efficiency, decades-old spray technologies are commonly used to treat these specialty crops and have caused an enormous amount of pesticide waste, additional costs in crop production and concerns around worker safety. The pesticide waste has also caused environmental contamination and ecosystem damage because pesticide sprays indiscriminately kill both pests and beneficial insects. Spray drift and off-target loss will likely remain a major problem as long as pesticides are applied using indiscriminate spray equipment.
Need for Efficient Technologies
Pesticide application is the most complicated operation in crop production because there are many variables affecting spray strategies and practices. In many cases, when decisions must be made to apply chemicals within a very narrow time window in response to escalating pest pressure, a simple “best guess” practice is often under vague labeling of pesticide rates to control pests that may result in excessive application of pesticides.
Given constrained environments for specialty crop production, an ideal spray management program for pests and diseases should include improved delivery systems that are flexible for spraying the amount of chemicals to match tree structures instead of acreage base. Such spray application will also produce minimum spray drift and off-target loss of pesticide on the ground and in the air.
To achieve this goal, a new automated universal intelligent spray control system was developed as a retrofit kit to attach on existing sprayers. With the intelligent control system, the conventional spraying systems can determine the presence, size, shape, and foliage density of target plants such as trees and grape vines, and then automatically apply the amount of pesticides as needed according to plant architectures in real time. With the control system, growers themselves can upgrade their own sprayers to precision sprayers with intelligent functions rather than buying new sprayers, and sprayer manufacturers do not need to change their current sprayer designs. The primary requirement for the upgrade action is to connect a variable-flowrate solenoid valve to each nozzle, and all other components are attached to the sprayer body without changing the sprayer structure.
This new system is the product of a decade of research and development by engineers at USDA-ARS at Wooster, Ohio in collaboration with researchers at The Ohio State University, Oregon State University, University of Tennessee, Clemson University, Texas A&M University, Iowa State University, Washington State University, Penn State University, University of Queensland and USDA-ARS.
Since 2013, the system has been tested as a retrofit on different types of the air-blast sprayers for pest control effectiveness, reliability and repeatability on real farm fields. Comparative field biological tests were also conducted to evaluate insect and disease control for the sprayers with and without the intelligent-decision control capabilities in commercial nurseries, apple orchards, peach orchards, pecan orchards, vineyards and small fruit productions as well as university research farms in Ohio, Oregon, Tennessee, South Carolina, Texas, California and Washington.
These activities were voluntarily held by UCCE in Napa County and University of Queensland in Australia.
Figure 1. Integration of universal intelligent spray control system as a retrofit kit into existing sprayers (photo courtesy S. Booher.)
System Features
Spray deposition uniformity insidecanopies, chemical usage and off-target losses were investigated for the plants at different growth stages in ornamental nurseries, apple orchards, peach orchards and vineyards. Multi-year field tests have demonstrated the intelligent spray system is reliable and can reduce pesticide use in a range between 30% and 90%, reduce airborne spray drift between 60% and 90%, and reduce spray loss to the ground between 40% and 80%, resulting in chemical savings in a range of $56 to $812 per acre annually. At the same time, the insect and disease control efficiencies are comparable or even better than standard sprayer practices. Because it uses less spray volume, it can spray more acres with the same amount of tank mixtures, thus reducing tank refilling times and reducing labor and fuel costs.
As a result, Smart Guided Systems, LLC commercialized the intelligent spray system, and a commercial version of the product has been developed with joint efforts between USDA-ARS and Smart Guided Systems, LLC. The new control system (See Figure 1) includes a new laser sensor, an Android Samsung tablet, a GPS navigator, an automatic flow rate controller, air filtration unit, a toggle switch box and a universal mounting kit.
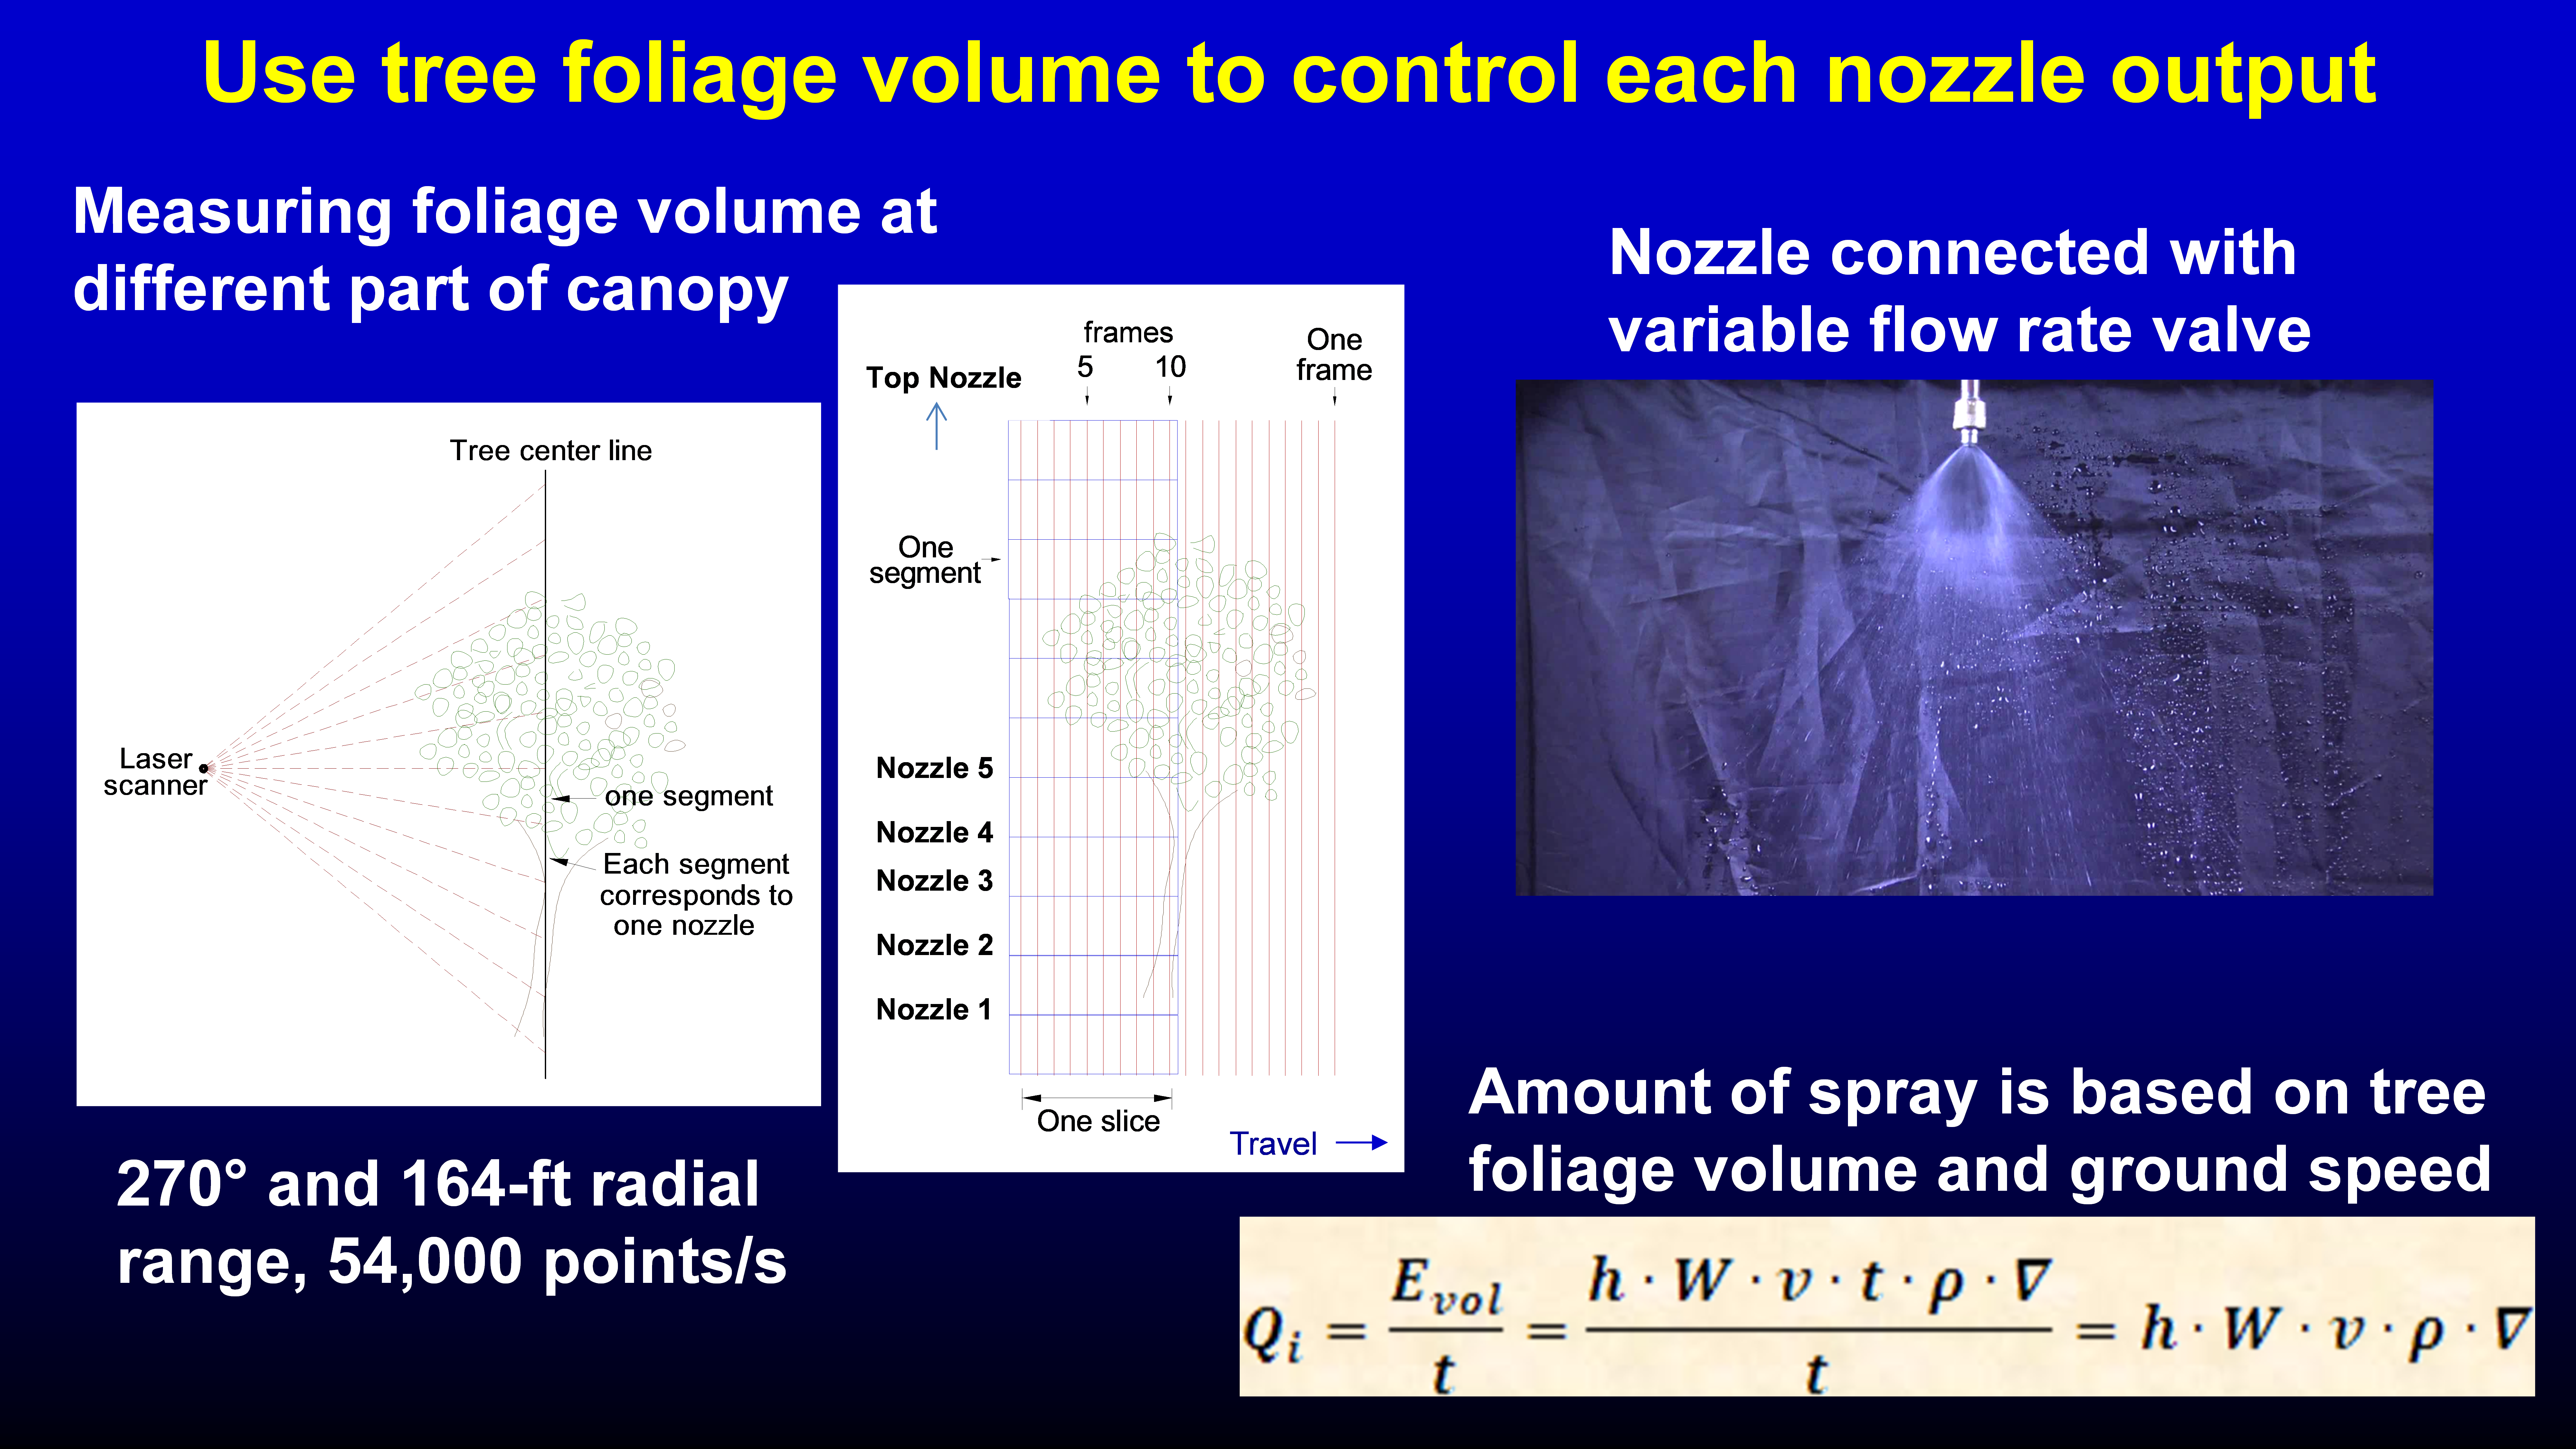
The laser sensor is mounted between the tractor and the sprayer to “see” plants on both sides of the sprayer. It releases 54,000 detection signals per second with a 270-degree and 164-ft radial detection range. The laser signals bounced back from the plant canopies is used to determine the presence of a plant canopy and measure the canopy height, width, foliage density and canopy foliage volume (Figure 2). The GPS navigation device (or the radar speed sensor mounted at the bottom of the sprayer) measures sprayer travel speeds and location of each plant in the field. Based on the plant canopy foliage volume and the sprayer ground speed, the amount of spray for each nozzle is determined and then discharged to different parts of each plant in real time. Each nozzle is connected to a 10 Hz pulse width modulation (PWM) solenoid valve, and the nozzle flow rates are controlled by manipulating the duty cycle of the PWM waveforms with the flow controller. The flow controller consists of microprocessors to generate flow rate commands for each nozzle to discharge variable spray rates. Field data collected and processed with the intelligent spray system are synchronized through the tablet WiFi to the cloud.
Figure 2. Laser sensor signals are used to measure canopy architecture and then manipulate individual nozzle flow rates as the function of the sectional canopy foliage volume and travel speed in real time.
The Android tablet provides the information for operators to communicate with the spray control system. The screen displays the sprayer travel speed, total discharged spray volume, spray width, and active nozzles. The operator can use the touch screen to modify the spray parameters as needed. The tablet allows the operator to activate the sprayer output on one or both sides in manual or automatic mode. All the electronic devices are powered by a 12V DC tractor battery. Another precaution includes the air filtration unit to discharge filtered air to prevent the laser sensor surface from getting dust and droplets. The toggle switches on the switch box are used to turn on/off main power, turn on/off the air filtration unit manually and override the automatic controller to activate nozzles as needed. Because sprayer travel speeds are automatically measured and included in the spray output control, applicators do not need to specify how fast they drive the tractor. However, travel speeds are not suggested to be higher than 5 MPH for orchard spray applications.
Features in the commercial system also include tree counting, tree size, foliage density heat map comparison capability, liquid volume sprayed per plant, maps of sprayed plant locations, ability to turn nozzles on/off independently through the tablet screen, cloud sync feature, web portal for configuration settings and spray coverage report view, system log files, five different languages (English, Spanish, French, German and Italian), and options for choosing metric or imperial units. The commercial products have been used by growers in the US and other countries with crops including citrus, nursery, pecan, blueberry, peach, almond, apple and pear with pesticide usage reductions in the range between 30% to 85% depending on crop types and growth stages. John Deere also established an agreement with Smart Guided Systems to sell the commercial intelligent spray control system for use in high-value crop applications through their dealer network.
The intelligent spray control system advances conventional standard pesticide application systems with the flexibility to spray specific positions on the plants. It reduces human involvement in decisions on how much spray volume is needed because the spray volume applied in the field is automatically controlled by the plant foliage volume instead of the antiquated gallons per acre.
The conventional air-blast spray system has been used from generation to generation for almost 80 years because of its robustness. Growers have accumulated extensive experience on using it to control pests in accommodation with their own crops. After being retrofitted with the intelligent spray control system, the conventional sprayers are able to turn on and off each nozzle and will stop spraying non-target areas such as gaps between trees, on the ground and above trees while their capabilities of spray penetration, spray range and spray deposition quality on plants remain the same. This new generation of spray technology is anticipated to be a primary precision spray technology for future decades to save chemicals for growers and provide a sustainable and environmentally responsible approach to protecting crops.
Figure 1
Distribution of ease of questions in an academic exam compared to certification testing.
I never really understood what certification means until I heard it described by a psychometrician. I have been a Certified Crop Advisor (CCA) for nearly two decades and felt I knew what it means to be a certified professional. I recently attended the North American Certified Crop Advisors On-line Board Meeting. I listened to a presentation by Scott Thayn, Ph.D., CMS, a psychometrician, or a statistician specializing in distinguishing the differences between individuals. Thayn is the president of Certification Management Services, the third-party agency hired by the Agronomy Society to help develop and manage the testing required for certification. The presentation addressed a proposal to give rankings on how well a test taker did on the CCA exam. Board members were hearing from potential members who were unable to pass the exams and wanted more feedback to help them study for their next attempt. The proposal, and the way the statistician took it apart, were a revelation, and it got me thinking that the mechanics behind certification are not well understood.
Certification Exam Intricacies
The Home page for Certifications under the website Agronomy.org states, “Certification is the standard by which professionals are judged. The purpose of a certification program is to protect the public and the profession. It is a voluntary enhancement to a person’s career credentials. Being certified adds credibility and shows that you are serious about what you do.”
A prospective candidate digging deeper would find they need to meet certain criteria to be considered a CCA: academic, experience and examination. Simply speaking, certification indicates one has demonstrated the knowledge and experience to perform at a higher level than their peers.
Hearing the proposal to give test takers feedback on their performance was familiar to me as a board member who participates on the Exam Committee for the Western Region. I have heard from many colleagues who did not pass one or both certification exams and are frustrated by the lack of a score or indication where they underperformed. I struggled to explain to my friends why the exams were pass/fail and why they just had to keep trying. I believe the frustration lies in the expectations of an academic testing experience clashing with the reality of certification exams.
Data indicates most people who take the certification exams are recent college graduates. Having a college degree in agriculture is a requirement for becoming a certified crop advisor. College graduates have spent most of their lives with graded exams. Academic testing presents a broad range of questions to both examine a student’s proficiency and encourage them to improve. A student who gets a low grade on a test will hopefully review the questions marked incorrect and study the subject to raise their grade on the final exam. This familiar approach to testing is contrary to certification exams.
The distribution of difficulty of certification exam questions is quite narrow compared to an academic exam (See Figure 1). The certification exam begins by defining competency areas, the major subjects that define the everyday work of the crop advisor. Performance objectives rest under the competency areas. Each performance objective spawns several possible exam questions. Each exam question must be tied to a performance objective to accurately test one’s comprehensive knowledge of agronomy.
Where an academic exam contains a large variation in question difficulty, certification exam questions ask, “What is the minimum knowledge a professional must have to be proficient in this area.” This is determined by groups of volunteer CCAs, with guidance by the Agronomy Society’s excellent statistician Dawn Gibas, Ph.D., who reviews the performance of each exam question. Questions that nearly everyone gets right are eliminated as well as those that almost no one answers correctly. A complete exam review process takes place every four to five years.
An illustration of the difference between academic and certification exams can be given with a sports analogy. An academic exam is comparable to a high school physical education track and field program, where everyone is expected and encouraged to participate. A certification exam, on the other hand, is like the selection process for the Olympic high jumping team. The high school physical education program sets the bar low and gradually raises it to help students practice their technique and jump higher. But when the world competition is jumping over seven feet, the US team would set the bar at a level near that to select the most competitive team. During the selection process, if the bar is set too high, then they don’t have a team, but set the bar too low and the team has a poor chance of winning. When the psychometrician used this example, the proposal to classify the specific abilities of test takers was withdrawn.
The complexity of 21st-century agriculture practiced in the Western Region of the US supports the need for the most qualified field people providing the best recommendations for our growers so we can continue to deliver the highest-quality, safest agricultural products in the world.
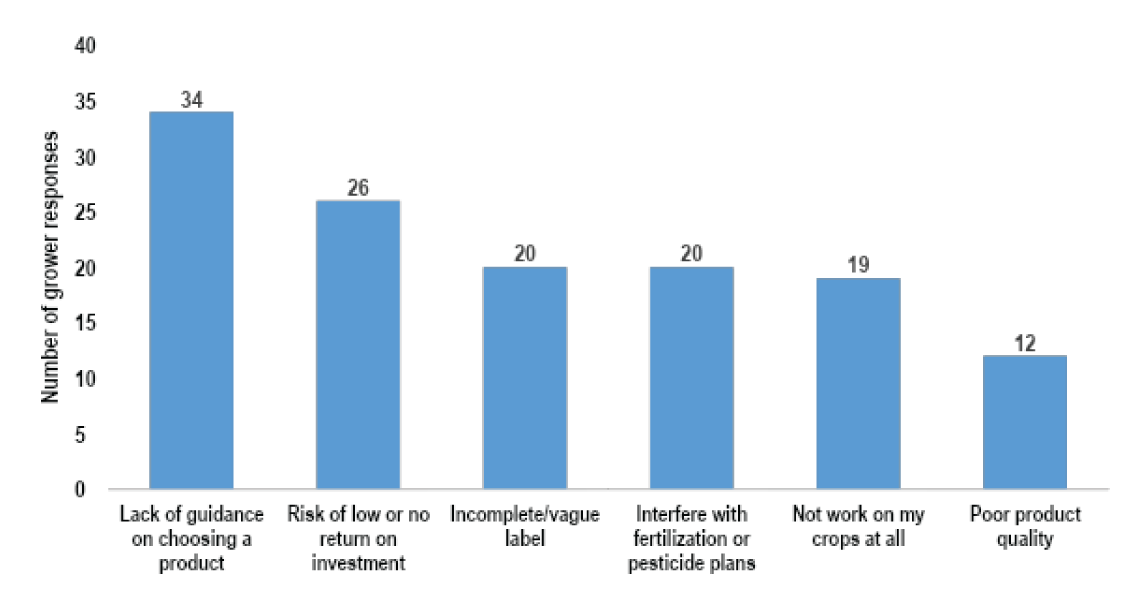
Concerns of incomplete label and interference with fertilization and pesticide plans received 20 responses in the survey. (all photos by Z. Wang.)
Crop biostimulants are many things. First, they are claimed to be multi-functional, including enhancement of soil and crop health, acceleration of soil nutrient cycling and improvement of crop productivity and fruit quality, among other benefits. Second, they are categorized by the active ingredient, application method, cost and target crops. Third, they are popular among ever-greater numbers of vegetable farmers regardless of production system, scale and commodity. Finally, some of their performance/efficacy is variable, while many others are unknown.
According to Grand View Research Inc., the global revenue generated by biostimulants was $1.74 billion in 2016, dominated by European and North American companies. Projections indicate that the market value will reach $4.14 billion by 2025.
Though it is difficult to obtain an exact number of biostimulant products currently on the market, the estimate is over 600 with more becoming available each year. However, this grand prosperity of crop biostimulants is not shared equally among people who use them. Particularly to vegetable growers who operate farming at every scale that differs widely in climates, production timing, marketable portion, planting techniques, field preparation and maturity, it can be extremely complex to choose the right product from the long list and use it at the right time in the right way. The first and maybe the foremost step toward a more effective use of crop biostimulants among vegetable growers is to understand their current use, experience, concerns and hopes. To accomplish the task, a survey was sent out to collect the specific information from vegetable growers mainly in the San Joaquin Valley and other counties in California.
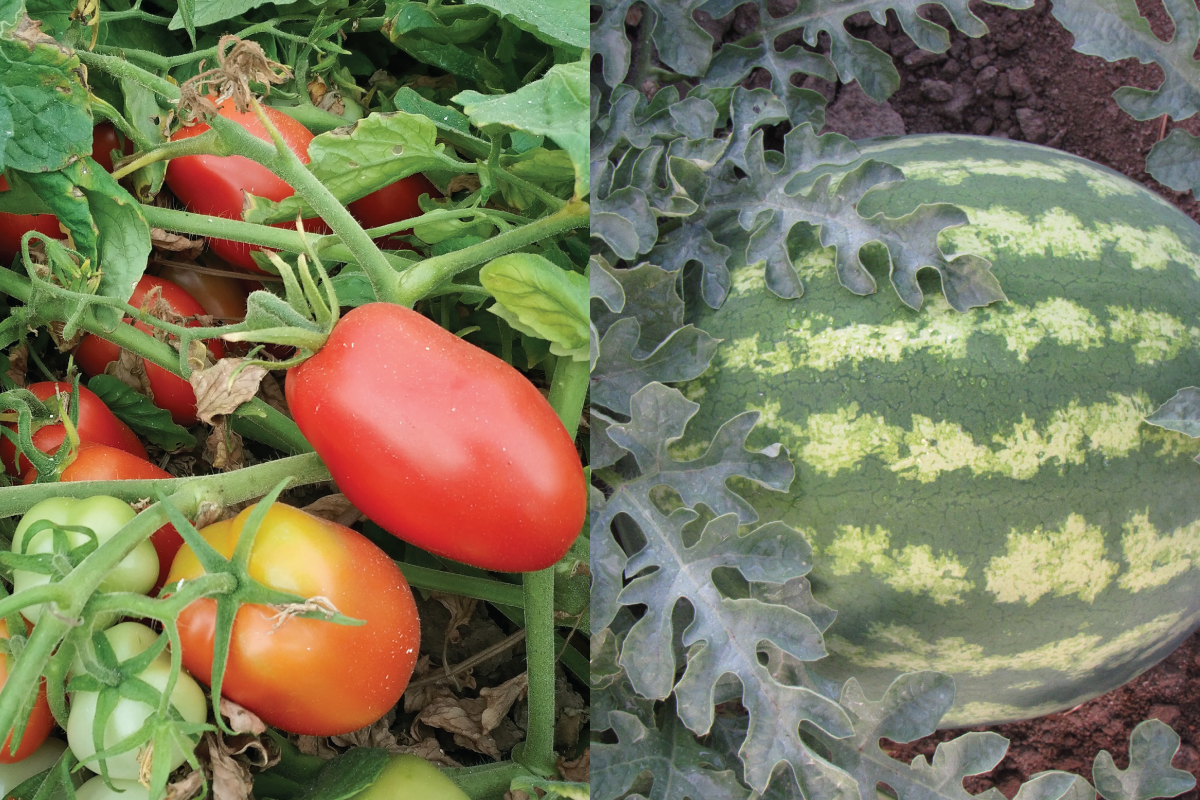
Tomato (46) and watermelon (16) each represented crops with more than 10 submitted responses (photos by Z. Wang.)
The Survey and Respondent
The survey was sent to approximately 648 vegetable growers in late October 2020 with the help of other UCCE advisors and commodity boards. The survey was then closed about two months thereafter before the responses were summarized. The original survey can be found at cestanislaus.ucanr.edu/Agriculture/Vegetable_Crops/Biostimulant_Survey/. The survey contains eight questions with the first four asking growers how they farm and the last four related to their experience and opinions to crop biostimulants. By the end of December 2020, we received a total of 83 responses (12.8%), with 74 of them being valid responses (11.4%). Nine responses were not included because there were two replies without an answer to any of the question, five responses from oversea, and two responses from counties outside California. Details about the composition and production of the 74 respondents are included below and in Table 1.
By production, there were 10, 27 and 37 growers claiming organic only, conventional only and mix of both.
By scale, there were 31, 7 and 36 growers with vegetable production scale below 100 acres, 100 to 500 acres and over 500 acres.
By commodity, crops with more than 10 responses included tomato (46), pepper (23), melon (21), summer/winter squash (21), leafy greens/herbs (21), cole crops (16), watermelon (16) and onion (13).
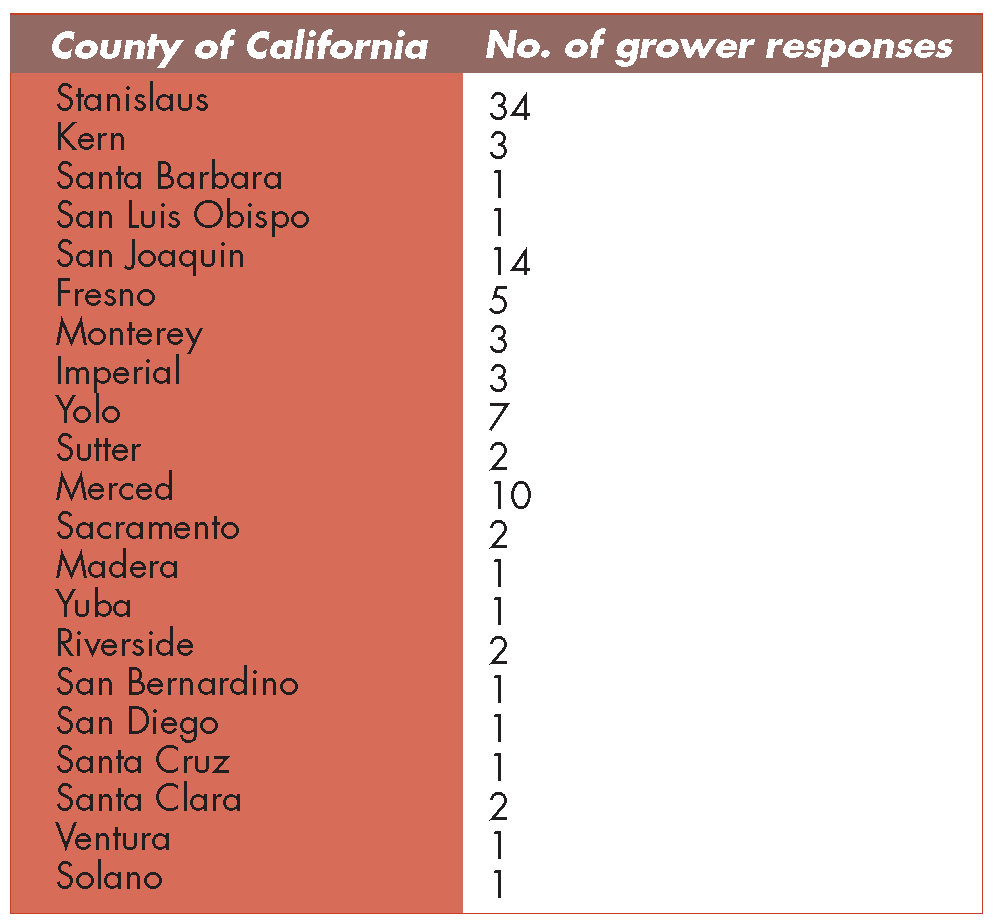
By production location, the 74 growers claimed to have their vegetable fields in 21 counties across California. For details, see Table 1.
Table 1. List of counties for the respondents’ vegetable field locations.
Responses Regarding Biostimulants
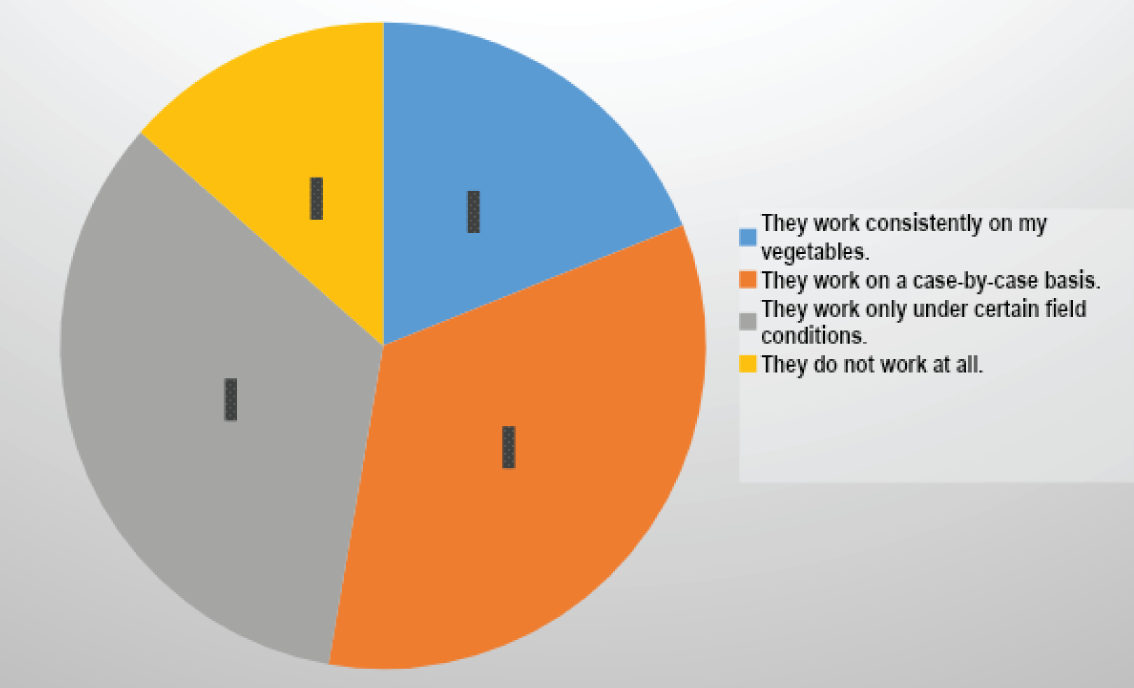
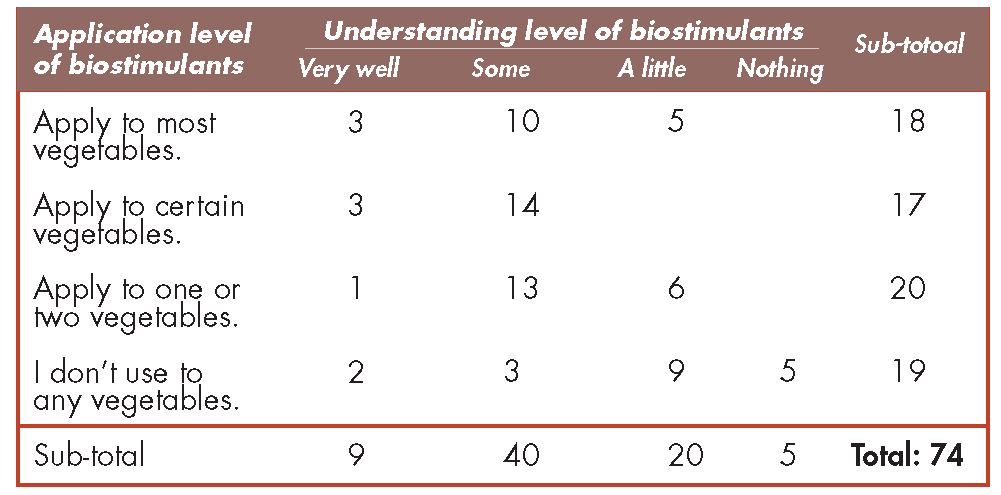
The responses indicated that over half of respondents (40) know some knowledge about biostimulants, of which 37 applied biostimulants to at least one or two of their vegetable crops. There were nine growers who claimed having the highest knowledge level (very well), but two of them did not use biostimulants to any of their vegetable crops. There is no surprise that the majority of growers who responded with just a little knowledge or not knowing anything about crop biostimulants did not apply any biostimulant to any of their vegetable crops. The respondents were almost equally distributed by the application level of biostimulants (Table 2). The survey also asked the previous experience or future impression regarding the efficacy of biostimulants on improving vegetable growth. From the results, 50 growers, representing 68% of total respondents, shared the experience or impression that biostimulants could conditionally confer their efficacy. Less than 20% of the respondents indicated a consistent, positive performance on improving their vegetable crops, while only 13% gave the negative impression on biostimulant efficacy (Figure 1).
Figure 1. Responses to previous experience or future impression regarding biostimulant efficacy.Table 2. Number of grower responses to the understanding/knowledge level of biostimulants and how much of vegetable crops growers apply biostimulants to.
Concerns and Hopes
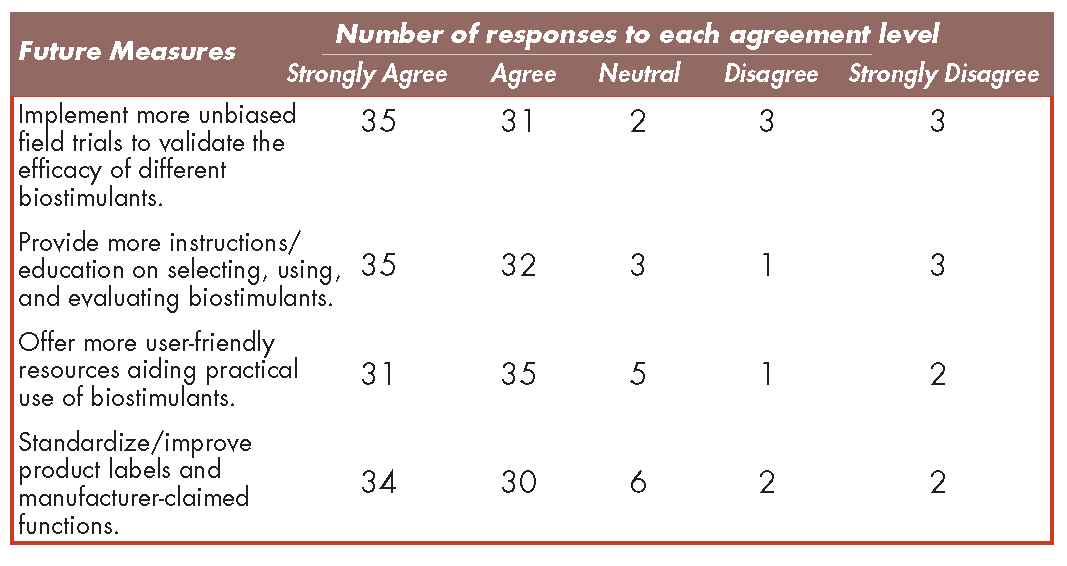
I have received numerous questions in the past years from vegetable growers, their advisors and colleagues regarding the biostimulant selection, effect evaluation, quality control and incompatibility with other field activities. “Going in blind”, “Unable to identify the benefits”, and “Snake oil” are common complaints. One of the main objectives for the survey is to identify the biggest concerns of using biostimulants on vegetable crops among growers. The survey results showed that about half of the respondents identified the difficulty of choosing a proper product as one of the main concerns followed by the risk of low or no return on investment. In addition, concerns of incomplete label and interference with fertilization and pesticide plans received 20 responses (Figure 2). Lastly, the survey asked growers their agreement level to future actions of improving the use of crop biostimulants. For all future measures, an average of 89% of the respondents agreed/strongly agreed that they will be helpful and important to improve future use of crop biostimulants (Table 3). These responses reflect the hopes from growers, and their voices should be heard by academia, industry, extension and other sectors to outline future efforts aiding a practical and profitable use of these biologics.
Figure 2. Growers’ concerns regarding the use of crop biostimulants on vegetable crops.Table 3. Number of responses to the agreement on the importance of future measures in improving the use of biostimulants.
UCCE Biostimulant Testing Trials
The UCCE farm advisors from Stanislaus County are actively working with vegetable growers and biostimulant companies to conduct various testing trials each year. The main goal is to fill the data gap with more unbiased, statistically-viable product efficacy data on various vegetable commodities in the Central Valley. Since 2019, we have evaluated numerous biostimulants on processing tomato and watermelon productivity, fruit quality and plant health. Stay tuned to our newsletter and check for previous results (Veg Views: cestanislaus.ucanr.edu/news_102/Veg_Views/).
References
Biofertilizers Market Size, Share & Trends Analysis Report By Product, By Application, And Segment Forecasts, 2012 – 2022. grandviewresearch.com/industry-analysis/biofertilizers-industry.


")


 Invading California")

