


Brassica crops such as broccoli, brussels sprouts, cabbage, canola, cauliflower, collards, kale, kohlrabi, turnip and mustards are important vegetable or oilseed crops. The value of brassica vegetables, also known as cole crops, is more than $1.2 billion in California, which is the leading producer of these crops. Among various arthropod pests that attack brassica crops, the diamondback moth (DBM), Plutella xylostella (Lepidoptera: Plutellidae), is of significant importance. Thought to be of European origin, now with worldwide distribution, DBM exclusively feeds on cultivated and weedy crucifers. DBM can have up to 12 generations per year, especially under warmer climate.
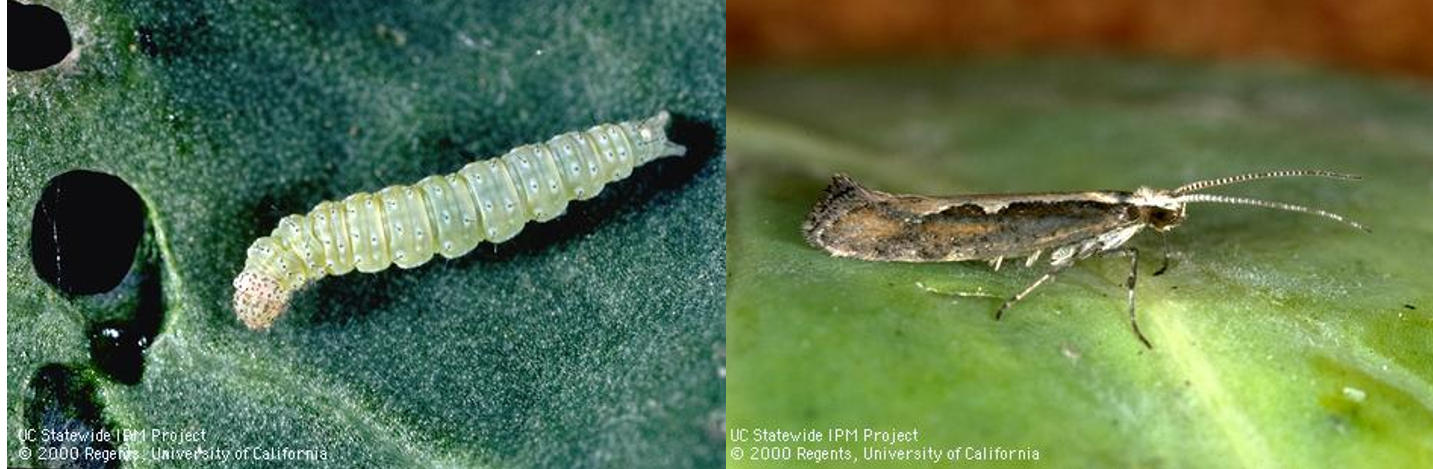
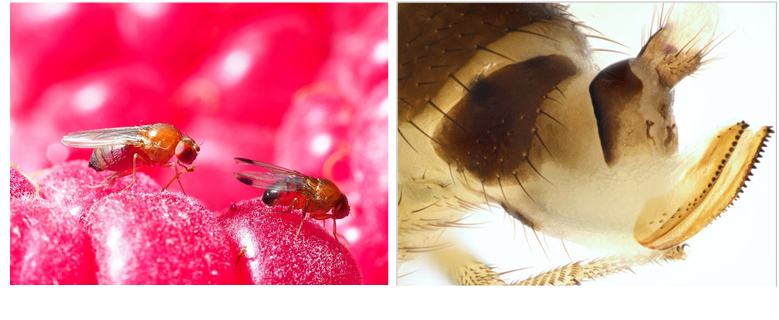
Female moths deposit 150 eggs on average. Four larval instars feed on foliage and growing parts of young plants or bore into heads or flower buds, resulting in skeletonization of leaves, stunting of the plants or failure of head formation in some hosts. Pupation occurs on the lower surface of leaves or in florets. Adult moths are grayish-brown, and when at rest, a light-colored diamond-shaped pattern can be seen on the upper side of the wings.
Farmers typically rely on synthetic and biological insecticidal applications for controlling DBM. Multiple species of parasitoids and predatory arthropods also provide some control. Due to a heavy reliance on insecticidal control, DBM resistance to several insecticides is a common problem. Resistance of DBM to Bacillus thuringiensis (Ferré et al., 1991), abamectin (Pu et al., 2009), emamectin benzoate, indoxacarb and spinosad (Zhao et al., 2006), pyrethroids and other insecticides (Leibee and Savage, 1992; Endersby et al., 2011) have been reported from around the world. Excessive use of any kind of pesticide leads to resistance problems (Dara, 2020) to an individual pesticide or multiple pesticides.
Integrated pest management (IPM) strategy encourages the use of various control options for maintaining pest control efficacy and reducing the risk of resistance development (Dara, 2019). Regularly monitoring pest populations to make treatment decisions, rotating pesticides with different modes of action, exploring the potential of biocontrol agents, and other non-chemical control approaches such as mating disruption with pheromones are some of the IPM strategies for controlling the DBM. While sex pheromones are effectively used to manage several lepidopteran pests and are proven to be a critical IPM tool, mating disruption is not fully explored for controlling DBM. A study was conducted in Brussels sprouts to evaluate the efficacy of a sprayable pheromone against the DBM and to enhance current IPM strategies.
Methodology
The study was conducted on a 10-acre Brussels sprouts field in Santa Maria. Cultivar Marte was planted in early July for harvesting in December 2020. A typical diamondback control program includes monitoring DBM populations with the help of sticky traps and lures and applying various combinations of biological and synthetic pesticides at regular intervals. This study evaluated the efficacy of adding CheckMate DBM-F to the grower standard practice of monitoring the DBM populations with traps and lures and applying pesticides. Treatments included 1.) grower standard pesticide program (See Table 1) grower standard pesticide program with two applications of 3.1 fl oz of CheckMate DBM-F on August 9 and September 11. Treatment materials were applied by a tractor-mounted sprayer using a 100 gpa spray volume and necessary buffering agents and surfactants. Each treatment was five acres and divided into four quadrants representing four replications.
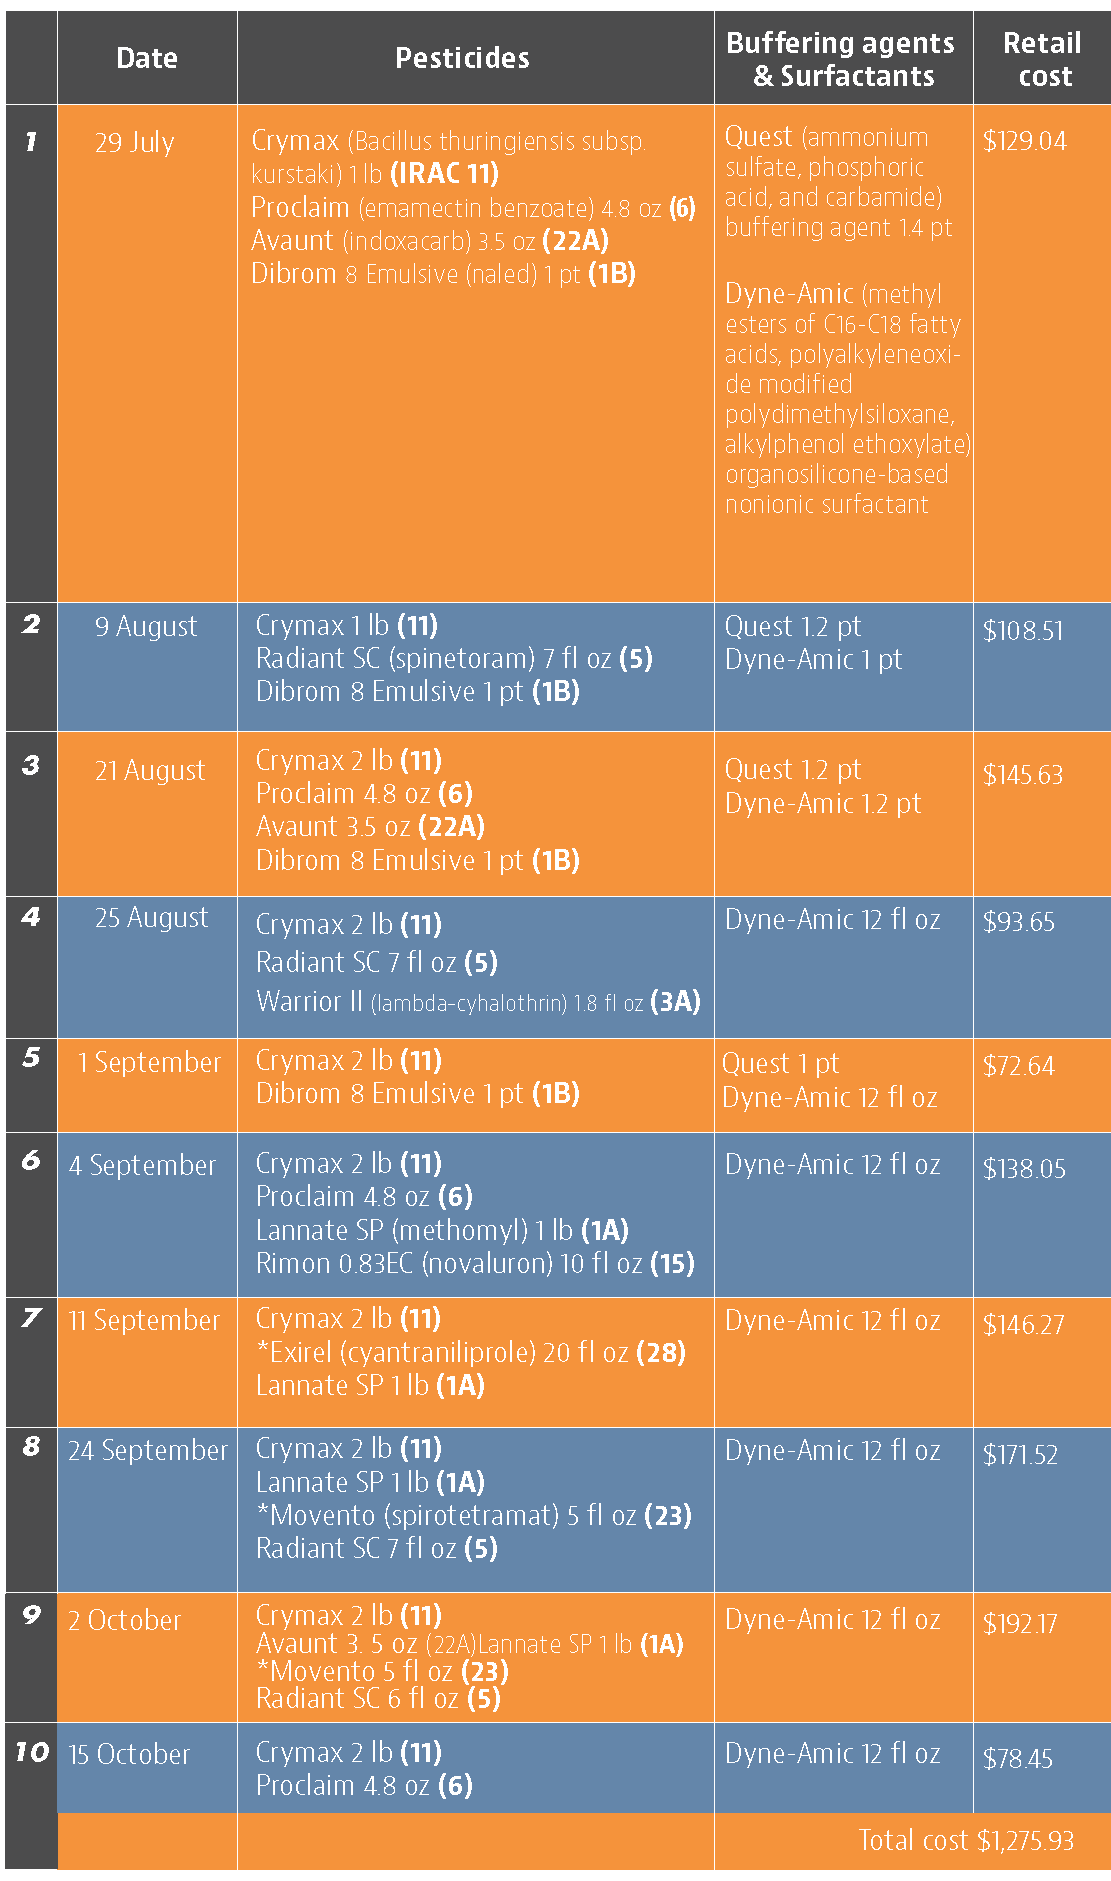
In the middle of each quadrant, one Suterra Wing Trap was set up with a Trécé Pherocon Diamondback Moth Lure. Lures were replaced once a month in early September and early October. Sticky liners of the traps were replaced every week to count the number of moths trapped. Traps were placed on Aug. 1, 12 and 24, Sept. 1, 11, 18 and 27, and Oct 6, and the moth counts were taken from respective traps on Aug. 8 and 20, Sept. 1, 11, 18 and 27, and Oct. 6 and 15. CheckMate DBM-F was applied at 3.1 fl oz/ac on Aug. 9 and Sept. 11. The number of larvae and their feeding damage on a scale of 0 to 4 (where 0=no damage, 1=light damage, 2=moderate damage, 3=high damage, 4=extensive/irrecoverable) were recorded from 25 random plants within each replication on Aug. 30 and Oct. 6 and 18. Data were subjected to analysis of variance using Statistix software and significant means were separated using Tukey’s HSD test. The retail value of various pesticides was also obtained to compare the cost of treatments.
When CheckMate DBM-F[(Z)-11-Hexadecenal (3) , (Z)-11-Hexadecen-1-yl Acetate (1)] was applied the first time on Aug. 9, Dibrom 8 Emulsive was replaced with Warrior II, the buffering agent Quest was not used, and the surfactant Dyne-Amic was replaced with Induce (dimethylpolysiloxane) to avoid potential compatibility issues. The impact of this substitution is expected to be negligible within the scope of this study. The retail cost of 3.1 fl oz CheckMate DBM-F is $45.60. The cost of lures and traps would be about $4 to $8 per acre for a six-month crop like Brussels sprouts.
Results and Discussion
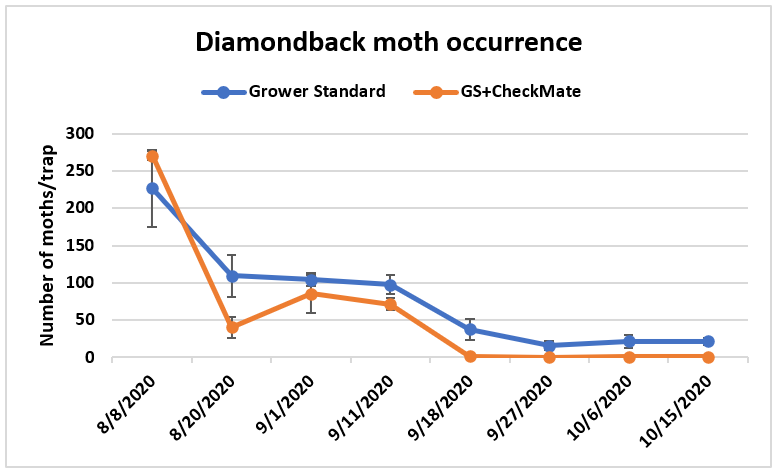
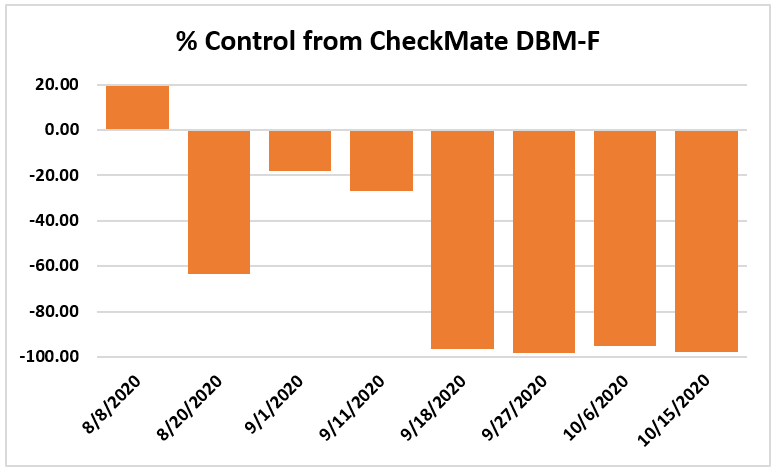
Traps in replication 4 in both treatments on August 8 and replication 1 in the grower standard were missing, probably knocked down by a tractor. The day before CheckMate DBM-F was first applied, the mean number of adult DMB caught was 227 in the grower standard and 271 in the plots that would receive the pheromone application (Figure 1). There was a gradual decline in moth counts during the rest of the observation period in both treatments. However, the decline was higher in the plots that received CheckMate DBM-F. The number of moths per trap were about 19% higher in the pheromone-treated plots compared to the grower standard before the study but were nearly 98% lower by the end of the study (Figure 2). The reduction in moth populations from mating disruption was significant on September 18 (P =0.039) and October 15 (P = 0.006).
The mean number of larvae per 25 plants in a replication was zero on all observation dates except for 0.01 on Aug. 30 in the plots that received CheckMate. Four insecticide applications made by the time the study was initiated and the remaining six applications effectively suppressed larval populations.
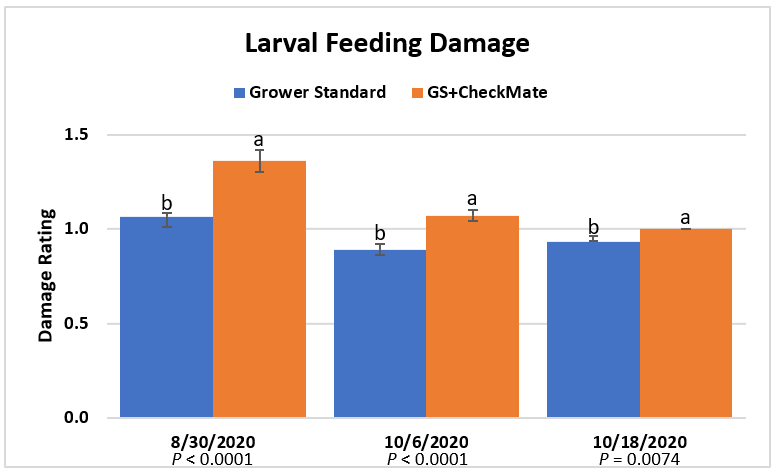
Larval feeding damage ratings were consistently low (P < 0.0001) in the plants that did not receive CheckMate DBM-F (Figure 3). The damage was limited to the older leaves at the bottom of the plants and must have been from early feeding before the initiation of the study. The lack of larvae and the evidence of new feeding damage also confirm that the crop remained healthy and pest-free.
Yield and Cost Comparisons
Since frequent pesticide applications effectively suppressed larval populations and prevented their feeding damage, the effectiveness of mating disruption on larval populations or their damage could not be determined in this study. Moths found in the traps probably developed from the larvae in the field or could have been those that flew in from other areas.
However, lower moth populations in CheckMate DBM-F treatment demonstrated the overall influence of mating disruption and pest suppression.
It is common to make about 10 to 12 pesticide sprays during the six-month crop cycle of Brussels sprouts. The cost of each application varied from about $73 to $192 depending on the materials used with an average cost of about $128 per application in this study. The cost of two CheckMate DBM-F applications is $91. If diamondback moth populations could be reduced with mating disruption, it is estimated that two to three pesticide applications could be eliminated. That results in $164 to $292 of saving for the pesticide costs and additional savings in the application costs per acre by investing $91 in the mating disruption. Since DBM can develop resistance to several chemical and natural pesticides, eliminating some applications as a result of mating disruption also contributes to resistance management along with potential negative impact of pesticides on the environment. Compared to other mating disruption strategies, a sprayable formulation compatible with other agricultural inputs is easier and more cost-effective to use.
The grower’s yield data showed 762 cartons/acre from the grower standard block with pesticides alone and 814 cartons/acre from the block that received pesticide and pheromone applications. Although there seems to be a 7% yield difference, since data from individual plots could not be collected for statistical analysis, the impact of DBM mating disruption on yield improvement is inconclusive.
This study demonstrated that mating disruption with CheckMate DBM-F will significantly enhance the current IPM practices by reducing pest populations, contributing to insecticide resistance management, and reducing pest management costs. Additional studies with fewer pesticide applications that allow larvae to survive and cause some damage might further help to understand the role of mating disruption where pest populations are not managed as effectively as in this field.
Thanks to the PCA and grower for their research collaboration, Tamas Zold for his technical assistance in data collection, Ingrid Schumann for market research of pesticide pricing and Suterra for the financial support.

References
Dara, S. K. 2019. The new integrated pest management paradigm for the modern age. J. Int. Pest Manag. 10: 12.
Dara, S. K. 2020. Arthropod resistance to biopesticides. Organic Farmer 3 (4): 16-19.
Endersby, N. M., K. Viduka, S. W. Baxter, J. Saw, D. G. Heckel, and S. W. McKechnie. 2011. Widespread pyrethroid resistance in Australian diamondback moth, Plutella xylostella (L.), is related to multiple mutations in the para soidum channel gene. Bull. Entomol. Res. 101: 393.
Ferré, J., M. D., Real, J. Van Rie, S. Jansens, and M. Peferoen. 1991. Resistance to the Bacillus thuringiensis bioinsecticide in a field population of Plutella xylostella is due to a change in a midgut membrane receptor. Proc. Nat. Acad. Sci. 88: 5119-5123.
Leibee, G. L. and K. E. Savage. 1992. Evaluation of selected insecticides for control of diamondback moth and cabbage looper in cabbage in Central Florida with observations on insecticide resistance in the diamondback moth. Fla. Entomol. 75: 585-591.
Pu, X., Y. Yang, S. Wu, and Y. Wu. 2009. Characterisation of abamectin resistance in a field-evolved multiresistant population of Plutella xylostella. Pest Manag. Sci. 66: 371-378.
Zhao, J-Z., H. L. Collins, Y-X. Li, R.F.L. Mau, G. D. Thompson, M. Hertlein, J. T. Andaloro, R. Boykin, and A. M. Shelton. 2006. Monitoring of diamondback moth (Lepidoptera: Plutellidae) resistance to spinosad, indoxacarb, and emamectin benzoate. J. Econ. Entomol. 99: 176-181.


 Invading California")

