Home Blog Page 22

Vineyard Water Management During Drought Years

0
From top left to top right: poor and uneven budbreak; stunted shoot growth (Front: Petite Verdot on 5BB rootstock; Back: Cabernet Sauvignon on 1103P rootstock). From bottom left to bottom right: stunted canopy growth on Pinot Gris on Freedom rootstock with suckers pushing vigorously at the base; poor fruit set with excessive berry abscission (all photos courtesy G. Zhuang.)

This past winter was a dry year with a total of <8.5 inches of precipitation (November 2020 to March 2021) and that was significantly lower than the historical average of 11 inches for the San Joaquin Valley (SJV). Winter drought and freeze temperatures last November and December (minimal temperature was as low as 20 degrees F) caused some severe damages on grapevines, and the delayed spring growth (DSG) was mostly reported by growers. DSG includes erratic bud break, stunted shoot development, dead shoot tips and excessive berry abscission with suckers pushing vigorously at the base of the vine. Some DSG symptoms were very similar to the symptoms of drought or grapevine water stress. Generally, most DSG vines recover after an irrigation event starts; however, the impact of DSG on yield might persist (poor fruit set and small bunch size), and growers likely suffer from the economic loss.

In the face of upcoming drought challenges, growers need to focus on three main areas to improve irrigation efficiency and maximize yield and quality: soil, grapevine canopy and weather condition.


Soil

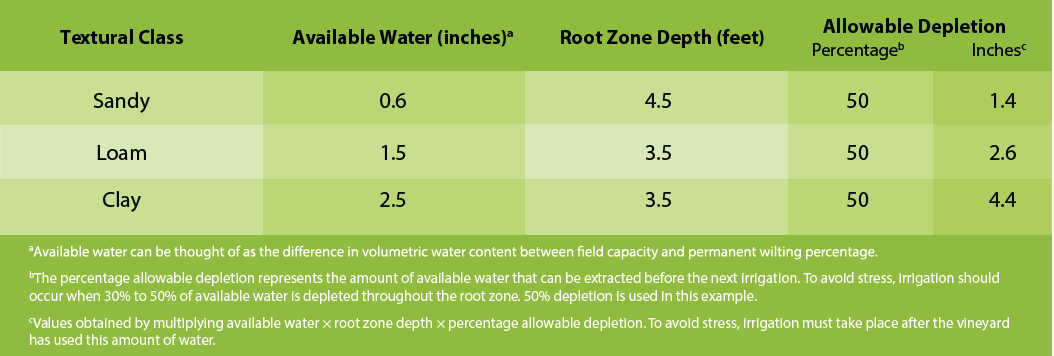
Most grape roots are in the top three feet of soil, and this is the main area where our irrigation works. Due to the lack of winter precipitation, dormant or early season irrigation is necessary to restore the soil moisture, which supports grapevine budbreak as well as early season shoot elongation. Given that the severe drought condition persists in most of SJV, growers need to assess the soil dryness and moisture content at individual sites, since different soil types can hold moisture quite differently (Table 1). Sandier soil holds water poorly in comparison to clay soil. Conversely, water percolates more rapidly in sandy soil than clay soil. Therefore, with the same amount of precipitation or irrigation, clay soil can hold more than sandy soil and grapevine/cover crop can deplete the soil moisture much faster at sandier sites. Soil type can be accessed through UC Davis SoilWeb (casoilresource.lawr.ucdavis.edu/gmap/), or can be analyzed through commercial laboratories by collecting representative soil samples at a site. Cover crop and middle row vegetation should be mowed earlier under drought conditions to preserve soil moisture.

Table 1: Representative values for available water content, rooting depth and allowable depletions for different soil types. Table is elaborated in Raisin Production Manual (L.P. Christensen 2000).

After understanding the different soil types and their water-holding characteristics, growers need to make the decision for first irrigation based on the soil moisture content, and that can be quite important during the current drought condition. Numerous tools are available for growers to use to measure soil moisture content, the most commonly used method being ‘feel and appearance’, where growers use a shovel or auger to dig out soil samples at different depths and feel the moisture by squeezing the soil in their hand.

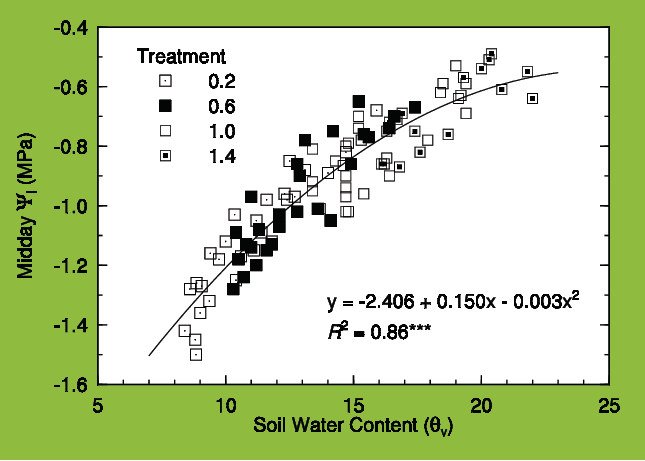
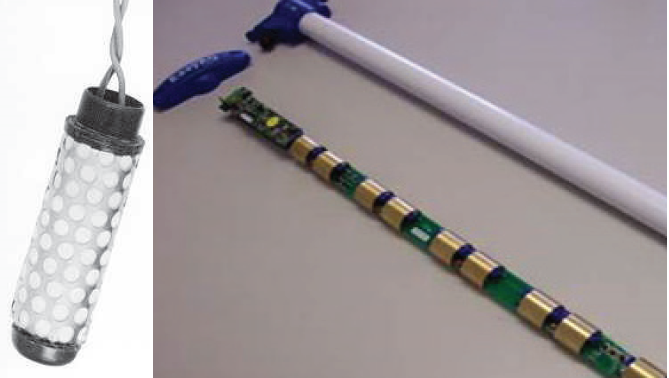
Currently, growers have access to many inexpensive soil moisture sensors which can help to measure soil moisture in real time. There are mainly two types of soil moisture sensors: one measures soil water tension (e.g., tensiometer or WaterMark™) and the other measures soil volumetric water content (e.g., Neutron probe and capacitance sensor). Soil-water tension tells you how hard it is for the grapevine roots to pull water from the soil particles, and the reading is typically negative with units of centibar. The more negative the reading, the harder it is for the grapevine roots to absorb water. Growers can set up the pre-determined value of soil-water tension (e.g., -30 centibar) at a certain soil depth {e.g., two feet). Once the soil-water tension reaches the value, the irrigation should start. The pre-determined soil-water tension is usually between -30 and -40 centibar in SJV, varying across different soil types. However, soil-water tension does not tell you how much water has been depleted or the available water content. Soil volumetric water content, on the other hand, offers the percentage of water volume versus the total soil volume and tells you the amount of water stored in the soil and how much you need to irrigate to maintain the desired water content. Growers should irrigate the vineyard when 30% to 50% of allowable water is depleted throughout the root zone (Table 1). The soil volumetric water content is also well correlated to plant water stress measured by midday leaf water potential, and growers can potentially use soil volumetric water content to assess grapevine water stress (Figure 1).

Overall, growers can use both soil-water tension and soil volumetric water content mentioned above to monitor the soil moisture either indirectly or directly and schedule irrigation.

Figure 1: Soil volumetric water content is correlated with midday leaf water potential. Data were collected from various irrigation treatments: 0.2 ETc, 0.6 ETc, 1.0 ETc and 1.4 ETc. Figure is elaborated in Williams and Trout 2005.


Grapevine Canopy

Grapevine canopy growth (e.g., budbreak and shoot elongation) depends on the availability of water and nutrients in the soil. Lack of soil moisture during the dormant season increases the risk of freeze damage and hinders the start of budbreak and early season shoot elongation, causing DSG. DSG usually occurs when the grapevine suffers water stress at the beginning of the growing season. If the drought condition persists, shoot elongation might be hampered, and the shoot tip might die off due to lack of water. Under severe drought stress, inflorescences will die off and cause significant yield loss.

To prevent early season vine water stress, soil moisture is the key measurement to decide when to irrigate as was previously mentioned. However, canopy appearance and visual assessment can help to confirm the success of an irrigation program. First, upward-growing shoot tips and tendrils are the most obvious signs of a healthy canopy. Second, a pressure chamber to measure midday leaf water potential might offer a powerful tool to validate the irrigation program (Table 2).

Table 2: Midday leaf water potential readings and related grapevine water stress.

Grapevine water demand is directly related to the amount of sunlight captured by the canopy, and a larger canopy needs more water than a smaller canopy due to receiving more light. Therefore, as the shoot grows and the canopy expands, grapevines generally use more water. Most grapevine irrigation recommendations are based on the canopy size and climatic condition. Canopy management (e.g., leafing, shoot tucking/thinning and hedging) has the potential to influence the canopy size and amount of light received, and ultimately water use.

Soil water tension sensor (left) and soil volumetric water content sensor (right)

Grapevines at different growth stages have different sensitivity and tolerance to water stress. From budbreak to bloom, the grapevine is very sensitive to water stress, and even a mild stress will hinder growth and cause irreversible yield loss. Generally, water stored in the soil profile after winter precipitation is enough to support vine growth. However, in years of drought such as this year, soil moisture may be inadequate to support growth, and irrigation is needed to replenish soil moisture. From bloom to fruit set, the grapevine is also sensitive to water stress, and severe stress causes poor set and yield loss. Fruit set to veraison is a good time to apply some stress if growers are looking to reduce berry size (e.g., smaller berry) and improve berry quality (e.g., color). However, the benefit of improved berry quality might come with the sacrifice of yield. Typically, in SJV, mild stress is recommended at this period to balance quality and yield. From veraison to harvest may be the best time to apply some stress to advance berry ripening and reduce disease pressure (e.g., bunch rot). However, growers need to avoid severe stress which results in excessive defoliation, since a healthy canopy is required for photosynthesis. Postharvest, it is generally recommended to replenish the soil profile, since the photosynthetic active canopy still produces the carbon to refill the reserve of trunk and roots, and the reserve will be used to support the vine growth of the following season. Postharvest irrigation in abundant quantities can also help to leach the salts and alleviate the concern of salinity.

Figure 2: Crop coefficient (Kc) is correlated with canopy size measured by leaf area. Figure is elaborated in Williams and Trout 2005.


Weather Conditions

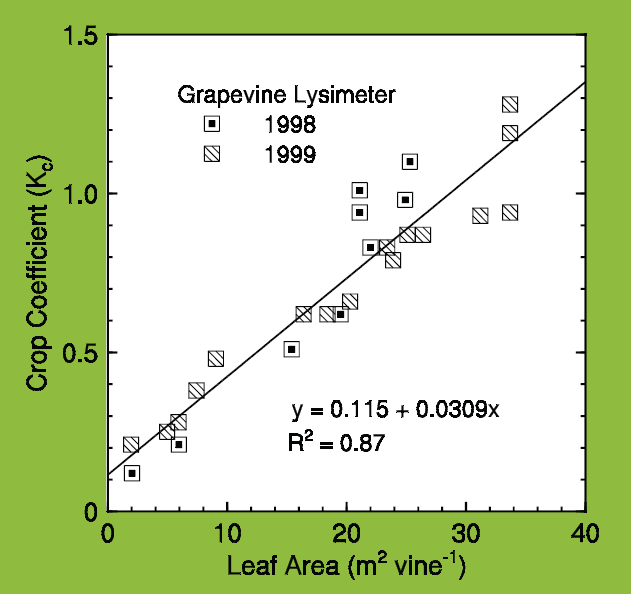
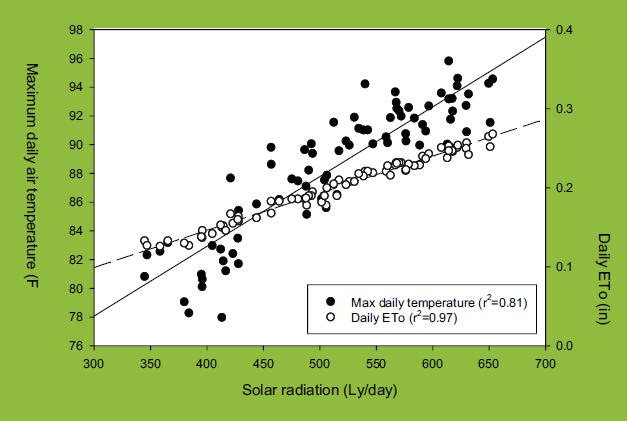
As was previously mentioned, grapevine water use depends on two main factors: canopy size and weather. Most growers know crop evapotranspiration (ET) and can calculate grapevine water demand over a given period through the calculation: grapevine evapotranspiration (ETc) = reference evapotranspiration (ETo) × crop coefficient (Kc). Growers can simply use ETc to irrigate the grapevines weekly by using gallons/vine/week or hours/vine/week after factoring in the application rate. Kc is related to canopy size (Figure 2, see page 38) and ETo is related to weather condition (Figure 3). ETo is strongly correlated with sunlight and the ambient temperature. A sunny and cloudless day will drive more grapevine water use than a cloudy and foggy day or a smokey day as occurred last year due to the wildfires. Similarly, a forecasted heat wave will cause severe water stress if there is lack of irrigation. Water stress coupled with temperatures >100 degrees F disrupts berry growth and sugar accumulation and causes yield loss and maturation delay.

Figure 3: Sunlight is strongly correlated with ETo and ambient temperature. Data points are extracted from last 10 years’ average during months of August, September and October at CIMIS station #56 in Los Banos.

Currently, there are different ways growers can adjust irrigation based on weather condition: 1) National Weather Service (digital.weather.gov/) provides the weather forecast as well as forecasted ETo. Growers can adjust the irrigation amount based on forecasted weather and ET. 2) UCCE is launching weekly crop ET reports (ucanr.edu/sites/viticulture-fresno/Irrigation_Scheduling/), so growers do not need to calculate weekly grapevine ET or gallons/vine/week themselves. Irrigation can be simply followed on the ET reports.

Finally, growers need to put economic consideration into water management. Water might be better used for younger blocks than a vineyard which is near the end of its lifespan, and it also makes more economic sense to use water for the cultivar which has a better price when the water is scarce. The take-home message on vineyard water management is:

  • Check soil moisture at all levels.
  • Assess canopy, vine water status and weather condition.
  • Spend water when it is needed the most.
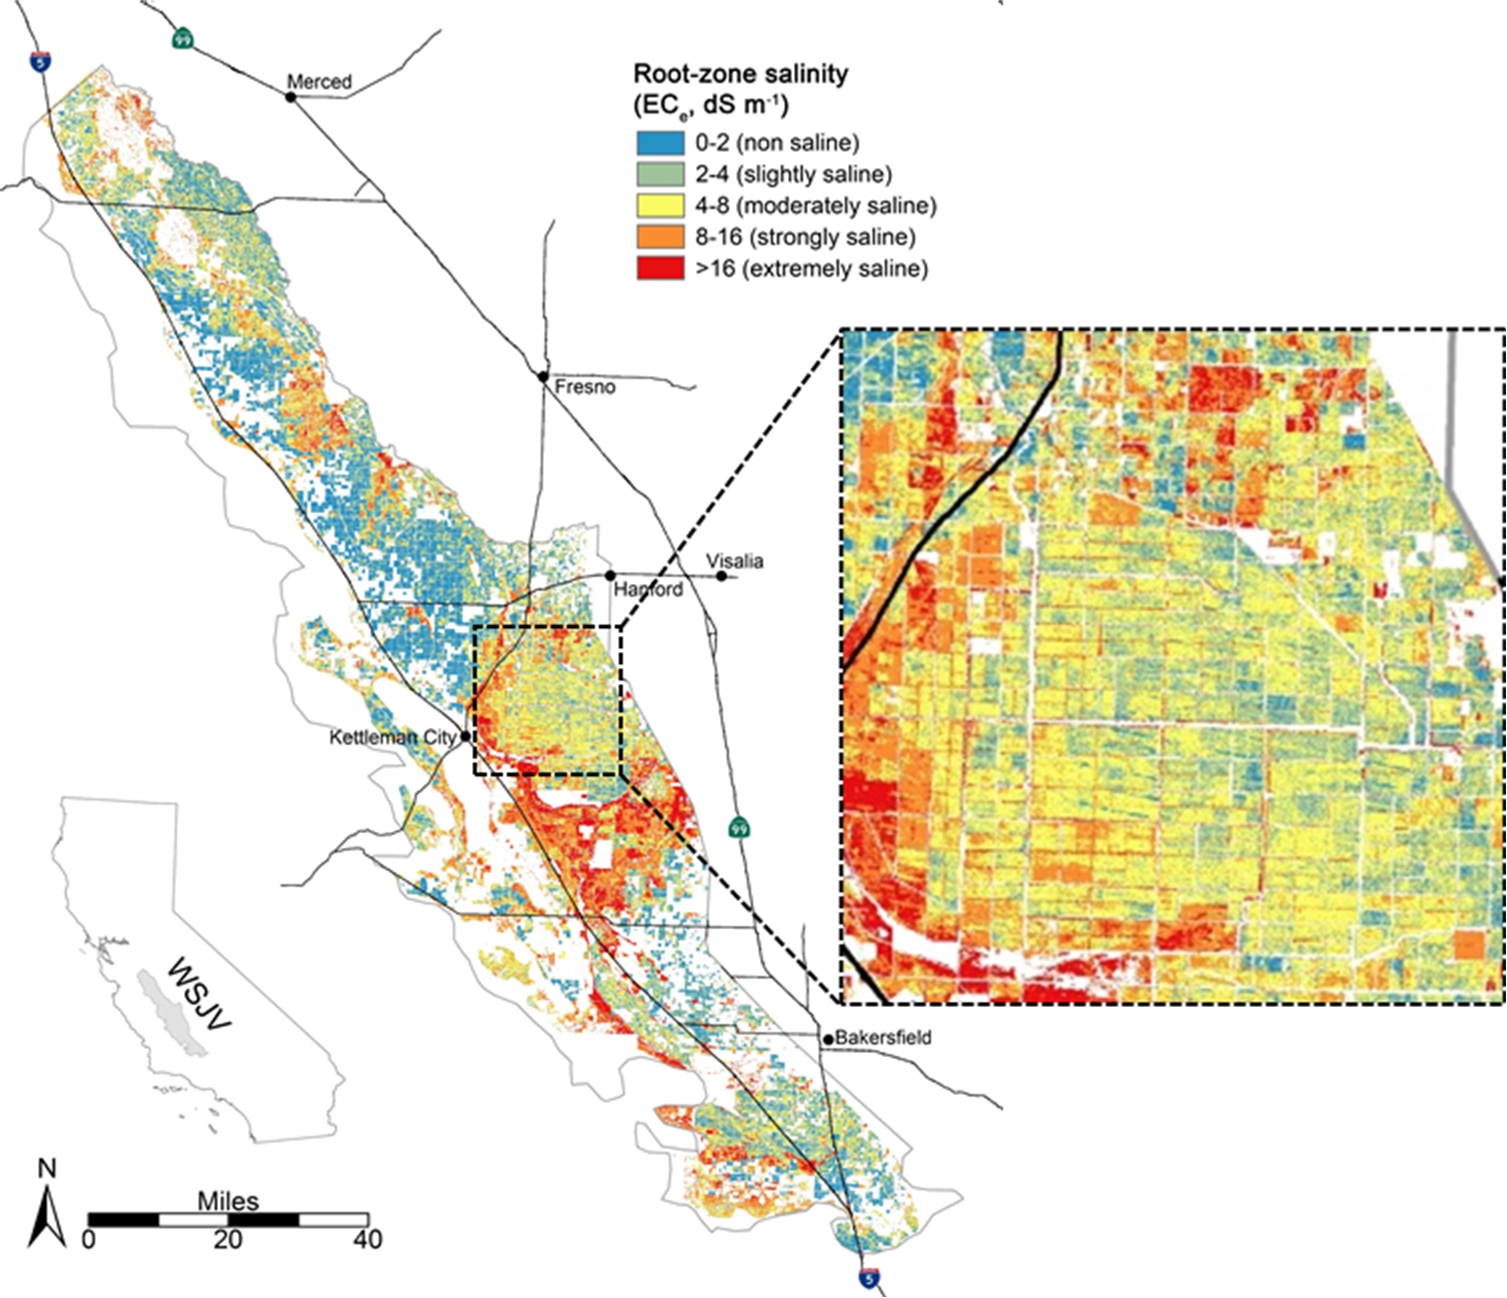
  • Salinity becomes an important factor in determining water management.
  • Mow cover crop or middle row vegetation early to preserve soil moisture.
Upward growing shoot tip and tendril (left), before pressure bomb, bagging leaf before cutting the petiole (top right), during pressure bomb, using magnified glass to observe popping water from the petiole (bottom right).

References

Williams, L. and Trout, T. 2005. Relationships among Vine- and Soil-Based Measures of Water Status in a Thompson Seedless Vineyard in Response to High-Frequency Drip Irrigation. Am J Enol Vitic. 56: 357-366.
L. P. Christensen. 2000. Raisin Production Manual. University of California Agriculture and Natural Resources Publication 3393.

First Pierce’s Disease Treatment Discovered

0
Bacteriophage therapy uses viruses that only infect and kill the bacterium. This precision treatment is injected with the use of a powered applicator directly into vines and targets the disease from within the plant’s vascular system (photo courtesy Inphatec.)

Texas A&M AgriLife research has led to the discovery of the first curative and preventive bacteriophage (bacterial virus) treatment against the pathogen Xylella fastidiosa, which causes the deadly Pierce’s Disease in grapevines. Bacteriophage therapy uses viruses that only infect and kill the bacterium. This precision treatment is injected with the use of a powered applicator directly into vines and targets the disease from within the plant’s vascular system, helping to cure the infected grapevine and stopping the spread to surrounding vines.

Pierce’s Disease is caused by the bacterium Xylella fastidiosa, which is spread by xylem-feeding leafhoppers known as sharpshooters. In California, the invasive glassy winged sharpshooter spread the disease beginning in the 1980s. Infection by this bacterium causes several important, often fatal plant diseases in California, including Pierce’s Disease in grapes, alfalfa dwarf and almond leaf scorch.

The bacterium works by blocking the xylem, which conducts the water around the plant. Symptoms include chlorosis and scorching of leaves, and entire vines will die after one to five years.

The work to develop a bacteriophage treatment for Pierce’s Disease was led by Carlos Gonzalez, plant pathology and microbiology professor at Texas A&M. He is a member of the AgriLife Center for Phage Technology and collaborated with Otsuka Pharmaceutical Co. in developing the treatment.

The treatment has been approved by the U.S. Environmental Protection Agency with the commercial name XylPhi-PDTM, and is registered with the California and Arizona Departments of Pesticide Regulation. It is also OMRI-listed and approved for use in organic production. Wilbur-Ellis is the distributor for this product and their advisors work with crop consultants.

“The development of this first-ever bacteriophage treatment for Pierce’s Disease is a significant step for the agricultural industry,” Gonzalez said. “We’ve proven that we’re able to develop a treatment, manufacture the product and put it into large-scale production, and develop it to a point where it’s been approved by the EPA as a treatment for Pierce’s Disease.”

At a virtual field day held in northern California at the end of the 2020 crops season, efficacy data from vineyard trials for XylPhi-PD were shared. After two seasons of use, it reduced Pierce’s Disease by nearly 60% in high-disease-pressure vineyards.

High Alfalfa Yields Influence IPM

0
Choosing an alfalfa variety for its resistance traits ensures a good stand for the life of an alfalfa field (photo by D. Putnam.)

High yields in an alfalfa variety are positively correlated with weed, insect and disease resistance.

At a recent UC Alfalfa & Forage Virtual Field Day, Dan Putnam, statewide alfalfa & forage extension specialist, explained why alfalfa variety selection plays an important role in integrated pest management.

With high yields, Putnam explained, comes vigorous regrowth that suppresses weeds. Persistence in a variety means that plants can recover from insect pressure. Choosing an alfalfa variety for its resistance traits ensures a good stand for the life of an alfalfa field.

Taking into account the growing region where alfalfa is planted, Putnam stressed that yield performance should be the deciding factor in variety selection. Varieties may look similar in the field, but over the life span of an alfalfa stand, yield differences and return on investment can be significant. Yield differences can also overcome higher seed prices for high-yielding varieties.

“Always look at performance first, not the price of seed,” Putnam said.

Alfalfa varieties have been developed for different growing regions. Dormancy type should be matched with the specific growing region. A UC Davis website lists the regions and varieties developed for each.

Putnam said a high fall dormancy score for a variety equals higher yields. Alfalfa forage quality is higher in varieties with low dormancy scores.

When it comes to pest and disease resistance, Putnam explained that it is not always absolute as high numbers of pest or significant disease pressure can overwhelm even highly resistant varieties. Using highly resistant varieties does not negate other management, including monitoring, spray timing and beneficial insects.

A variety that is listed as highly resistant to a pest or disease means that at least 50% of the plants in a stand will survive. Since alfalfa plant numbers are so high, Putnam said 80% of seedlings can be lost and the stand will be viable.

In regions where aphid complex, stem nematode, fusarium wilt and Phytopthora are significant challenges to a healthy alfalfa stand, growers should choose highly resistant varieties.

Key points of alfalfa variety selection include performance, choosing a fall dormancy rating appropriate to the growing region and prioritizing pest resistance traits for specific sites. Growers should also consider biotech traits when making variety choices.

Where there is a yield/quality tradeoff in an alfalfa variety, Putnam said that in the current alfalfa market, yield is currently the most important consideration.

Hull Split Monitoring is Crucial to NOW Control

0
Timing of hull split can vary depending on weather and variety. The almond industry’s leading variety, Nonpareil, typically splits in early to mid-July (photo by C. Parsons.)

Hull split in almond signals that it is time to apply treatments to control navel orangeworm. This timing is critical. Split hulls release a scent that attracts female NOW moths who lay their eggs on the suture of the splitting hull. Fungal spores can also invade the almond hull at split and cause hull rot.

In an Almond Board of California Training Tuesday webinar, almond experts recommended tree inspections starting at the top of the canopy on the southwest corner to detect onset of hull split.

Almond hulls split as the fruit ripens. If the entire suture on the hull opens and exposes the shell when the nut is squeezed, hull split has occurred. Timing of hull split can vary depending on weather and variety. The almond industry’s leading variety, Nonpareil, typically splits in early to mid-July.

It is the stage prior to a visible hull split that growers want to catch. When the hull is at the deep “V” stage, susceptibility to NOW infestations and pathogens that cause hull rot increase. Monitoring the crop for this stage is important.

Nuts mature faster at the top of the tree canopy, and that is where monitoring must begin. Using a ladder, lopping off upper branches of smaller trees or even using a pruning tower will allow close inspection of nuts from the top of the canopy to determine their stage of maturity.

Noting any blank nuts, or those lacking a kernel, is important as those are the first to initiate hull split, often several days before sound nuts. Mel Machado, vice president of grower services for Blue Diamond, calls blanks ‘a warning shot’ that alerts growers and farm managers that the hull split is imminent.

Experts advise paying attention to trees on the edge of the orchard as their nuts ripen earlier.

When planning hull split applications, they note that it is better to be early than late. Hull split applications should be made no later than at 1% hull split. That is the most effective time to spray for NOW as the timing often matches initiation of the second flight of NOW.

Machado also advises that once hull split begins, the entire orchard should be sprayed in five days or less. Since nuts at the tops of the trees are most vulnerable, consideration of aerial applications should be made to achieve best coverage. The best time to spray is early morning or at dusk.

Leaf Sampling to Detect HLB

0
Citrus leaf samples can be tested to positively identify Huanglongbing infection in a tree (photo courtesy S. Hajeri.)

Citrus Research Board reports that in addition to visual inspections, regular treatments and scouting for Asian Citrus Psyllids, growers are conducting routine testing of leaf samples to positively identify Huanglongbing (HLB) infection in a tree. The testing involves direct detection of the bacteria that causes HLB.

CDFA has provided leaf collection and handling protocols. They include a visual assessment of each tree to be sampled and looking for known HLB symptoms. Searching for and collecting symptomatic leaves when possible is recommended. If yellow shoot symptoms are present, 12 leaves from that branch should be collected. The petiole must be attached to the selected leaves. If yellow shoot symptoms are not present, the entire tree should be inspected for other HLB symptoms, including leaf mottling, twisted leaf ACP damage and vein thickening.

Next, the tree should be divided into four quadrants (north, south, east and west), and four leaves should be collected from each quadrant for one sample. Leaves selected should be young and of medium size, one growth period old and as near to flush as possible.

If no symptoms are present in the tree, select 16 leaves, four from each quadrant, from fully expanded current season flush. Wipe or brush leaves to remove dust and debris and check each sample to ensure there are no thorns and all insects and their life stages are removed.

Next, fold each sample at the mid rib. Wrap the folded bundle of leaves in a dry paper towel and place the sample in a zip-lock plastic bag. The bag should be labeled with the unique sample identifier number, the date collected and the exact location of the host tree, including address, cross street, city and county. The labeled bag should be placed inside another zip-lock bag and placed in an ice chest with blue ice packs to keep the samples cool.

CDFA notes that it is essential to place protective material between the ice packs and samples to ensure they stay dry and do not get freezer burn.

The agency also emphasizes making sure no ACP are with the leaf samples or inside the package.

Growers or orchard managers must mark the trees from which the samples came from for retesting purposes. If any samples test positive for the bacteria, CDFA will be notified and will contact the grower to resample.

Currently, the Citrus Pest Detection Program (CPDP), operated by the Central California Tristeza Eradication Agency, is permitted to provide HLB testing services of plant samples from growers throughout the state, except in HLB quarantine areas, via mail. However, growers located in the San Joaquin Valley can request CPDP representatives take samples from their orchard for testing rather than mailing.

Samples can be sent to the Citrus Pest Detection Program at Attn: PCR Laboratory 22847 Road 140 Tulare, CA 93274. The Tulare laboratory director, Subhas Hajeri, would like to speak with growers or PCAs before they bring samples to the lab. The phone number is (559) 686-4973.

Can Artificial Intelligence Enhance the Profit and Environmental Sustainability of Agriculture?

0

The global population is projected by the United Nations to reach 9.7 billion people by 2050. To satisfy the needs for food and fiber for that many people, agricultural production should increase by >70%. Globally and here in the U.S., studies suggest that improved management of soil resources, irrigation water and nutrients through digital agriculture (See Sidebar Digital Agriculture on page 9.) tools can be the key to increasing agricultural production (Fig. 1). According to USDA, sustaining the economic viability of agriculture is only one of the goals that must be achieved to fully satisfy the long-term food and fiber needs of the American people. Other key goals are to reduce the environmental footprint of agriculture and to improve the quality of life for farm families and communities.

Figure 1: Economic feasibility analysis showing the relative value that agricultural technologies are expected to add to the current global crop production to achieve the United Nation’s 2050 food production goals. Data extracted from Goldman Sachs, July 2016, “Precision Farming: Cheating Malthus with Digital Agriculture”


Improving Production Systems

Agriculture in the Southwestern U.S. is vital to the prosperity of rural communities and the national economy, both for internal consumption and for international export. Many crops are grown in the Southwestern U.S., including field crops and many specialty fruits, vegetables and nuts. In particular, around $12 billion/year in income is generated by agriculture in California’s Salinas River Valley and in the Colorado River Basin, including regions in Southern California that use Colorado River water for irrigation. In these regions, agriculture employs more than 500,000 workers.

Sustaining and improving the agricultural productivity in the region in the long term is, however, under threat as growers face major challenges: climate change, disease and pest outbreaks, increasing salinity and diminished and/or degraded soil and water resources, to mention a few. The region has experienced prolonged and major droughts since 2000, with the possibility of streamflow reductions by more than 50% by 2100. Future requirements to preserve groundwater may remove 500,000 acres from production in California alone. Minimizing salt and nutrient loading is increasingly mandated for effective water reuse. Uncertainty in the water supply in these regions is particularly troublesome, as agriculture there consumes 39% of the U.S. total irrigation water (almost 32 million acre-feet per year.) Additionally, climate change threatens to increase insect, pathogen and weed pressures and geographic distribution, while public interest and increasing on-farm costs push toward reducing pesticide use and organic farming.

Our current understanding of agricultural production systems indicates that Crop Yield is a complex function of Genetics × Environment × Management × Space × Time interactions. Understanding why yield deviates from optimal over space and time in different landscapes is key to adjusting management cost-effectively. When looking at the multi-year productivity of farmland, a rule of thumb might say that yield varies over time in response to climate as much as it changes across different spatial scales (within a field and across multiple fields) due to the variability in soil and landscape features.

Failure to adapt management to the dynamic spatial and temporal variability of crop growth often results in crop loss or over-application of agronomic inputs, which can lead to economic loss and environmental degradation. Real-time crop growth models that can leverage information from very high spatial and temporal resolution satellite imagery and ground networks of sensors, such as weather stations, are great candidates for guiding site-specific tailored agronomic management. Moreover, when combined with artificial intelligence, crop growth models can help improve farm management while considering the tradeoffs between different sustainability aspects at different spatial scales. For example, how to increase field scale profitability while reducing regional-scale environmental impacts.


Current Research

With the overarching goal of increasing agricultural profitability by reducing and optimizing inputs to increase yield and curb losses from abiotic and biotic stressors in the Southwestern U.S., UC Riverside recently started a five-year project on the use of artificial intelligence and big data from high-resolution imagery and ground sensor networks to improve the management of irrigation, fertilization and soil salinity as well as to enable early detection of weeds and pests. The project is led by Elia Scudiero, a professional researcher in UC Riverside’s Department of Environmental Sciences, and includes several co-investigators at UC Riverside and UC ANR, USDA-ARS, University of Arizona, Duke University, Kansas State University and University of Georgia. To accomplish its goal, the project relies on many collaborations with ag tech industry partners, including Planet Labs, Inc. Through the collaboration with Planet Labs, the project investigators will use daily high-resolution (around 12 feet) satellite imagery to monitor crop growth and soil properties.

Some of the artificial intelligence applications that the project will develop, for a variety of crops, include crop inventorying, soil mapping, estimations of crop water use and requirement, estimation of plant and soil nutrient status, analyzing the feasibility and cost-effectiveness of variable-rate fertigation across selected regions in the Southwestern U.S. and detecting weeds and pathogens. In the remainder of this article, we will provide a general overview and some preliminary results from some selected applications: Water use and water requirement estimations, mapping soil salinity with remote sensing and detecting biotic stressors.

Figure 2: Left panel shows the map of evapotranspiration on November 10, 2019 for a selected region near Yuma, Ariz. using Landsat 8 imagery. This map has a red circle that is shown in the panel on the right illustrating evapotranspiration (ET) for the selected point for the season. Vegetation data from Landsat are combined with high-resolution meteorological data to estimate ET on an hourly time basis. The red bars illustrate rain events and the black bar illustrates the amount and timing of irrigation that would be needed to avoid unacceptable soil moisture depletion.


Water Use and Water Requirement Estimations

A key element of this project will be to provide reliable estimates of crop water use and irrigation forecasting at a very high resolution daily. Current remote-sensing-based evapotranspiration models often suffer from infrequent satellite overpasses, which are generally available weekly or every two weeks at the 30- to 100-foot spatial resolution. Such sporadic information is a limitation, especially for vegetable crops, which can have very fast-growing cycles. To overcome this and other limitations, the project is integrating daily meteorological information (from state and federal networks) and high-resolution satellite data from Planet Labs with BAITSSS, an evapotranspiration (ET) computer model developed by Dr. Ramesh Dhungel (a Research Scientist in the project) and colleagues. The current version of BAITSSS leverages information from the Landsat 8 satellite platform (NASA). An example application of the model is shown in Figure 1, where BAITSSS is combined with soil moisture modeling to forecast when irrigation is needed to supply crop water demand.

The project’s lead on water use and requirement estimations, Dr. Ray Anderson (USDA-ARS U.S. Salinity Laboratory, Riverside, Calif.), says that “along with irrigation management, we believe the daily imagery from Planet Labs will allow growers and irrigation managers to see evapotranspiration anomalies within a field. These anomalies could indicate irrigation issues or decreases in plant health due to other abiotic stressors such as salinity or nutrient deficiency. Identification of these anomalies will ensure more efficient field scouting and earlier identification of issues before permanent yield loss occurs.”


Mapping Soil Properties

Accurate knowledge of spatial variability of soil properties, such as texture, hydraulic properties and salinity, is important to best understand the reasons of crop yield spatial variability. Scudiero’s Digital Agronomy Lab at UC Riverside is developing novel tools based on machine learning to automate near-ground sensing of soil properties and remote sensing of soil salinity in irrigated farmland. Soil salinity maps are very useful to inform field-scale irrigation practices (e.g., to calculate the amount of irrigation water needed to avoid harmful accumulation of salts in the soil profile.)

In this project, Scudiero and his team will be using field-scale soil maps of soil salinity collected in the past (since the early 1980s) and throughout the next five years by UC Riverside, the USDA-ARS U.S. Salinity Laboratory, the University of Arizona and other collaborators to generate soil salinity maps for the entire Southwestern U.S. Figure 3 shows the soil salinity map produced for the western San Joaquin Valley by Scudiero and colleagues (see the additional resources section.) In particular, Scudiero’s team will use the ground information to calibrate the Planet Labs time-series imagery to predict soil salinity in the root zone (e.g., the top four feet of the soil profile.) Satellite imagery alone is generally not sufficient to predict soil salinity. Other stressors (water stress, nutrient deficiency) have similar imagery properties to salinity. However, in short periods (two to five years), salinity remains fairly stable throughout the soil profile, contrary to other more transient stressors. Because of these differences in temporal variability between stressors, multi-year time series can be used to detect and map crop health reduction due to soil salinity.

Figure 3: 2013 remote sensing soil salinity (electrical conductivity of a saturated paste extract, ECe) for the zero to four feet soil profile in the western San Joaquin Valley. The map was generated using Landsat imagery with a resolution of about 900×900 ft. Current research is investigating the use of Planet imagery with a resolution of 12×12 ft to generate soil salinity maps across all irrigated farmland in the Southwestern U.S.


Biotic Stress Detection

Within this project, UC Riverside scientists are using smartphone pictures, drone imagery and Planet Labs imagery (20 inch and 12 feet resolution) to develop artificial intelligence classifiers for early biotic stress detection. Figure 4 shows an example of a survey carried out by project collaborators Sonia Rios (UC ANR) and Robert Krueger (USDA-ARS) at UC Riverside’s Coachella Valley Agricultural Research Station in Thermal, Calif. Preliminary analyses show that 20×20-inch resolution imagery from the Planet SkySat satellites can be used to identify the presence of weeds against bare soil ground coverage in citrus and date palm. Single-date imagery cannot be used to successfully distinguish between different weed species. The project investigators hope that repeated satellite imagery, together with drone imagery, will be successful at identifying the emergence and extent of weeds and other biotic stress at the field and farm scales. To develop such tools, project investigators are carrying out controlled experiments at the UC Riverside research farms with controlled weed and pathogen pressures on a variety of vegetable crops.

Figure 4: Planet SkySat imagery from UC Riverside’s Coachella Valley Agricultural Research Station. In panel A, the high-resolution (~20×20-inch resolution) is shown in natural colors and using the Normalized Difference Vegetation Index (NDVI). The different crops present at the site are highlighted in panel A. Panels B, C and D show pictures taken as a ground-truth for the machine-learning weed classifier under development in the project. The project is also collecting imagery from unmanned aerial vehicles (UAV) at selected test sites to detect biotic stress (weeds and pathogens), panel E (photos courtesy R. Krueger (B, C and D) and E. Scudiero (E).)


Training to Growers and Consultants

From conversations with stakeholders in California and other states in the Southwestern U.S., we learned that most growers are committed to maintaining the quality and profitability of soil, water and other natural resources in the long term. Additionally, many growers recognize the potential of integrating digital agriculture technologies in their daily decision-making. Nevertheless, investing in new technology always requires considerable commitment. Therefore, growers would like to have more information on the cost-effectiveness of state-of-the-art technologies and on the suitability of technology to their local agricultural system. To address these and other questions, the project team is establishing a multi-state cooperative extension network to develop training programs for growers and consultants on the topics of precision agriculture, digital agriculture and the use of soil and plant sensors in agriculture. These training activities, scheduled to start in 2021, will include contributions from university personnel and industry members.

This article provided an overview and some preliminary results for the University of California Riverside, or UCR, -led project on “Artificial Intelligence for Sustainable Water, Nutrient, Salinity, and Pest Management in the Western US”. The project is funded by U.S. Department of Agriculture’s National Institute of Food and Agriculture (Grant Number: 2020-69012-31914). Through September 2025, the project will investigate the use of daily high-resolution satellite imagery and data science to identify inefficiencies in agronomic management practices and to support improved irrigation, fertilization and pest control in the irrigated farmland across the Colorado River Basin and Central and Southern California.

Additional information on the project and the content of this article can be requested from Elia Scudiero (elia.scudiero@ucr.edu). Information about the project’s cooperative extension events can be requested from ai4sa@ucr.edu. Further information about research on remote sensing of soil salinity and evapotranspiration can be found in the additional resources section.


Additional Resources:
Dhungel, R., R.G. Allen, R. Trezza, and C.W. Robison. 2016. Evapotranspiration between satellite overpasses: methodology and case study in agricultural dominant semi-arid areas: Time integration of evapotranspiration. Meteorol. Appl. 23(4): 714–730. doi: 10.1002/met.1596.
Scudiero, E., Corwin, D.L., Anderson, R.G., Yemoto, K., Clary, W., Wang, Z.L., Skaggs, T.H., 2017. Remote sensing is a viable tool for mapping soil salinity in agricultural lands. California Agriculture 71, 231-238. doi: 10.3733/ca.2017a0009

Sugarcane Aphid Poses Threat to Forage Sorghum

0
Sugarcane aphid on a forage sorghum leaf. Threshold for treatment is 50 aphids per leaf (photo by Pete Goodell, UC IPM Advisor Emeritus.)

Scouting forage sorghum fields early in the growing season for sugarcane aphid infestations may save considerable crop damage.

UCCE Farm Advisor Nick Clark, in a presentation for the virtual UC Alfalfa and Forage Field Day, said this invasive crop pest reproduces rapidly, and infestations have the potential to cause severe crop damage if not recognized and controlled early.

Dairy producers and those who grow forage crops for dairy silage plant forage sorghum for its drought tolerance and high yields. In 2016, the sugarcane aphid, an invasive pest from Mexico, spread into California forage sorghum fields and caused crop losses.

Sugarcane aphids suck plant juices and excrete honeydew. Their feeding on forage sorghum causes stunting, delayed development, diminished grain production and early senescence. The honeydew causes sooty mold on plants, affecting photosynthesis.

Field trials have shown that early infestation by this pest causes higher yield loss. In 20% of infested fields with no treatment, crop loss of 80% to 100% can be sustained if infestation occurs in the pre-boot stage. Infestation in the boot stage can cause yield loss of 52% to 69%. At panicle emergence, yield loss can be 67%.

Sugarcane aphids can be light green to orange in color. They are distinguished by black antennae, black cornicles and black feet.

Sugarcane aphid infestations are easy to spot, Clark said. Honeydew makes the leaves appear shiny and aphids are easily visible on the leaves. He advised scouting field edges weekly until sugarcane aphid is identified in the field. When sampling, he said to take leaves from plants 50 feet in from the field edge. Pull top and bottom leaves from 15 to 20 plants. The treatment threshold is reached when 25% of the samples have 50 or more aphids per leaf. 50 aphids can cover a dime-size area on the leaf.

Preventative controls for sugarcane aphid include managing Johnsongrass, which can serve as an overwintering host to sugarcane aphid, planting the forage sorghum crop as early as possible, keeping plants healthy and vigorous and using neonicotinoid-treated seed.

If chemical control is necessary, an aphid-specific treatment recommendation is flupyradifurone (Sivanto) in a water volume high enough for good foliar coverage.

Clark noted that growing populations of natural enemies including parasitoid wasps have been observed to control sugarcane aphid, but not always prevent crop damage.

Managing Risk of Smoke Taint in Vineyards

0
In winegrape production, wildfire smoke reduces the amount of sunlight reaching the vines, increasing their stress level and affecting fruit quality. Smoke taint can alter flavor of grapes (photo by Jack Kelly Clark, UC IPM.)

Crop S.A.F.E. is a new tool developed to help wine grape growers manage risk from smoke taint due to wild fires and help protect workers.

Wildfires are an annual threat to fruit, vegetable and other crops grown where wind, high temperatures and smoke are present.

Smoke And Fire Events (S.A.F.E.) platform provides remote intelligence to enable informed crop management decisions during wildfire season. UPL, in collaboration with 6th Grain Corporations, a digital agriculture technology company, is introducing Crop S.A.F.E. as an online application for growers and crop managers.

In grape production, wildfire smoke reduces the amount of sunlight reaching the vines, increasing the stress level and affecting fruit quality. Smoke taint can alter flavor of grapes.

Molly E. Brown, chief science officer with 6th Grain, explains that Crop S.A.F.E. provides growers and managers with more in-depth information about smoke than what they might obtain from weather reports. The information can allow them to determine management for vineyards and reduce concentration of smoke-related aromas, flavors and compounds in the final wine product.

Examples of management strategies to prevent smoke taint, Brown explained, include washing canopy leaves after a smoke event to remove ash. A grower or manager could also choose to hand-harvest a vineyard to minimize skin breakage or rupturing for as long as possible or to harvest earlier to reduce smoke exposure.

The system can also provide regional information about smoke impacts in other areas and states. Brown said knowing how many days a particular vineyard or area has been exposed to smoke throughout the year is a critical part of determining wine quality in the coming year.

In addition, this tool helps keep workers as well as managers in the field safe from smoke exposure and breathing difficulties.

Crop S.A.F.E. uses Aerosol Optical Depth from NOAA to estimate the intensity of smoke exposure accumulated over time. The satellite-sourced map shows regions with high accumulated risk of smoke taint for grapes and other produce as well as field activities. The online resource estimates the intensity of smoke and other atmospheric hazards such as ozone and particulate matter levels plus temperature history.

Brown reports that merging information on field management with satellite observations of weather, crop extent and crop health allows growers and managers to plan to avoid negative impacts of smoke taint.

“By knowing the level of exposure to smoke and avoiding working in high smoke areas, workers can reduce risk of breathing difficulties,” Brown said.

Carrot Trials Target Water, Nitrogen Efficiency

0
Field trial at the UC Desert Research and Extension Center studied water and nitrogen efficiency in carrot production, comparing sprinkler and furrow irrigation and managing N applications (photo by A. Montazar.)

Trials conducted at the UC Desert Research and Extension Center and several commercial fields in Holtville are focused on best irrigation and nitrogen management in carrots. One of the major commodities grown in Imperial County, carrots are grown on an average of 16,000 acres.

Ali Montazar, UCCE irrigation and water management advisor in Imperial, Riverside and San Diego counties, said nitrogen and irrigation management in carrot production is critical for increasing efficiency in crop production and decreasing costs and nitrate leaching.

In desert carrot production, a common irrigation practice in stand establishment is to sprinkler irrigate the field every other day during the first two to three weeks after seeding. Many fields are furrow irrigated after germination. Montazar said a comparison of applied water and crop water consumption indicates that carrot fields could be over-irrigated during the stand establishment period.

There is a wide range in the length of carrot crop season anywhere from 125 days to 190 days. Montazar said the trials showed that carrot fields may also have variable water requirements due to soil types, early or late planting dates and length of crop season. A peak daily crop water use of 0.21 inches on March 23, 2020 151 days after planting was observed in a fresh market carrot field.

Use of sprinkler irrigation during the critical fruit set period allows for more frequent and lighter water applications than furrow irrigation and helps avoid wet and dry soil cycles which contribute to splitting of roots. Sprinklers also reduce salinity.

Montazar said that given an irrigation system efficiency of 70%, the approximate gross irrigation for carrots in that area is 1.9 to 2.1 acre feet, not including pre-irrigation.

Preliminary results of the trials show a notable amount of N uptake both in the roots and tops at harvest. Nearly 50% of the seasonal N accumulated in the tops and roots at 85 to 90 days after planting when the canopy is fully developed. An effective N application could be splitting N into 10% to 15% at planting, and the remainder through irrigation over the season, completed 15 to 20 days prior to harvest.

Montazar noted that 45% to 55% of total N accumulated in the carrot plants, mainly tops, are left in the field as residual soil N and can be a source of N for the next season.

This project was funded by the CDFA FREP and California Fresh Carrot Advisory Board.

Weeds Compete for Resources, Control Them Early

0
Horseweed infesting a young pistachio orchard can steal water and nutrients from trees and interfere with irrigation efficiency (photo by C. Parsons.)

Weed control in tree nut orchards can be a moving target. New species can be introduced, herbicide application timing varies depending on the weed type and weed species can become resistant.

Many management tools are available for growers and farm managers, but methods of use can vary from year to year and from orchard to orchard.

Weeds affect young orchard growth by competing for water and nutrients. Large weeds can provide habitat for vertebrate pests, insect pests and contribute to the presence of nematodes and disease.

Almond Board of California’s Senior Specialist in Pest Management Drew Wolter said changes in weed populations from year to year, plus new, invasive weed species, challenge tree nut growers every year.

Weather conditions can influence weed populations. Salt or drought tolerance in a weed species allows it to proliferate in those conditions.

Soil texture and organic matter also affect weed populations. Annuals, including Puncture vine and horseweed, and perennials, such as Johnson grass, nutsedge and Bermuda grass, can dominate in lighter textured soils. Heavier soils will host curly dock, field bindweed and dallisgrass.

The UC IPM guidelines report that higher rates of preemergent herbicides may be necessary in clay or clay loam soils to achieve the same level of weed control as a lower rate in lighter soils.

Soil texture and irrigation methods also play a role in weed germination and establishment.

Horseweed, Italian ryegrass and field bindweed are three major weed species that invade tree nut orchards. Palmer amaranth and another amaranth species, such as hempweed, are two newer weeds that can pose challenges to control due to herbicide resistance. This is particularly problematic since there are few products registered for managing weeds in young orchards.

Horseweed’s prolific seed production makes this weed difficult to control. Herbicide control is more effective when this weed is in the rosette stage.

Field bindweed is one of the most difficult weeds to control, Wolter said. Its persistence is due to a vigorous horizontal rhizomatous system that can give rise to new roots and shoots once aboveground vegetative matter is knocked down or when roots are disturbed.

Systemic herbicides, such as glyphosate, should be applied when the plant is in its full bloom stage. During this stage of growth, the roots’ carbohydrate reserves are at their lowest, and the sugars produced in the leaves are being moved downward to the root system.

Italian ryegrass’ genetic diversity makes it difficult to develop a specific management plan. A winter annual, its seeds can germinate year-round in some conditions.

-Advertisement-