


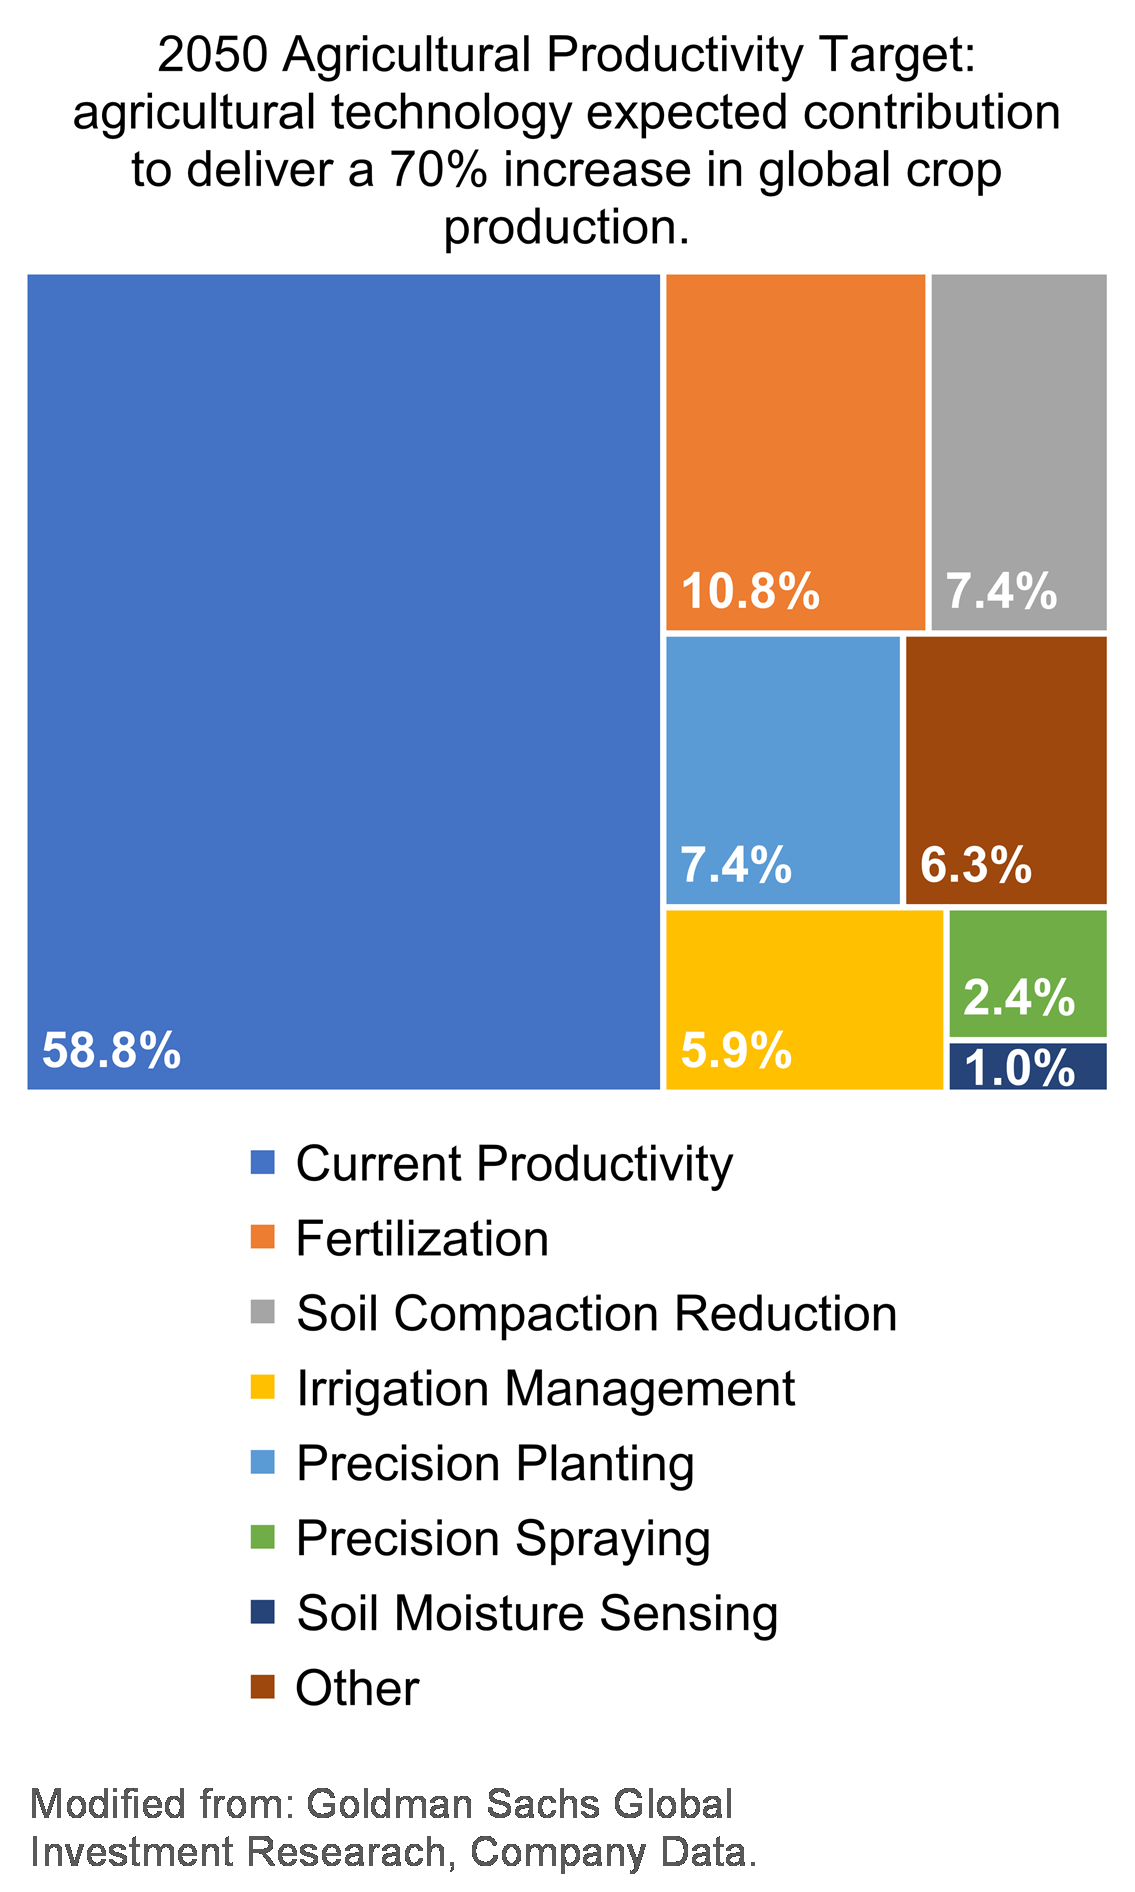
The global population is projected by the United Nations to reach 9.7 billion people by 2050. To satisfy the needs for food and fiber for that many people, agricultural production should increase by >70%. Globally and here in the U.S., studies suggest that improved management of soil resources, irrigation water and nutrients through digital agriculture (See Sidebar Digital Agriculture on page 9.) tools can be the key to increasing agricultural production (Fig. 1). According to USDA, sustaining the economic viability of agriculture is only one of the goals that must be achieved to fully satisfy the long-term food and fiber needs of the American people. Other key goals are to reduce the environmental footprint of agriculture and to improve the quality of life for farm families and communities.
Improving Production Systems
Agriculture in the Southwestern U.S. is vital to the prosperity of rural communities and the national economy, both for internal consumption and for international export. Many crops are grown in the Southwestern U.S., including field crops and many specialty fruits, vegetables and nuts. In particular, around $12 billion/year in income is generated by agriculture in California’s Salinas River Valley and in the Colorado River Basin, including regions in Southern California that use Colorado River water for irrigation. In these regions, agriculture employs more than 500,000 workers.
Sustaining and improving the agricultural productivity in the region in the long term is, however, under threat as growers face major challenges: climate change, disease and pest outbreaks, increasing salinity and diminished and/or degraded soil and water resources, to mention a few. The region has experienced prolonged and major droughts since 2000, with the possibility of streamflow reductions by more than 50% by 2100. Future requirements to preserve groundwater may remove 500,000 acres from production in California alone. Minimizing salt and nutrient loading is increasingly mandated for effective water reuse. Uncertainty in the water supply in these regions is particularly troublesome, as agriculture there consumes 39% of the U.S. total irrigation water (almost 32 million acre-feet per year.) Additionally, climate change threatens to increase insect, pathogen and weed pressures and geographic distribution, while public interest and increasing on-farm costs push toward reducing pesticide use and organic farming.
Our current understanding of agricultural production systems indicates that Crop Yield is a complex function of Genetics × Environment × Management × Space × Time interactions. Understanding why yield deviates from optimal over space and time in different landscapes is key to adjusting management cost-effectively. When looking at the multi-year productivity of farmland, a rule of thumb might say that yield varies over time in response to climate as much as it changes across different spatial scales (within a field and across multiple fields) due to the variability in soil and landscape features.
Failure to adapt management to the dynamic spatial and temporal variability of crop growth often results in crop loss or over-application of agronomic inputs, which can lead to economic loss and environmental degradation. Real-time crop growth models that can leverage information from very high spatial and temporal resolution satellite imagery and ground networks of sensors, such as weather stations, are great candidates for guiding site-specific tailored agronomic management. Moreover, when combined with artificial intelligence, crop growth models can help improve farm management while considering the tradeoffs between different sustainability aspects at different spatial scales. For example, how to increase field scale profitability while reducing regional-scale environmental impacts.
Current Research
With the overarching goal of increasing agricultural profitability by reducing and optimizing inputs to increase yield and curb losses from abiotic and biotic stressors in the Southwestern U.S., UC Riverside recently started a five-year project on the use of artificial intelligence and big data from high-resolution imagery and ground sensor networks to improve the management of irrigation, fertilization and soil salinity as well as to enable early detection of weeds and pests. The project is led by Elia Scudiero, a professional researcher in UC Riverside’s Department of Environmental Sciences, and includes several co-investigators at UC Riverside and UC ANR, USDA-ARS, University of Arizona, Duke University, Kansas State University and University of Georgia. To accomplish its goal, the project relies on many collaborations with ag tech industry partners, including Planet Labs, Inc. Through the collaboration with Planet Labs, the project investigators will use daily high-resolution (around 12 feet) satellite imagery to monitor crop growth and soil properties.
Some of the artificial intelligence applications that the project will develop, for a variety of crops, include crop inventorying, soil mapping, estimations of crop water use and requirement, estimation of plant and soil nutrient status, analyzing the feasibility and cost-effectiveness of variable-rate fertigation across selected regions in the Southwestern U.S. and detecting weeds and pathogens. In the remainder of this article, we will provide a general overview and some preliminary results from some selected applications: Water use and water requirement estimations, mapping soil salinity with remote sensing and detecting biotic stressors.
Water Use and Water Requirement Estimations
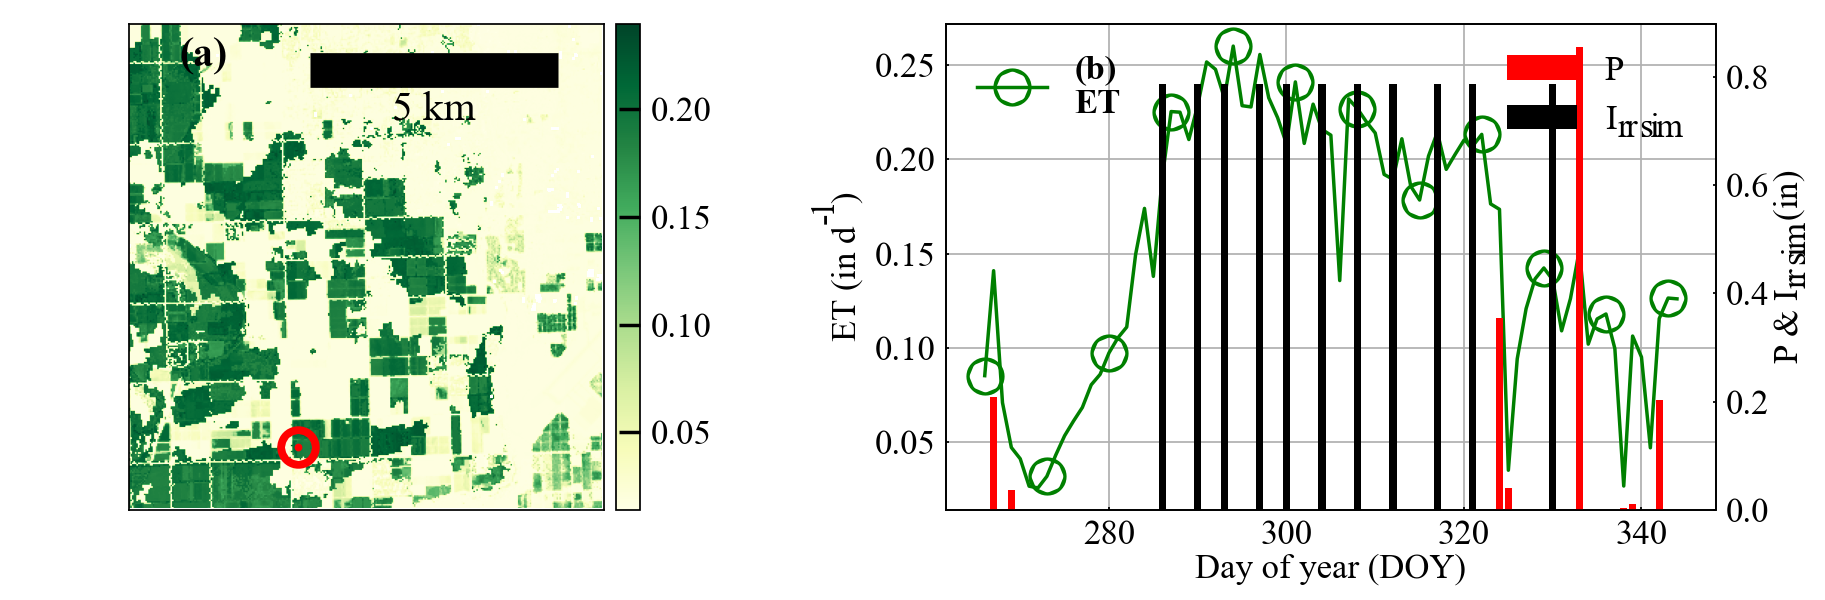
A key element of this project will be to provide reliable estimates of crop water use and irrigation forecasting at a very high resolution daily. Current remote-sensing-based evapotranspiration models often suffer from infrequent satellite overpasses, which are generally available weekly or every two weeks at the 30- to 100-foot spatial resolution. Such sporadic information is a limitation, especially for vegetable crops, which can have very fast-growing cycles. To overcome this and other limitations, the project is integrating daily meteorological information (from state and federal networks) and high-resolution satellite data from Planet Labs with BAITSSS, an evapotranspiration (ET) computer model developed by Dr. Ramesh Dhungel (a Research Scientist in the project) and colleagues. The current version of BAITSSS leverages information from the Landsat 8 satellite platform (NASA). An example application of the model is shown in Figure 1, where BAITSSS is combined with soil moisture modeling to forecast when irrigation is needed to supply crop water demand.
The project’s lead on water use and requirement estimations, Dr. Ray Anderson (USDA-ARS U.S. Salinity Laboratory, Riverside, Calif.), says that “along with irrigation management, we believe the daily imagery from Planet Labs will allow growers and irrigation managers to see evapotranspiration anomalies within a field. These anomalies could indicate irrigation issues or decreases in plant health due to other abiotic stressors such as salinity or nutrient deficiency. Identification of these anomalies will ensure more efficient field scouting and earlier identification of issues before permanent yield loss occurs.”
Mapping Soil Properties
Accurate knowledge of spatial variability of soil properties, such as texture, hydraulic properties and salinity, is important to best understand the reasons of crop yield spatial variability. Scudiero’s Digital Agronomy Lab at UC Riverside is developing novel tools based on machine learning to automate near-ground sensing of soil properties and remote sensing of soil salinity in irrigated farmland. Soil salinity maps are very useful to inform field-scale irrigation practices (e.g., to calculate the amount of irrigation water needed to avoid harmful accumulation of salts in the soil profile.)
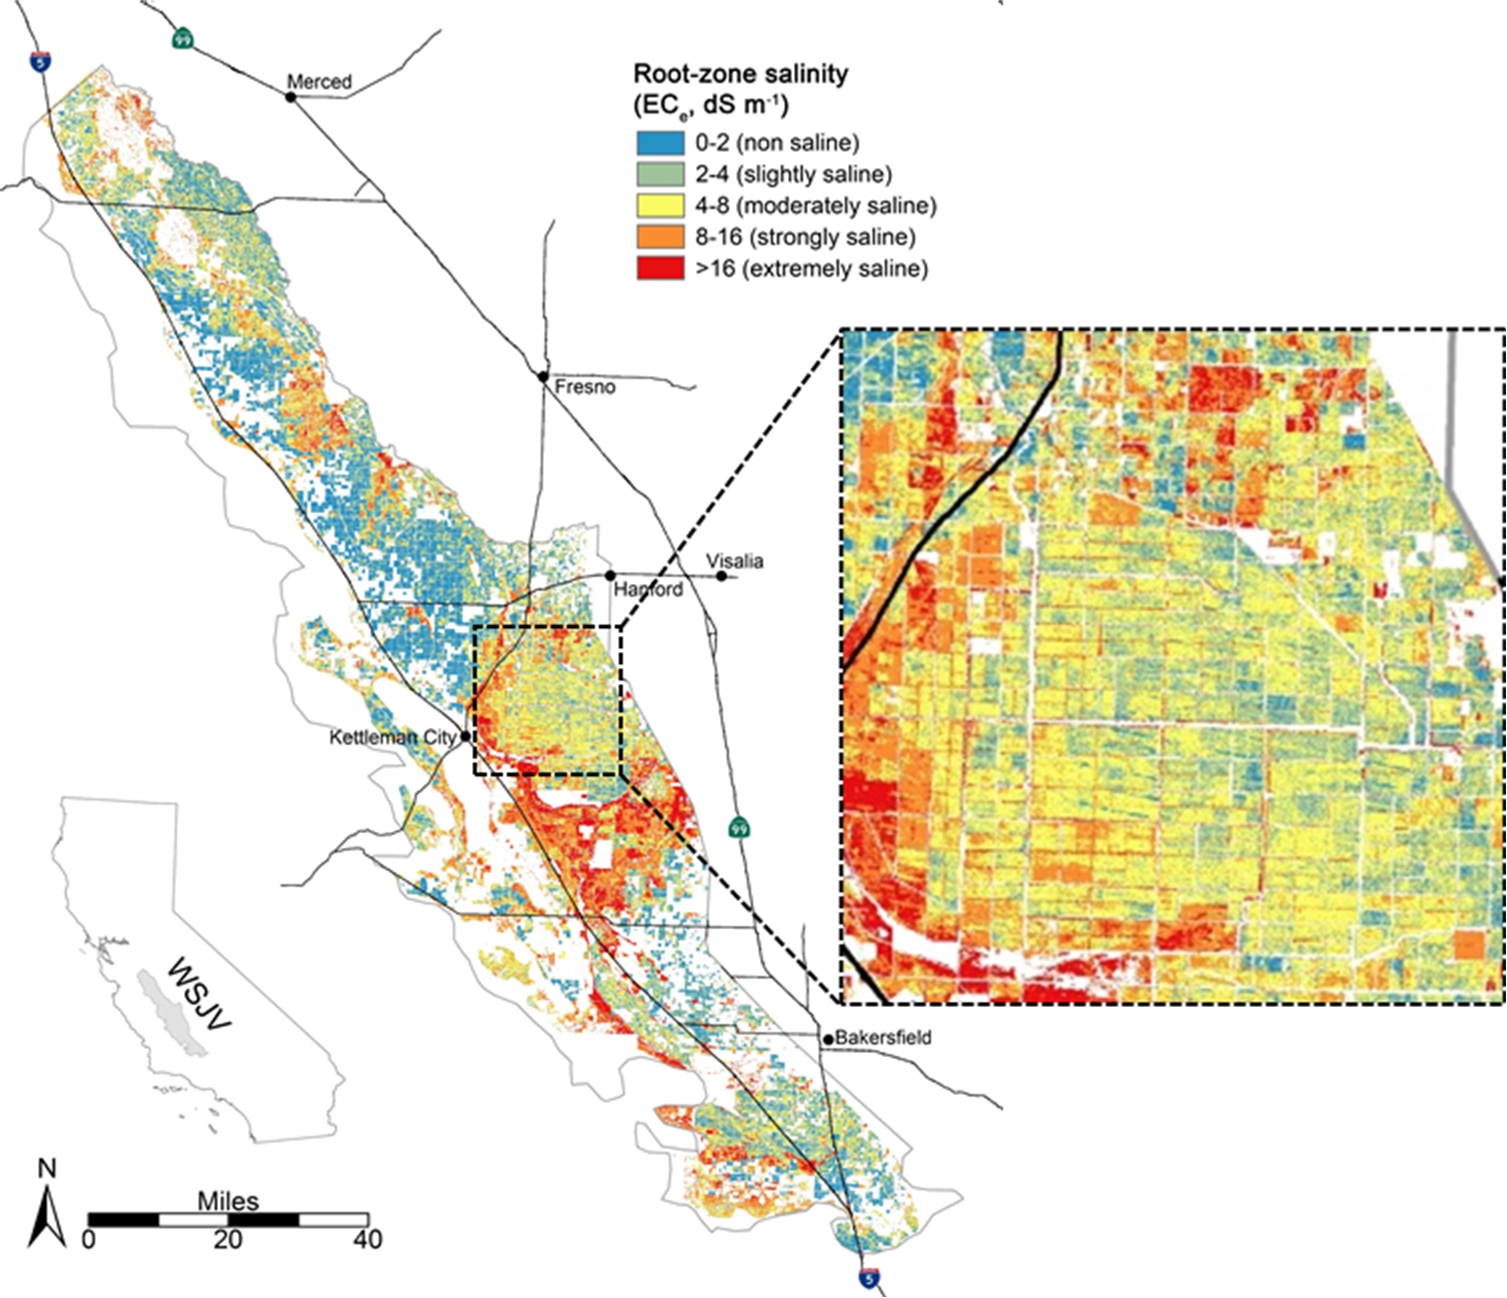
In this project, Scudiero and his team will be using field-scale soil maps of soil salinity collected in the past (since the early 1980s) and throughout the next five years by UC Riverside, the USDA-ARS U.S. Salinity Laboratory, the University of Arizona and other collaborators to generate soil salinity maps for the entire Southwestern U.S. Figure 3 shows the soil salinity map produced for the western San Joaquin Valley by Scudiero and colleagues (see the additional resources section.) In particular, Scudiero’s team will use the ground information to calibrate the Planet Labs time-series imagery to predict soil salinity in the root zone (e.g., the top four feet of the soil profile.) Satellite imagery alone is generally not sufficient to predict soil salinity. Other stressors (water stress, nutrient deficiency) have similar imagery properties to salinity. However, in short periods (two to five years), salinity remains fairly stable throughout the soil profile, contrary to other more transient stressors. Because of these differences in temporal variability between stressors, multi-year time series can be used to detect and map crop health reduction due to soil salinity.
Biotic Stress Detection
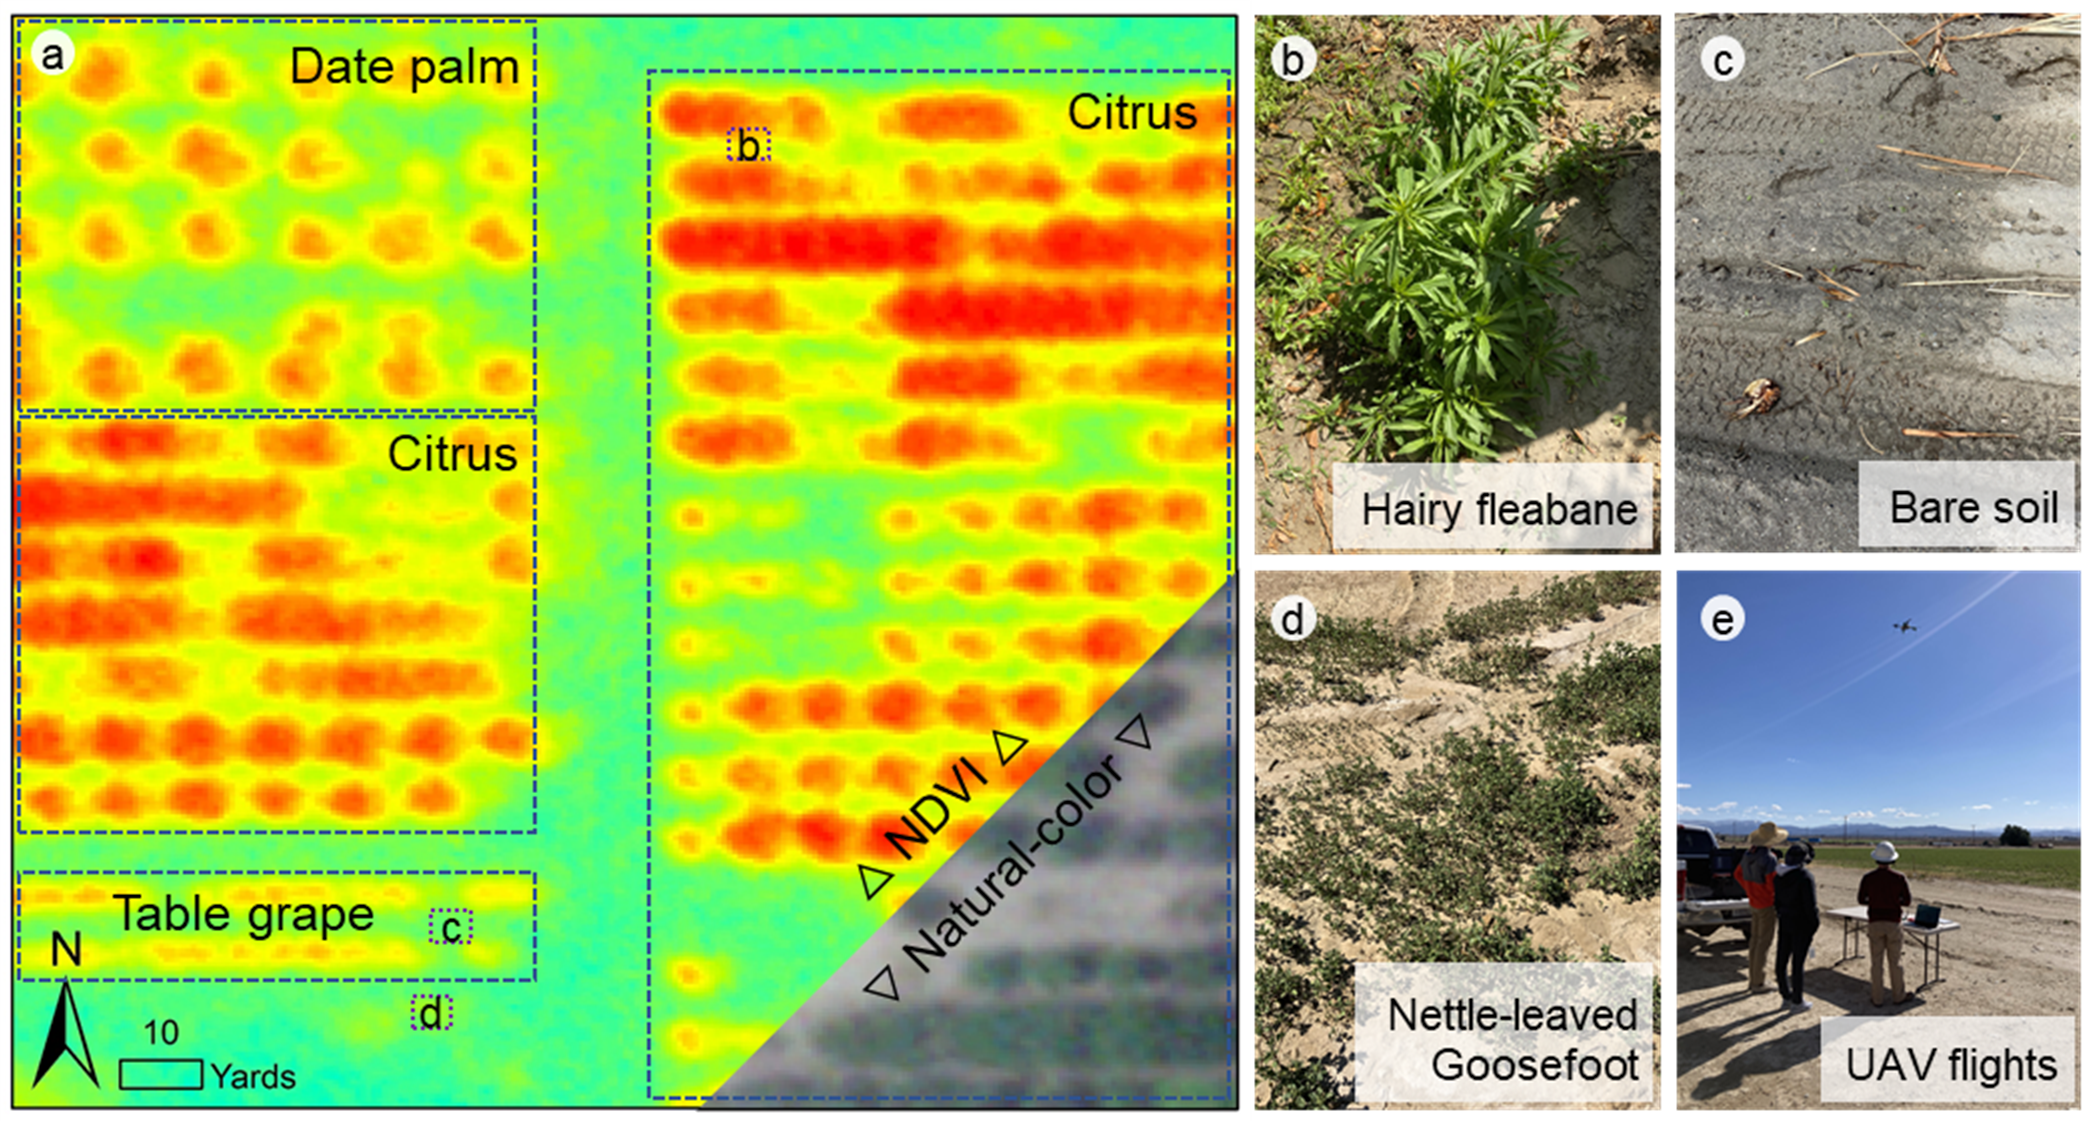
Within this project, UC Riverside scientists are using smartphone pictures, drone imagery and Planet Labs imagery (20 inch and 12 feet resolution) to develop artificial intelligence classifiers for early biotic stress detection. Figure 4 shows an example of a survey carried out by project collaborators Sonia Rios (UC ANR) and Robert Krueger (USDA-ARS) at UC Riverside’s Coachella Valley Agricultural Research Station in Thermal, Calif. Preliminary analyses show that 20×20-inch resolution imagery from the Planet SkySat satellites can be used to identify the presence of weeds against bare soil ground coverage in citrus and date palm. Single-date imagery cannot be used to successfully distinguish between different weed species. The project investigators hope that repeated satellite imagery, together with drone imagery, will be successful at identifying the emergence and extent of weeds and other biotic stress at the field and farm scales. To develop such tools, project investigators are carrying out controlled experiments at the UC Riverside research farms with controlled weed and pathogen pressures on a variety of vegetable crops.
Training to Growers and Consultants
From conversations with stakeholders in California and other states in the Southwestern U.S., we learned that most growers are committed to maintaining the quality and profitability of soil, water and other natural resources in the long term. Additionally, many growers recognize the potential of integrating digital agriculture technologies in their daily decision-making. Nevertheless, investing in new technology always requires considerable commitment. Therefore, growers would like to have more information on the cost-effectiveness of state-of-the-art technologies and on the suitability of technology to their local agricultural system. To address these and other questions, the project team is establishing a multi-state cooperative extension network to develop training programs for growers and consultants on the topics of precision agriculture, digital agriculture and the use of soil and plant sensors in agriculture. These training activities, scheduled to start in 2021, will include contributions from university personnel and industry members.
This article provided an overview and some preliminary results for the University of California Riverside, or UCR, -led project on “Artificial Intelligence for Sustainable Water, Nutrient, Salinity, and Pest Management in the Western US”. The project is funded by U.S. Department of Agriculture’s National Institute of Food and Agriculture (Grant Number: 2020-69012-31914). Through September 2025, the project will investigate the use of daily high-resolution satellite imagery and data science to identify inefficiencies in agronomic management practices and to support improved irrigation, fertilization and pest control in the irrigated farmland across the Colorado River Basin and Central and Southern California.
Additional information on the project and the content of this article can be requested from Elia Scudiero (elia.scudiero@ucr.edu). Information about the project’s cooperative extension events can be requested from ai4sa@ucr.edu. Further information about research on remote sensing of soil salinity and evapotranspiration can be found in the additional resources section.
Additional Resources:
Dhungel, R., R.G. Allen, R. Trezza, and C.W. Robison. 2016. Evapotranspiration between satellite overpasses: methodology and case study in agricultural dominant semi-arid areas: Time integration of evapotranspiration. Meteorol. Appl. 23(4): 714–730. doi: 10.1002/met.1596.
Scudiero, E., Corwin, D.L., Anderson, R.G., Yemoto, K., Clary, W., Wang, Z.L., Skaggs, T.H., 2017. Remote sensing is a viable tool for mapping soil salinity in agricultural lands. California Agriculture 71, 231-238. doi: 10.3733/ca.2017a0009


 Invading California")

