


California fruit growers are concerned with water resource limitations due to increased drought frequency. UCCE and UC researchers are collaborating to address these concerns with science-based methodology to irrigation management. Many growers rely on pressure bomb measurements or crop coefficients from local UCCE offices to decide on irrigation demands of their crop. New technologies for modeling or remote sensing of evapotranspiration estimation are appearing to help navigate careful irrigation management for optimal yields.
Evapotranspiration and Crop Water Status
The losses of water from soil evaporation and plant transpiration combine into a process called evapotranspiration, or crop water demand. These water losses from liquid to gas need to be supplied through irrigation for healthy crops and optimal yield quantity and quality. We have methods that measure in air how much water is being used in agricultural fields. When we use these measurements (called biometeorological measurements) to develop irrigation recommendations, we call it ET-based irrigation. This might be somewhat misleading, because measured ET is not the straightforward quantity to be used. It needs to be increased to compensate for water losses along the irrigation network and make up for sections of the plots under the lower water distribution. If there was a rain event that supplied substantial water to the soil profile, irrigation should be lowered to account for that natural water supply. This makes ET-based irrigation complex to approach when it comes to orchards and vineyards. What makes irrigation decisions even more challenging are many additional factors that increase the uncertainty in developing universal information even within the same perennial crop species. Some of the factors that influence variability in orchard/vineyard ET are crop density, fruit load, trellis system, soil type, crop age, row orientation, regulated deficit irrigation, salinity in soil or irrigation water, floor management, etc. To determine more closely perennial crop water demand, it is recommended in addition to biometeorological measurements we do also plant-based measurements to determine their water status. This helps us inform our measurements with the response of the plant to the meteorological, soil and irrigation conditions. Biometeorological measurements consider the biology of plants and provide information on water use at a landscape scale. Therefore, there is a benefit of independent checking of plant water status with more physiological-based methods like stem water potential (SWP) measurements. In our project, we tried to combine biometeorological approach to ET measurements and add soil moisture and SWP to better interpret the feedback between the soil, plant and atmosphere.
New Crop Coefficients from California Sweet Cherry Orchards
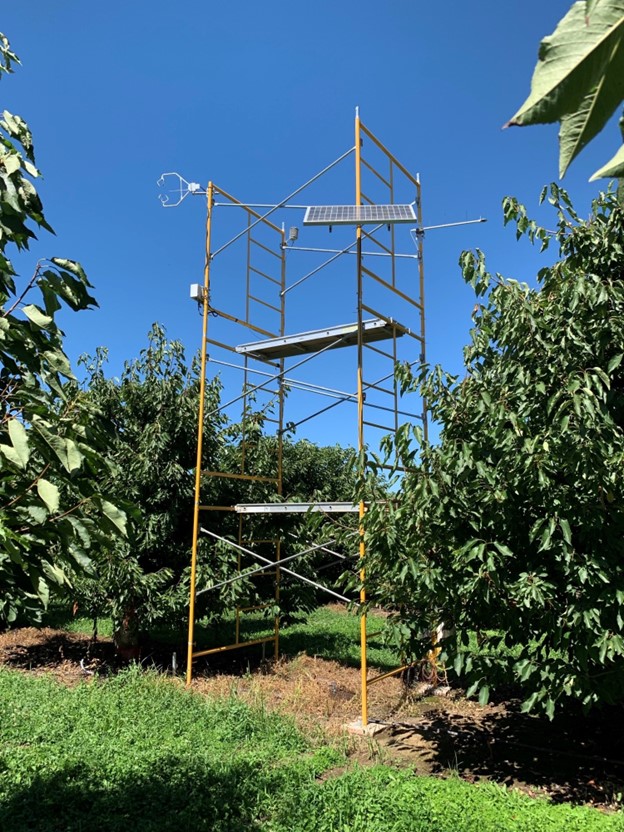
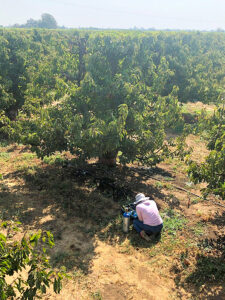
In response to one of the priorities of the sweet cherry industry, and thanks to the support from California Cherry Board, in 2019 we started a project in three sweet cherry orchards in San Joaquin County near Linden, Calif. to determine local irrigation needs for cherries. Our experiment included biometeorological measurements of ET (Fig. 1), pressure chamber measurements of SWP (Fig. 2) and shallow soil moisture. We also reached out to irrigation managers to use their data from neutron probe readings on root zone soil moisture taken manually across several measurement points in each of the orchards. The experiment was hosted by the same grower, and the mature sweet cherry orchards were near each other, with the only differences in the three orchards being tree row orientation, tree density (from the densest at 16 ft x 16 ft, the medium sparse at 20 ft x 20 ft and most sparse at 22 ft x 20 ft), rootstock and the irrigation system (the most sparse orchard had sprinklers while the other two were drip irrigated.) Our main goal was to use these measurements to develop crop coefficients (Kc), the universal correction from the reference grass evapotranspiration (ETo) to the crop evapotranspiration (ETc). For that reason, part of the funding was used to install a new weather station over the reference grass near Linden as part of the California Irrigation Management Information System network (cimis.water.ca.gov/) of freely available weather and ETo data. We collected five years of data across the three orchards and used this rich dataset to develop the Kc curve of values as they change over the season and between different hydrological years and orchards.
Regulated Deficit Irrigation in California Sweet Cherry
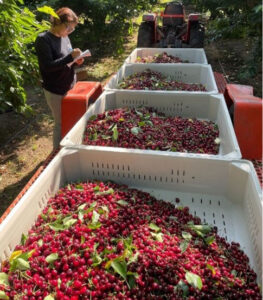
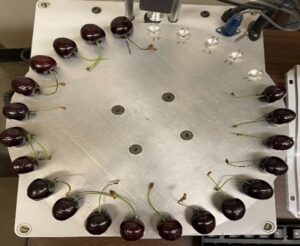
Continued support from the sweet cherry industry helped us establish a new project in 2021 that builds upon the one we started in 2019. Whereas our initial goal was to develop the irrigation recommendations for the fully irrigated orchards, the new project was focused on regulated deficit irrigation. Within the same three orchards where our measurements were already established, we started deficit irrigation in the postharvest period with closing the valves in one of the two driplines. Our monitoring again included SWP to check the water status between the trees that were fully irrigated (control) and those under postharvest deficit irrigation (PDI). To fully evaluate what PDI means for the sweet cherry industry, we collected samples of harvested fruits (Fig. 3) from PDI and control trees and compared the quality and quantity difference in two consecutive years.
Results
We developed a crop coefficient curve for sweet cherry in local California conditions. It relies on daily ETa data for five years and three orchards that are managed for full irrigation. By averaging these 14 curves (we reduced the number of orchards from three to two during the first year of the COVID-19 pandemic) into one, we expected to represent different orchards and hydrological years for universal values to serve as outreach to the local sweet cherry industry. When we model ETc based on Kc values as an outcome of this measurement period, we noticed there was quite a bit of variability between different years and orchards. Therefore, our crop coefficient curve might be close to irrigation needs of sweet cherry but can also under or overestimate the (actual) ETa on a particular day.
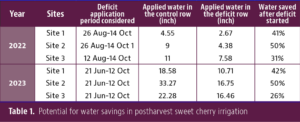
Our exploratory study with PDI shows there is potential for water savings in the postharvest period in sweet cherry (Table 1), between 26% and 50%. Our harvest data analyses show although there were some differences in yield, either increased or decreased yield quantity with the deficit, there was no significant difference between the control and PDI trees in yield and in most of the fruit quality parameters. Some of the differences we observed in fruit quality were not consistent between orchards, or the treatment.
We are developing outreach material for sweet cherry growers to both consider using our newly developed crop coefficient curve and to manage their PDI based on pressure chamber SWP measurements. We think using SWP helps carefully manage the amount of deficit crops are experiencing to reduce potential negative effects on the yield quality or quantity.
Study Limitations
Although we collected large amount of data to develop universal crop coefficient curve for local conditions, it only approximates the particular water use, due to complexity in orchard system water management.
Our results on PDI were very limited in sample size and duration (only two years), and the long-term effects cannot be evaluated based on such a short period of PDI. The sample size we collected was very laborious for the yield quality and quantity evaluation, but the large differences between the trees within the same treatment might mask the significance of the statistical differences.
Please use the information from our website on crop irrigation scheduling, frost protection and similar biometeorological materials at biomet.ucdavis.edu/.


 Invading California")

