Home Blog Page 24

Vine Mealybug Defies Control

1
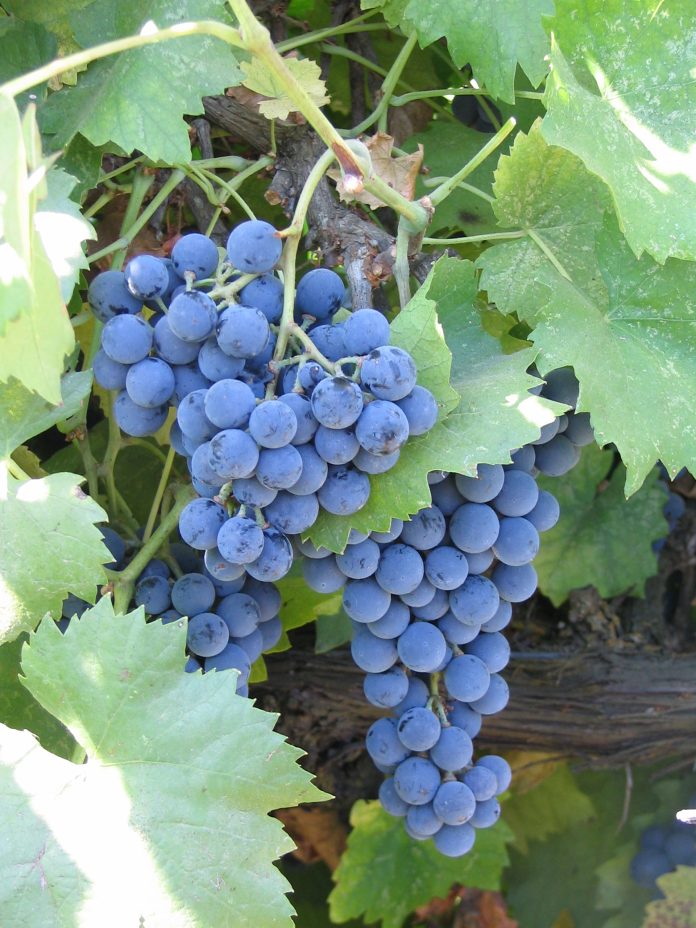
Vine mealybug are the main mealybug species causing economic damage in California vineyards (photo courtesy Stephanie Bolton, Lodi Winegrape Commission.)

Control of vine mealybug (VMB) in grapevine continues to be stymied by this pest’s ability to take refuge underneath bark of the grapevine trunk and below the ground.

Kent Daane, UC pest management specialist, in a presentation for the San Joaquin Valley Virtual Grape Symposium, explained how VMB infestations persist in spite of insecticide applications and healthy parasitoid populations.

Daane said VMB is the worst invasive mealybug species due to its potential for causing extensive crop damage. Highly prolific and present year round in most California grape growing regions, VMB produces copious amounts of honeydew, causing vine defoliation and making fruit clusters unmarketable. VMB is also known to transmit viruses.

Vine trunks, roots and canes all provide protection for VMB from contact insecticides and natural enemies. In addition, ants drawn by honeydew will tend mealybug, kill parasites and remove honeydew from VMB hiding places. Knockdown of VMB on leaves with newer systemic materials can be achieved, Daane said, but population densities make complete control difficult.

Mating disruption may help control VMB, but the populations that persist under the bark remain an issue.

Trials using organic production approved materials showed they were only effective on contact, leaving the population hidden under the bark and below ground to grow.

In the San Joaquin Valley, systemic insecticides Movento and Applaud were effective on exposed areas of the vines, but left the hidden population. Daane explained that VMB infestations are clumped in that they start small in a few places that are difficult to find. It may be more cost-effective to spot spray where an infestation is found rather than treating an entire block.

Parasitoids have provided some control, but mainly on exposed areas. They cannot parasitize VMB under bark and can be killed by ants. Ants in vineyards aid VMB by not only removing honeydew, but making underground habitat available during periods of high temperatures.

There are strategies being developed to reach VMB populations under bark of the trunk and underground, Daane said, but they are expensive. Spot spraying of systemic insecticides is one alternative. Girdling the trunks can expose VMB and applications of tanglefoot directly on the exposed population is being studied. Barriers with insecticides placed around the trunk have also been tried to slow the movement of crawlers. Flaming the bark is another control tactic that is being studied.

Another study is the use of nematodes to impact VMB populations on the roots.

Managing Soil and Structure Quality

1
Figure 1: Holistic management tools that help improve soil structure and soil quality includes physical and chemical controls (Part I in this article series) and biological controls (Part 2).

You may have heard or read about improving your soil health or soil quality over the last year as this area of field management gains more attention. But what exactly do the terms mean and how can you incorporate the concepts in your day-to-day soil management practices? In Part 1 of this article series, the physical and chemical connection to optimizing soil quality by focusing on the structure of your soil will be explored.


Soil Quality and Health

Soil quality has broad application to your farm. It refers to how well a soil functions physically, chemically and biologically and how well it does its “job” (Fig. 1, page 6). For example, a forest soil has a different job than a farm soil, and soil properties can be measured on how well the soil is performing (e.g. soil structure).

Many factors influence the soil quality on a farm and are summed up in Figure 2, on page 7. In this article, the focus will be on the physical and chemical management practices that maximize soil quality, expressed here as soil structure (Fig. 3).

Soil health refers to the interaction between organisms and their environment in a soil ecosystem concept and the properties provided by such interactions (e.g. ecosystem stability). When you think of soil health, think of the biological integrity of your field (e.g. microbial population and diversity) and a focus on supporting plant growth. This will be the focus of Part 2 of this article series.

Poor soil structure and the resulting decrease in soil quality continues to impact yields in many farming areas. This is because many factors can negatively impact soil structure, including soil compaction from field equipment, poor salinity management, rainfall and irrigation droplets, excessive tillage, etc. Fortunately, fields that have poor structure (see Fig. 3 for a visual reference) can be fixed once you determine what is causing the issue. I strongly recommend that you put your field detective hat on and work with your favorite Certified Crop Adviser (CCA) to diagnose why your field is not performing as expected.

Figure 2: Crop productivity is influenced by several interrelated concepts, which have an impact on the soil quality of a field (courtesy K. Wyant.)


Physical Controls

Physical and chemical management strategies are important to help reverse poor soil structure and thus improve the overall soil quality of your field.

The physical controls on soil structure generally relate to reducing disturbance to the soil and protecting the soil from future disturbance. With this broad mandate, there are a variety of techniques out there to accomplish this goal and help restore soil structure, but reducing tillage and incorporating cover crops into the growing operation are the most important.


Tillage Practices and Soil Structure

Field activities like tillage are crucial for any successful growing season, whether in the short term or long term. However, excessive tillage can be hard on your soil structure as common implements can slice, compact or crush soil aggregates and quickly change a soil from having excellent tilth (see right side of Fig. 3) to one that lacks those properties (see left side of Fig. 3). The physical destruction of aggregates can have an immediate impact on your soil quality and can impact your operation’s bottom line. Fortunately, there are many modern options for avoiding excessive tillage, including conservation tillage and residue management, strip tillage and even a complete elimination of the practice (no-till). Every operation is different, and changes in tillage need to take local growing practices into account before moving forward. Reducing tillage has been shown to improve soil structure and soil quality; however, pulling it off can be tricky. It is worth noting that some tillage can be beneficial (e.g. deep ripping of hard pans) but should be employed only when necessary to help avoid impacts on soil structure.


Cover Crops

This concept is related to keeping the soil covered and physically protected from disturbance into the future after the crop is planted. The cover crop, usually grown in between the rows of permanent crops (e.g. trees and vines) or in the ‘off-season’ for annual crops, can be used to shield the soil from wind and water erosion and also help open up soils that have a history of poor soil structure. Briefly, the canopy of a cover crop can intercept and slow the velocity of raindrops and break up wind gusts, which helps keep soil on the field.

Belowground, the root systems of cover crops can poke through clods and hard pans and help open up channels in the soil profile to help move water downward into the profile. Fine root hairs can also tie soil particles together, improving soil structure and quality.

Please contact your preferred CCA for more advice on tillage practices and cover crop selection and to see if it fits into your farming operation.

Figure 3: The soil on the left has poor soil structure while the soil on the right has excellent aggregation and structure. As a result, the two fields have substantial differences in soil quality and their ability to support
optimized crop growth (photo courtesy K. Wyant.)


Chemical Controls

A common issue in fields that have poor soil structure and soil quality is related to a chemical relationship in the soil. A loss of soil structure due to a mismatch between soil structure, calcium and other elements is called deflocculation. Under normal conditions, soil particles with ample calcium naturally come together to form aggregates, which improves soil structure. When the calcium is displaced by other ions (e.g. sodium), the soil structure collapses, and soil quality can quickly deteriorate. One of the main goals of a chemical remediation program is to provide more calcium to the soil, thus reversing the collapse in soil structure and driving an improvement in soil quality. The question is, “Which calcium amendment do I use?”

I cannot stress enough the need to start your program with a soil sample and to utilize the experienced advice from a CCA. Taking a soil sample will help you figure out the following important parameters critical to your chemical program: 1) Which amendment to use (e.g. gypsum, lime, sulfur product); and 2) Dosage of correct amendment to apply.

Critical parameters on the soil report worth looking at are soil pH, fizz test results, EC (dS/m), SAR, sodium and chloride results. For example, the fizz test measures the amount of free lime in a soil (CaCO3), and this is either expressed qualitatively (low, high, etc.) or quantitatively (%). There are a few major bulk calcium amendments that are available to help restore your soil structure: lime, gypsum and sulfur products.

Lime
Lime (CaCO3) is commonly used in soils that are acidic with soil structural issues and should not be confused with ‘free lime’ that shows up on a soil test report. Lime can provide a calcium source while also neutralizing acidic soil pH. Thus, soil quality can be improved on two separate fronts (soil structure and soil pH) with one program. Calculating the liming rate for a field (lbs/acre) can be tricky since you have to factor in both the amount of calcium needed to fix your soil structure problem and the amount needed to adjust the pH. A good soil sample and an experienced CCA can help determine the optimum rate for your field.

Gypsum
Gypsum (CaSO4) is a calcium amendment when one has low or very low fizz test readings. This is one reason why I recommend that you start your program with a soil test. When gypsum dissolves, it can supply calcium directly to the soil, which improves soil structure and allows excess salts (e.g. sodium) to drain. However, unlike lime and sulfur products, gypsum will have little impact on soil pH and should only be used to provide calcium to help restore soil structure and soil quality. An experienced CCA can help interpret your soil test and provide a reasonable gypsum recommendation (lbs/acre) to fix the issue.

Sulfur Products
Sulfur products, such as sulfuric acid and elemental sulfur, require the presence of free lime in the soil (CaCO3). As such, soils that have medium to very high fizz test ratings are a great candidate for the use of sulfur products in your chemical reclamation program. Briefly, sulfur products react with the free lime in the soil to create gypsum as a by-product. The calcium in the gypsum is then able to go to work to improve soil structure. One advantage of using sulfur products is that you generally do not need as much material to get the job done as you do with gypsum (1 ton gypsum = 0.57 tons sulfuric acid = 0.19 tons elemental sulfur), which can impact field logistics and application costs.

Also, repeated applications of sulfur products can reduce problematic soil pH areas by moving the soil pH from alkaline to neutral. One disadvantage to using sulfur products is that they have several reaction steps that can slow the reclamation speed of the field relative to lime and gypsum. Also, sulfuric acid products present some safety concerns that must be considered from a worker safety and transport level. Like lime and gypsum, an experienced CCA can help interpret your soil test and provide a reasonable recommendation (lbs/acre) to fix the issue.


Conclusion

Physical and chemical factors can have a profound impact on your overall soil structure and, thus, the soil quality of your field. Generally, poorly structured soils have a difficult time supporting optimized crop growth due to the severe reduction in water storage capacity, low oxygen, surface crusting and seed bed issues, accumulation of salinity, etc. If your soil looks like the example on the left side of Figure 3, it may be well worth your time and money to start implementing soil improvement practices as outlined in this article. You have a variety of management options, including the implementation of practices that improve the physical components of soil quality (e.g. tillage reduction and use of cover crops) or the chemical components such as adding bulk calcium amendments to your program. A bit of detective work beforehand determining why your field is having a soil structure problem can pay off in turning your field around and using your input dollars most effectively.

In Part 2 of this article series, we explore the biological components that influence soil structure and soil health. We will define soil health and go through plenty of examples on how the living component of a soil can impact your soil structure and overall soil quality. Furthermore, we will discuss how to test for soil health in the field.


Suggested Reading

Dr. Karl Wyant currently serves as the Vice President of Ag Science at Heliae© Agriculture where he oversees the internal and external PhycoTerra® trials, assists with building regenerative agriculture implementation and oversees agronomy training. Prior to Heliae Agriculture, Dr. Wyant worked as a field agronomist for a major ag retailer serving the California and Arizona growing regions. To learn more about the future of soil health and regenerative agriculture, you can follow his webinar and blog series at PhycoTerra.com.

Soil Application of Fungicides in Strawberry

0
Botrytis gray mold in trials at the UC Shafter Research Station (all photos by S. Dara.)

Strawberry is a high-value specialty crop in California and is susceptible to multiple pathogens that infect roots, crowns, foliage, flowers and fruits. Verticillium wilt caused by Verticillium dahliae, Fusarium wilt caused by Fusarium oxysporum f. sp. fragariae and Macrophomina crown rot or charcoal rot caused by Macrophomina phaseolina are major soilborne diseases that cause significant losses if they were not controlled effectively. Chemical fumigation, crop rotation with broccoli, nutrient and irrigation management to minimize plant stress and non-chemical soil disinfestation are usual control strategies for these diseases. Botrytis fruit rot or gray mold caused by Botrytis cineaea is a common flower and fruit disease requiring frequent fungicidal applications. Propagules of gray mold fungus survive in the soil and infect flowers and fruits. A study was conducted to evaluate the impact of drip application of various fungicides on improving strawberry health and enhancing fruit yields.

Propagules of gray mold fungus survive in the soil and infect flowers and fruits.


Methodology

This study was conducted in an experimental strawberry field at the Shafter Research Station in fall-planted strawberry during 2019-2020. Cultivar San Andreas was planted on October 28, 2019. No pre-plant fertilizer application was made in this non-fumigated field which had Fusarium wilt, Macrophomina crown rot and Botrytis fruit rot in the previous year’s strawberry planting.

Both soilborne diseases were present throughout the field during late spring 2019 with symptoms of wilt or crown rot appearing in many plants. In the current study, each treatment was applied to a 300-foot-long bed with single drip tape in the center and two rows of strawberry plants. Sprinkler irrigation was provided immediately after planting along with drip irrigation, which was provided one or more times weekly as needed for the rest of the experimental period.

Each bed was divided into six 30-foot-long plots, representing replications, with an 18-foot buffer in between. Between November 6, 2019 and May 9, 2020, 1.88 qt of 20-10-0 (a combination of 32-0-0 urea ammonium nitrate and 10-34-0 ammonium phosphate) and 1.32 qt of potassium thiosulfate w ere applied 20 times at weekly intervals through fertigation. Treatments were applied either as a transplant dip or through the drip system using a Dosatron fertilizer injector (model number D14MZ2). The following treatments were evaluated in this study:

  1. Untreated control: Neither transplants nor the planted crop was treated with any fungicides.
  2. Abound transplant dip: Transplants were dipped in 7 fl oz of Abound (azoxystrobin) fungicide in 100 gal of water for four minutes immediately prior to planting. Transplant dip in a fungicide is practiced by several growers to protect the crop from fungal diseases.
  3. Rhyme: Applied Rhyme (flutriafol) at 7 fl oz/ac immediately after and 30, 60 and 90 days after planting through the drip system.
  4. Velum Prime with Switch: Applied Velum Prime (fluopyram) at 6.5 fl oz/ac 14 and 28 days after planting followed by Switch 62.5 WG (cyprodinil + fludioxinil) at 14 oz/ac 42 days after planting through the drip system.
  5. Rhyme with Switch: Four applications of Rhyme at 7 fl oz/ac were made 14, 28, 56, and 70 days after planting with a single application of Switch 62.5 WG 42 days after planting through the drip system.

Parameters observed during the study included leaf chlorophyll and leaf nitrogen (with chlorophyll meter) in February and May; fruit sugar (with refractometer) in May; fruit firmness (with penetrometer) in April and May; severity of gray mold twice in March and once in May; other fruit diseases (mucor fruit rot caused by Mucor spp. and Rhizopus fruit rot caused by Rhizopus spp.) once in May, three and five days after harvest (on a scale of 0 to 4 where 0=no infection; 1=1-25%, 2=26-50%, 3=51-75% and 4=76-100% fungal growth); and fruit yield per plant from 11 weekly harvests between March 11, 2020 and May 14, 2020. Leaf chlorophyll and nitrogen data for the Abound dip treatment were not collected in February. Data were analyzed using analysis of variance in Statistix software and significant means were separated using the Least Significant Difference test.

Fruit yield per plant from 11 weekly harvests between March 11, 2020 and May 14, 2020.

Results and Discussion

Leaf chlorophyll content was significantly higher in plants that received drip application of fungicides compared to untreated plants in February while leaf nitrogen content was significantly higher in the same treatments during the May observation. There were no differences in fruit sugar or average fruit firmness among the treatments.

The average gray mold severity from three harvest dates was low and did not statistically differ among the treatments. However, the severity of other diseases was significantly different among various treatments with the lowest rating in Abound transplant dip on both three and five days after harvest and only three days after harvest in plants that received four applications of Rhyme. Unlike the previous year, visible symptoms of the soilborne diseases were not seen during the study period to evaluate the impact of the treatments. However, there were significant differences among treatments for the marketable fruit yield.

Leaf chlorophyll and nitrogen content between February 4, 2020 and May, 15 2020.

The highest marketable yield was observed in the treatment that received Rhyme and Switch followed by Velum Prime and Switch and Rhyme alone. The lowest fruit yield was observed in Abound dip treatment. Unmarketable fruit (deformed or diseased) yield was similar among the treatments. Compared to the untreated control, Abound dip resulted in 16% less marketable yield and such a negative impact from transplant dip in fungicides has been seen in other studies (Dara and Peck, 2017 and 2018; Dara, 2020). Marketable fruit yield was 4% to 28% higher where fungicides were applied to the soil. Although visible symptoms of soilborne diseases were absent during the study, periodic drip application of the fungicides probably suppressed the fungal inocula and associated stress and might have contributed to increased yields. The direct impact of fungicide treatments on soilborne pathogens was, however, not clear in this study due to the lack of disease symptoms.

Considering the cost of chemical fumigation or soil disinfestation and the environmental impact of chemical fumigation, treating the soil with fungicides can be an economical option if they are effective. While this study presents some preliminary data, additional studies in non-fumigated fields in the presence of pathogens are necessary to consider soil fungicide treatment as a control option.

Marketable fruit yield on various harvest dates. Marketable yield was 4% to 28% higher where fungicides were applied to the soil with the exception of Abound dip, which resulted in 16% less marketable yield.


Acknowledgments

Thanks to FMC for funding this study and Marjan Heidarian Dehkordi and Tamas Zold for their technical assistance.


References

Dara, S. K. 2020. Improving strawberry yields with biostimulants and nutrient supplements: a 2019-2020 study. UCANR eJournal of Entomology and Biologicals. https://ucanr.edu/blogs/blogcore/postdetail.cfm?postnum=43631.

Dara, S. K. and D. Peck. 2017. Evaluating beneficial microbe-based products for their impact on strawberry plant growth, health, and fruit yield. UCANR eJournal of Entomology and Biologicals. https://ucanr.edu/blogs/blogcore/postdetail.cfm?postnum=25122.

Dara, S. K. and D. Peck. 2018. Evaluation of additive, soil amendment, and biostimulant products in Santa Maria strawberry. CAPCA Adviser, 21 (5): 44-50.

Alternative Nematicides for Root-Knot Nematodes in Melons

1
Melon nematicide trial 30 days after transplanting. (all photos courtesy J. Sidhu.)

California is one the largest producers of melons in the U.S., and melons most commonly grown in California are cantaloupes and honeydew types. Although some acreage is reported throughout the state, most are grown in the Southern desert valleys and San Joaquin Valley. Root-knot nematodes (RKN), Meloidogyne spp., are the most significant plant parasitic nematodes affecting melon production in California, especially in light-texture soils. The nematodes are widespread in Central and Southern California.

Damage results from feeding of second stage juveniles (J2) inside melon roots, and the roots respond to nematode invasion by formation of root galls. Nematode-infested plants become stunted and less vigorous with severe galling of roots. Deformed roots due to galls are unable to sustain the water and nutrient needs of the plant in hot weather, leading to wilting and poor growth of plants, reduced yield and poor fruit quality. Nematode-infested plants may also become more vulnerable to other soilborne pathogens.

Currently, there are no resistant cultivars in melons, and RKN management has mainly relied on the use of preplant soil fumigants and soil-applied nematicides. Management with these products is expensive and involves safety and environmental risks. New fumigant regulations by the Department of Pesticide Regulations (DPR) have been put in place to restrict the emissions of volatile organic compounds from the use of soil fumigants. These regulations include limits on the amount of soil fumigants a grower is allowed to use in a year, caps on the amounts allowed within a township and new expanded buffer zones, meaning large parts of a field may not be treated all. These new regulations by DPR may mean that there will be some fields not treated for nematodes because of caps placed on the amount a grower is allowed to use or caps on the amount of fumigants allowed in a township.

Alternative control options that have high efficacy, are economically viable and environmentally safe need to be evaluated under field situations. The goal of this project was to evaluate the efficacy of Salibro, an organic product and a developmental product (DP1) in comparison to Nimitz (fluensulfone) in melons applied through deep-buried drip tube. Nimitz is registered on melons in California.

Root galling at harvest. 1) Untreated control 2) Nimitz 3) Gropro 4) Salibro 5) DP1


2020 Field Trial

This study was conducted as a small plot field trial on our RKN-infested site at the Shafter research farm. A western shipper-type melon variety, ‘Durango’, was hand transplanted onto 60-inch beds on June 30, 2020. There were four replications and five treatments in this trial arranged in a randomized block design. Rates, timings and method of application for each treatment is listed in Table 1, on page 18. Each plot was 20 feet in length with a five-foot buffer between plots along the bed. Treatments were applied either as a pre-plant or post-plant application through buried drip. Before chemigation, water was run for ten minutes to ensure all treatment tubing was filled, and after, chemigation water was run for about 20 minutes to flush the lines. The plots were irrigated using a surface drip and maintained using standard agronomic practices.

Table 1: Treatments, rate/A, application schedule and timings.

Before applying the treatments, soil samples were collected from all plots using a sampling tube at a depth of eight to 10 inches and submitted for analysis to determine the RKN count. Soil samples were collected and analyzed for nematodes again at harvest. Melon roots were evaluated for galling at mid-season and at harvest. Data on nematode counts and root galling was analyzed using SAS (statistical analysis software).


Data and Results

Plant vigor for each plot was rated visually on August 11, 2020 on a scale of 1-5, with 1=worse and 5=best plants. Vigor included the size of the vines and general appearance or health of plants. On the same day, five plants from each plot were randomly selected and visually rated for severity of root galling on a scale of 0-10; (0=no galls, 10=completely galled roots). The average galling on these five plants was used to give a galling index for each plot. The fresh shoot weights of these plants (without fruits) were determined.

At harvest on September 22, 2020, soil samples were collected from each plot for RKN count. All plants in each plot were dug and the severity of root galls on these plants was visually rated on a scale of 0-10 (0=no galls, 10=completely galled roots). The average of the galling on these plants in each plot was used to give a galling index for each plot.

Plant Vigor
No obvious differences were observed in plant vigor among treatments (Table 2). Some plots were a little more vigorous than others, but these differences were not attributed to treatment effect.

Table 2: Mid-season average plant vigor of melon plots in five treatments during the 2020 growing season. Vigor on a scale of 1-5, with 1=worse and 5=best plants.

There were no significant differences observed in fresh shoot weight of melon plants during mid-season evaluation on August 11 (Table 3). However, Nimitz resulted in higher shoot weights than the other treatments.

Table 3: Average plant weight (g±SE) of melon vines in five treatments during the 2020 growing season.

Root Galling
The severity of root galling was assessed at mid-season and at harvest. At mid-season evaluations, root galling was moderate and ranged between 2.4 in the Nimitz treatment and 4.6 in the untreated control (Table 4). Root galling in Nimitz and Gropro treatments was significantly lower than the other treatments. At harvest, there was a little increment in root galling across all treatments, however there were no significant differences among treatments. Surprisingly, Salibro and the developmental product was not beneficial in the trial and had higher root gall ratings than the non-treated control plots at harvest.

Table 4: Average root galling of melon plots in five treatments during the 2020 growing season. Galling on a scale of 0-10 (0=no galls, 10=completely galled roots).


Conclusion

In our 2020 trial, there were some treatment effects on mid-season root galling with Nimitz and the organic product Gropro having statistically lower root galling index compared to other products. However, none of the treatments were significantly different at harvest, and the results indicate that none of the treatments had a long-lasting effect on RKN levels in the soil. Therefore, further evaluations are needed to better determine the efficacy of these products as sole treatments and in combination with other products and their potential and continued use by the melon industry.

This project was funded by the California Melon Research Board.

Pierce’s Disease in Grapevine

0
Pierce’s disease leaf symptoms. Leaf margins turn yellow (or red in red varieties) then burn back from the margins to center in patches (photo by K.T. Lund, UCCE.)

Pierce’s disease is caused by the bacterium Xylella fastidiosa. These bacteria live within xylem, the vascular tissue through which water travels in a plant. As the bacteria population grows, it stimulates the plant to produce tyloses. The combination of bacteria and tyloses cause vessel plugging, which restricts water movement in the plant, thus causing many of the disease symptoms. These blockages will eventually lead to the vine’s death. It is estimated that Pierce’s disease costs the California grape industry $56.1 million a year in lost productivity (Tumber et al., 2014). To minimize losses, it is important to understand the biology of the disease, including the bacteria’s host range, how the bacteria moves from plant to plant, and how to identify infected plants will help growers prevent losses and control the disease.


About the Bacterium

The bacterium X. fastidiosa has a large known host range. The European Food Safety Authority maintains a database of known hosts for X. fastidiosa (their updated list approved in April 2020 can be found at doi.org/10.2903/j.efsa.2020.6114.) Research done throughout California has identified many hosts, including weeds such as shepherd’s purse (Capsella bursa-pastoris), filaree (Erodium spp.), cheeseweed (Malva parvifolia), burclover (Medicago polymorpha) and annual bluegrass (Poa annua) among many others (Shepland et al., 2006 and Costa et al., 2004). Overall, at least 350 host plants have been identified from over 75 plant families as hosts for X. fastidiosa. From a control standpoint, once X. fastidiosa has been introduced to a geographic area, it will be virtually impossible to eliminate it from that location with such a wide variety of possible hosts.

X. fastidiosa does have another level of complexity. To date, four distinct subspecies of X. fastidiosa have been identified. X. fastidiosa ssp. fastidiosa is the subspecies that causes Pierce’s disease in grapevine, while X. fastidiosa ssp. multiplex is the subspecies that causes almond leaf scorch (Rapicavoli et al., 2018). This does mean that almond trees with almond leaf scorch would be unable to be the source of Pierce’s disease in a vineyard. To narrow down the definitive host range, grape-specific PD (X. fastidiosa ssp. fastidiosa) was inoculated into a range of possible host plants using glassy-winged sharpshooters as a vector. After an incubation period, multiple positive ELISA results were obtained for several plants including black mustard (Brassica nigra), black sage (Salvia mellifera), mirror plant (Coprosma repens), Spanish broom (Spartium junceum), Mexican elderberry (Sambucus mexicana), almond (Butte) (Prunus dulcis), white sage (Salvia apiana), sycamore (Platunus racemose) and coast live oak (Quercus agrifolia), confirming that they could host the bacteria (Costa et al., 2004). This does ultimately lower the number of possible plant hosts for X. fastidiosa ssp. fastidiosa; however, it still includes a long list of common plants found in and around vineyards, enough that even including this reduced host list, managing only these species, and other hosts yet to be identified, is still outside the ability in most growing regions.


Insect Vectors

Bacteria within the xylem tissue of one plant may be spread to another plant through the feeding activities of certain xylem-feeding insects. In vineyards, two groups of insects have been identified as possible vectors: sharpshooters and spittlebugs. Spittlebugs have been shown to vector X. fastidiosa in controlled settings, but their importance as a Pierce’s disease vector in vineyards is unclear. Sharpshooters, on the other hand, are known to be effective vectors of Pierce’s disease in vineyards.

There are several different sharpshooters in California that vector X. fastidiosa. The most important of these in the coastal portions of California is the blue-green sharpshooter. This sharpshooter is not adapted to the hotter climate of the San Joaquin Valley (SJV). In the SJV, there are three other sharpshooters: the green sharpshooter (Draeculacephala minerva), the red-headed sharpshooter (Xyphon fulgida) and the glassy-winged sharpshooter (Homalodisca vitripennis).

From left to right: green, red-headed and glassy-winged sharpshooters. Size comparison measurements are in the bottom right of each individual image (photos by Jack K. Clark, Regents of the University of California.)

Green and Red-Headed Sharpshooter
The green sharpshooter and the red-headed sharpshooter are both small and prefer to feed on grasses. The red-headed sharpshooter is specifically drawn to and reproduces on Bermudagrass. Both the green and red-headed sharpshooter can be found in irrigated pastures and along waterways such as streams, creeks, canals and ditches. Neither of these sharpshooters prefers to feed on grapevines, however they may do so under certain conditions and thus transmit Pierce’s disease. Since they don’t prefer grapevines, they tend not to spread deeply into vineyards; thus, when these vectors transmit Xylella, it is usually only to grapevines along the edges of a vineyard, whereas vines in the middle or the sides away from the green or red-headed sharpshooters’ preferred habitat are not affected.

Glassy-Winged Sharpshooter
The glassy-winged sharpshooter is twice the size of either of the other two sharpshooters. Their large size makes them more effective as a vector for Pierce’s disease because they can travel further than smaller sharpshooters and feed more effectively on a wider variety of plants, including woody plants such as grapes. To date, over 350 plants have been identified as hosts of glassy-winged sharp shooter (cdfa.ca.gov/pdcp/Documents/HostListCommon.pdf). Many of the hosts for glassy-winged sharpshooters are also hosts for X. fastidiosa. One of the key hosts for both glassy-winged sharpshooters and X. fastidiosa in the SJV, and for local control of Pierce’s disease, is citrus. The large feeding range of the glassy-winged sharpshooter also means that it can spread the disease throughout the vineyard instead of just to the edges.

The glassy-winged sharpshooter is not a native California insect, only arriving in California in the late 1980s (first recorded in 1989). As this non-native pest is such a dangerous vector, the CDFA tracks their distribution. Most of Kern county, parts of Tulare and Fresno counties, and a very small sliver of Madera county just over the San Joaquin River are all hosts to naturalized populations of glassy-winged sharpshooters within the SJV. In SoCal, Ventura, Los Angeles, Orange, San Bernardino, Riverside and San Diego counties as well as portions of Santa Barbara county and a small section of Imperial county all play host to endemic populations.

CDFA map for April 2020 of glassy-winged sharpshooter distribution in California (photo courtesy CDFA.)

Identification of glassy-winged sharpshooters within and near these areas is important for controlling their spread as well as the spread of Pierce’s disease. At the top, the insect has a deep brown color with creamy white dots on the head and thorax. These colors and dots continue onto the abdomen; however, here they are covered with transparent wings (the source of their glassy name). Highlighting the glassy wings are red lines and patches which can be seen from both the top and side.

The other main identifying mark is the flat white marking along the side of the of the abdomen. When sitting on a stem, this white mark stands out under and through the wings of this sharpshooter. Younger nymph glassy-winger sharpshooters have yet to develop their namesake wings. Their bodies are a lighter grayish-brown with very small white dots. In this stage, the standout feature is their red eyes. The red is the same color that will soon highlight the parent’s wings.

Later-stage nymphs have started to transition to the adult body color, and the red color in the eye is mostly lost. However, the red color has transitioned onto the wing pads in a pattern that has started to develop the adult wing’s patterning.

Images of glassy-winged sharpshooter. A. Top view of adult glassy-winged sharpshooter. B. Side view of adult glassy-winged sharpshooter. C. Top view of young nymph glassy-winged sharpshooter. D. Side view of late-stage glassy-winged sharpshooter (photos by K.T. Lund, UCCE.)


Vector Monitoring and Treatment

Monitoring for glassy-winged sharpshooters can be done using yellow sticky cards. It is recommended to use cards that are at least 5.5” x 9” in size. One card should be placed for every 10 acres and checked weekly for recent activity. Monitoring should be done from budbreak through November. If a glassy-winged sharpshooter is found, and you are outside of a known population center, please contact your local agriculture commissioner’s office or cooperative extension office. Green and red-headed sharpshooters are not attracted to yellow sticky cards, so to monitor their populations you will need to use a sweep net. Sweep lush green grasses near and within your vineyard in April and May to assess population size.

For both green and red-headed sharpshooters, finding two adults in 50 sweeps warrants a response. Unfortunately, as both sharpshooters are only incidentally on grapevines, treating the grapevines will not help the situation. The preferred habitat (lush grassy areas) will need to be addressed. Due to the overlapping generations seen in these sharpshooters, insecticide treatments are often ineffective. Removal of preferred habitat is a more effective treatment option for these sharpshooters.

For glassy-winged sharpshooters, a single find warrants a response. A list of treatment options for glassy-winged sharpshooters can be found on the UC IPM webpage at ipm.ucanr.edu/PMG/r302301711.html. The most common insecticides used for glassy-winged sharpshooter control contain the active ingredient imidacloprid. As with all chemical control, it is important to rotate active ingredients regularly.

Research conducted in 2017 showed that several other insecticides had long-term control of glassy-wing sharpshooters. These included Sivanto (a.i. Flupyradifurone) and Assail (a.i. Acetamiprid), which still showed greater than 90% mortality 7 weeks after application; Actara (a.i. Thiamethoxam), which still showed greater than 90% mortality 5 weeks after application; Harvanta (a.i. Cyclaniliprole), which still showed greater than 90% mortality 4 weeks after application; and Sequoia (a.i. Sulfoxaflor), which still showed greater than 90% mortality 3 weeks after application (Haviland and Rill 2019). This research was conducted in citrus because relying on vineyard-only management is not enough for glassy-winged sharpshooters. With the larger range of the glassy-winged sharpshooter, it is important to focus on an area-wide approach. A pilot program with cooperation between grape and citrus growers has shown great promise in Kern county. Citrus groves are a primary overwintering spot for glassy-winged sharpshooters. When treatments can be applied to these locations, it can lower the number of glassy-winged sharpshooters and, thus, the presence of PD in the area.

Pierce’s disease symptom on shoots. Patchy bark maturation on current year’s shoots leaving green islands (photo by K.T. Lund, UCCE.)


Vine Infections

Early identification of infected vines is the final step in preventing a larger problem from Pierce’s disease. Infected vines can be a source of the disease for vectors to spread to neighboring vines. They are also a strong indicator that the bacteria and a vector are present in your location.

The leaves of infected vines will turn yellow (for green varieties) or red (for red varieties) along the margins. This discoloration will then work inwards from the margin, with the discoloration quickly turning to brown/dried dead tissue. This often happens unevenly or in sections. Shoot tissue also shows an uneven maturation process, leaving green islands within lignified brown tissue.

Affected leaves eventually fall off, but will sometimes leave the petiole still attached to the shoot. Not all these symptoms will be found on every infected vine. If you suspect a vine is infected with Pierce’s disease, you can contact your county’s viticulture advisor for corroboration. Ultimately, a diagnostic analysis is required to confirm the presence of X. fastidiosa in the suspected vine. Table 1 lists laboratories within California that offer Pierce’s disease testing.

Table 1: California Laboratories that offer Pierce’s disease testing.


References

Costa, H. S., Raetz, E., Pinckard, T. R., Gispert, C., Hernandez-Martinez, R., Dumenyo, C. K., and Cooksey, D. A. 2004. Plant hosts of Xylella fastidiosa in and near southern California vineyards. Plant Dis. 88:1255-1261.

Haviland, D. and Rill, S. 2019 Evaluation of glassy-winged sharpshooter mortality following exposure to aged insecticide residues, 2017. Arthropod Management Tests, 44(1), 1–1. doi: 10.1093/amt/tsz075

Rapicavoli, J., Ingel, B., Blanco-Ulate, B. Cantu, D. and Roper, C. 2018. Xylella fastidiosa: an examination of a re-emerging plant pathogen. Mol. Plant Pathol., 19(4), 786–800

Shapland, E. B., Daane, K. M., Yokota, G. Y., Wistrom, C., Connell, J. H., Duncan, R. A., and Viveros, M. A. 2006. Ground vegetation survey for Xylella fastidiosa in California almond or orchards. Plant Dis. 90:905-909.

Tumber, K. P, Alston, J. M, & Fuller, K. 2014. Pierce’s disease costs California $104 million per year. California Agriculture, 68(1-2)

Making Nitrogen & Potassium Fertilizer Decisions in Vineyards

0
Fertilizer label on a storage tank (photo courtesy Jacob Hernandez, JH Ag Consulting.)

The goal of fertilization for any crop is to ensure the optimum levels of nutrients are available to the plant at key stages in the growth cycle. Balancing these factors is an art as well as a science. The first step is identifying what nutrients to apply. The second step is deciding how much fertilizer to apply. The third step is choosing the best time to make the application.


Tissue Analysis

In an ideal world, all of the plant’s needs would be met by nutrients available from the soil. In wine grapes, however, soil tests are not a useful predictor of fertilizer needs as the vine’s uptake of nutrients is affected by soil chemistry such as pH and the dynamics of different soil types. Therefore, tissue analysis in the forms of leaf blade and petiole analysis are required. Tissue should be sampled twice per year. Bloom time petiole analysis describes the vine’s nutritional needs during the growing season. Tissue sampling at early veraison is useful for making decisions about macronutrient adjustments postharvest as nitrogen, phosphorus and potassium are all mobile in the vine between harvest and leaf fall.

Bloom time tissue analysis provides a good picture of shortages in micronutrients such as zinc, magnesium and boron. Leaf blades and petioles are separated and analyzed separately. For bloom time sampling, leaves should be selected opposite the first cluster, ideally at 50% bloom. When sampling at veraison, select the most recently matured leaf — usually the fifth or so leaf from the tip. The most important things to consider are sampling at the same time each year and accurately reflecting variation within the block.

Tissue analysis results need to be interpreted in the context of other information. Are vines exhibiting symptoms of a nutrient deficiency or excess? What is the overall vegetative growth of the vine? Is fruit set less than desired or uneven? Nutrient deficiencies are relatively easy to spot, but not always easy to diagnose. Tissue analysis will identify or confirm what those deficiencies are. Assessing vegetative growth is relatively easy. These data are only meaningful when compared year to year, so several years of data collection may need to be conducted before the relationship between fertilizers applied and their effects can be identified.
Therefore, record keeping is an important part of making fertilizer decisions. Information including tissue analysis and fertilizer applications from previous years provide insight into how in-season and post-season fertilizer applications affected nutrient status over time. Data on pruning weights and estimates of canopy growth at bloom can also show trends suggesting whether too much or too little nitrogen is being supplied.


Fertilizer Rates

As every vineyard and every block within a vineyard is different, the only way to accurately (i.e. efficiently) determine amounts of nutrients to apply is to adjust published ranges for the deficiency or excess of nutrients based on personal experience. Translating tissue analysis results into specific amounts of fertilizer to apply is not an exact science. Differences in soil can have a sizable impact on nutrient uptake and, therefore, fertilizer requirements between areas. Consider flagging rows or using GPS coordinates to sample the same areas. Year to year comparisons will tell you if your fertilizer decisions are accurate and effective.

Nitrogen and potassium are the primary nutrients that need to be supplied with fertilizers, although phosphorus and calcium are also important. Both have downsides if oversupplied, however. Excess N results in excessive growth and overcropping while excess K yields an unacceptably high pH in the juice at harvest. Replacing minerals is very important as they are transported off-site in the crop and not recycled back into the soil like leaves or canes. Every situation is different, but believable ranges are 3 to 5 pounds N, 5 to 8 pounds K, and 1 to 2 pounds Ca are removed from the vineyard each year. Most of these nutrients are taken up by the vine during the postharvest period if they are available.

Grapevines are composed of 1 to 2% N. 30% of N that the vine uses is taken up during the period between harvest and leaf fall. The same is true for K, although the rate of uptake drops off dramatically about a month after harvest. N is an important requirement for the production and function of proteins and is a major component of chlorophyll. Wine grapes will consume 40 to 50 pounds N per acre during the growing season. Much of this will be returned to the soil in the form of prunings and leaves, but the breakdown of pruning wood into bioavailable forms of N takes years, and much may be lost as nitrous oxide during the process. N is released from soil organic matter at the rate of approximately 20 lbs/acre/percent organic matter. Therefore, on soils with less than 2% organic matter, the rate of N provided through fertilization should be increase by 10 to 20%. On soils with greater than 3% organic matter, consider reducing the amount of N delivered. Nitrate levels in irrigation water can be meaningful contributors to total N supplied to the vine. In some areas of California, nitrate levels are high enough that they could be considered fertilizers.

Rates of N application in wine grapes vary from 0 to as much as 60 pounds per acre per year. Making decisions about the rate of nitrogen fertilizer to apply is complicated as excessive applications can result in nitrates leaching into groundwater and/or the generation of the greenhouse gas nitrous oxide. In leaf blades at bloom time, less than ~2% total N is considered deficient. N deficiency is expected with levels less than ~1.5% in leaf blades at veraison.

K uptake is negatively affected by high magnesium in the soil. Therefore, even if K is plentiful in the soil, additional K may need to be provided to avoid deficiency. K levels are deficient below 1% in both petiole and leaf blades during the spring and ~0.7% in the fall. A reasonable target is 2 to 3%.


Timing Application

N may be applied in a split application, with half being applied just after berry set and the other half being applied postharvest. In-season applications of N may not be necessary at all depending on the results of tissue analysis. This is an especially important consideration given that too much N in the vine during the growing season can result in excessive growth, shading inside the canopy and higher disease incidence. To avoid this, spoon feeding vines during the growing season can afford more control.

The goal of postharvest fertilization is to deliver N, K and Ca to the root zone during a time when the vines will take up the nutrient and store them in the trunk so that they are available when the vine breaks dormancy and the demand for these nutrients is the highest. For example, one study found that 50% of N in the canopy comes from N which had been stored in the trunk and roots of the vine. Timing is critical. Too soon and N may kick off a new flush of growth and delay dormancy. Too late and the vine is no longer moving water into the trunk. The canopy needs to be healthy and functional. Hitting this window with late ripening varieties may be difficult, especially if a frost knocks the leaves off. Also, care must be exercised in cold areas because excessive N postharvest can cause hardiness issues. Fertigation is the preferred method of delivering N and K fertilizers as foliar applications can result in an overly rapid uptake. Also, there needs to be sufficient soil moisture for vine roots to take up the elements.

The amount of time required for vines to restore their carbohydrate and mineral reserves varies by crop load. Vineyards with a crop load of 2 to 4 tons per acre need very little time to recover and restore after being harvested. Vineyards in the 4 to 8 tons per acre range require about a month for restoration. Vineyards cropped above eight tons per acre need between 4 and 8 weeks to build their reserves back up.


A Note on Compost

A grower may want to apply compost to their vines for multiple reasons, including delivering nutrients, inoculating the soil with microbes, increasing soil organic matter and improving soil structure. When using compost as a fertilizer, one must know the chemical analysis of the material and take into account the range of nutrients compost will contribute to the vine, including but not limited to P and K. Good quality, finished compost will have a C:N ratio of less than 20:1. Of the total N per ton in the compost, about 30% is available to the vine. Of that, approximately half is available the first year after application, with the remaining N becoming available over the next three to four years.

Although grapevines can survive in depleted soils, maintaining adequate crop loads and vine health requires replacing the elemental nutrients removed in fruit and to account for the long time required to recycle N and K from prunings and leaves back into the soil. A successful fertilization program provides enough of the required elements without producing excessive growth, high juice pH or generating pollution. Scientific data and historical records combined with experience can achieve the goals of the fertilizer program.

Thanks to Dan Rodrigues of Vina Quest LLC for his contribution to this article.

Dormant Season Yield & Disease Management

0
Pruning wound protectant spray after pruning (photo by Dr. Doug Gubler, UCCE.)

Pruning and disease management are important vineyard practices that need attention in the dormant season. Pruning directly affects the upcoming season’s potential yield and quality and can directly and indirectly affect the vineyard’s long-term productivity. Pruning practices, and the care of pruning wounds, can also help manage trunk diseases. Pruning practices that optimize productivity and quality, and protect against trunk disease, will help extend the productive lifespan of vineyards.


Dormant Pruning and Yield Management

Grapevines are pruned for three main reasons:

  1. To keep the vine in a shape that conforms to the trellis system and facilitates vineyard operations.
  2. To remove old wood and retain fruiting canes or spurs for the current season crop, plus spurs for future wood placement.
  3. To select a quantity and quality of fruiting wood that is in balance with vine growth and capacity.

The choice of pruning method is largely influenced by fruitfulness characteristic of vine variety. For instance, most raisin varieties are cane pruned because their basal buds produce shoots with fewer and smaller clusters than apical buds (Fig. 1). In contrast, most wine varieties are spur pruned, since most wine varieties have adequate basal bud fruitfulness and spur pruning is less laborious and costly than cane pruning. However, cane pruning is sometimes preferred for certain wine varieties, like Carmenere, which have low basal bud fertility, or in cool climate regions where cool spring weather might reduce basal bud fruitfulness in other varieties. Understanding the factors determining the bud fruitfulness provides insight as to the best pruning practice for a given vineyard.

Figure 1: Bud fruitfulness from different nod positions on 15-node and 20-node canes of common raisin varieties in California. Figure is elaborated from Cathline et al. 2020. Catalyst: Discovery into Practice. 4: 53-62.

Grapevine yield is formed over a two-year cycle that begins with the initiation of cluster primordia within compound buds. Cluster primordia are initiated in basal buds first, around bloom time, with more apical buds forming cluster primordia in succession, and most buds having formed whatever cluster primordia they will have by veraison (Fig. 2). Sunlight promotes cluster initiation, so sunny, warm weather between bloom and veraison helps maximize cluster primordia formation, whereas cool and cloudy weather can lead to less fruitful buds (Fig. 3). Because basal buds tend to form cluster primordia earlier than the apical buds, spring weather can have a greater impact on the fruitfulness of some varieties than others. For example, cane-pruned varieties initiate cluster primordia over a longer time period than spur-pruned varieties.

Figure 2: Timing of cluster differentiation in the primary bud along one 15-node cane of Thompson Seedless. Figure is elaborated from Williams 2000, Raisin Production Manual (UC ANR Publication 3393).
Figure 3: Bud fruitfulness generally correlates with the light exposure. Note different varieties respond to light exposure differently. Figure is elaborated from Sanchez and Dokoozlian 2005, American Journal of Enology and Viticulture. 56: 319-329.

Raisin growers have long been advised to retain “sun” canes, which generally have more fruitful buds than “shade” canes. Cane and spur morphology can also indicate potential fruitfulness. Mature, round canes and spurs having moderate thickness and internode length are often the most fruitful. Narrow canes and spurs often indicate weak growth with inadequate starch content to support cluster primordia formation. In contrast, exceptionally thick canes with long internodes and a flattened shape, commonly referred to as “bull” canes, may also be expected to have poor fruitfulness. Stressed vines may have insufficient carbohydrate content to support maximum bud fruitfulness. Insufficient water, inadequate nutrition and poorly managed pest or disease issues (e.g. nematodes and powdery mildew) can all stress the vines and reduce bud fruitfulness. As previously mentioned, node position also affects fruitfulness, cluster size and fruit quality of cane-pruned varieties. Leaving longer canes could increase yields if the vines do not become overcropped.

Cluster initiation is generally completed by veraison, so, by late summer, the number of clusters a designated bud may have in the following season has already been determined. Therefore, before pruning, growers can collect and dissect representative buds from a vineyard and observe and count the cluster primordia with the aid of a dissecting microscope. This information may be used to help predict yield potential and adjust their pruning severity to help achieve a desired number of clusters per vine. As growers gain experience with this method, it might also help them adjust their canopy or irrigation management practices to help improve fruitfulness, since shoot exposure to light improves bud fruitfulness.

After a pruning strategy has been decided on, and the vines were pruned, the maximum potential number of clusters per vine has been fixed. One of the main goals of pruning is to retain the optimal number of buds per vine to regulate the crop size. If too many buds are retained after pruning, the vines may become overcropped, leading to poor canopy growth, unripe fruit and possible carry-over effects on the following year, resulting in erratic and delayed budbreak, slow canopy growth and poor yield and fruit quality. In contrast, if too few buds are retained, the vines may be undercropped, resulting in suboptimal yield and excessive canopy growth, which can cause self-shading, reducing fruit quality. Therefore, understanding bud fertility and potential crop load can help inform pruning decisions and thereby optimize yield and quality.


Disease Management

Pruning practices also have implications for grapevine trunk diseases, which can seriously reduce vineyard productivity. Trunk diseases are caused by different fungi including Esca or black measles, Botryosphaeria (Botryosphaeria canker), Eutypa lata (Eutypa dieback) and Phomopsis viticola (Phomopsis cane and leaf spot). All of these fungi can enter the vines through pruning wounds, especially after precipitation. After a fungal infection has been initiated, it grows toward the roots, slowly killing the vascular tissue, decaying the wood and eventually killing the vines. The typical symptoms from trunk-diseased vines are cankers, dead arms and cordons, and trunks, with vines collapsing in a few years. The economic loss can be dramatic, and trunk diseases may significantly reduce the productive life of vineyards.

Top left: Dead arms/cordons on vines with trunk disease. Top right: Botryosphaeria canker on trunk cross section. Bottom left: Esca symptoms on grape leaf. Bottom right: Eutypa dieback symptoms on grape (photos courtesy G. Zhuang.)

Pruning methods can affect the potential disease risk. Cane pruning typically has less trunk disease risk than spur pruning systems since cane pruning leaves fewer pruning wounds than spur pruning. The best mitigation strategy for trunk disease is prevention. Selective pruning, sometime referred to as “vine surgery”, can remove infected wood, sometimes resolving an established infection. However, vine surgery is laborious and will not be effective unless all the diseased wood is removed. Retraining may be needed to replace arms or cordons removed in surgery, and the surgery will result in large, open pruning wounds that could easily become infected if not protected with pruning protectants. The labor cost to renew the cordon or trunk is typically economically prohibitive in the San Joaquin Valley, and it also does not offer the long-term solution, since those fungi can slowly reinfect the vine if complete elimination of diseased wood was not achieved by the vine surgery. The current preventative measures include double pruning or delay pruning, pruning wound protection and vineyard sanitation.

Double pruning or delayed pruning helps prevent the exposure of final pruning wounds until February or March when most rain events finish and weather is warming. Less rain with warm weather helps the vines seal the pruning wounds and prevent the fungi entering through pruning cuts. However, double pruning or delayed pruning does have some barriers for some growers to adopt (e.g. pre-pruner and labor availability). For growers who can adopt it, double pruning or delayed pruning offers an effective way to minimize trunk disease.

Pruning wound protectants (mostly fungicides) are another option when double pruning or delayed pruning is impractical. Dr. Akif Eskalen, UC Davis, has been evaluating different pruning wound protectants in California since 2019, and the results from those trials can be found here: ucanr.edu/sites/eskalenlab/Fruit_Crop_Fungicide_Trials/. Fungicide efficacy is variable, but the application of pruning wound protectants before the rain event can help prevent the fungal infections. However, pruning wound protectants cannot provide complete protection, and we still do not know how long the protection lasts after the spray. More than one spray might be needed if rain events occur more frequently after pruning.

Vineyard sanitation should be also integrated into the trunk disease management plan. Because numerous fruiting bodies can be found on pruning debris left in the vineyard, complete destruction is desirable to reduce the source of inoculum and avoid new infections. An extensive sanitation of the vineyard should be practiced, keeping the inoculum level as low as possible. This can be accomplished by pruning out all diseased wood, removing it from the vineyard and destroying it by burning or burying.

Recently, mechanical pruning has become more popular due to the increased cost and declining availability of farm labor. However, mechanical pruning may leave more than double the number of spurs per vine compared to traditional hand pruning. Delayed pruning or pruning wound protectants should be applied after pruning to reduce the risk of trunk disease. In all, trunk disease does not only affect this year or next year’s yield and general vine health, but also reduces the longevity of vineyard production life.

Weather Station use in Vineyards

0
An anemometer, found at the top of the weather station, measures wind speed and direction and can be placed in or near the vineyard. (all photos courtesy S. Vasquez.)

Talk to a farmer; at some point, the discussion will focus on the weather. It is the number-one topic discussed amongst farmers because weather can impact farming in significant ways. A rain event in June may benefit one crop but negatively impact another. Weather forecasts are important for scheduling farm activities, and for many years, farmers relied on the Farmer’s Almanac for long-range forecast.

Fortunately, today’s California farmers have multiple options to obtain weather forecasts and real-time data to make farming decisions. One of California’s oldest publicly accessible weather networks is the California Irrigation Management Information System (CIMIS). Built to improve irrigation efficacy, UC Davis and the California Department of Water Resources (DWR) established CIMIS in 1982. CIMIS has provided California growers with weather data accessed via the internet at cimis.water.ca.gov/. Growers can select one of the 145 stations near their property, download the data to a computer and manipulate it for their use (e.g. calculating ET). However, todays farmers are busier than ever, and having to rely on downloading climate data throughout the season can be challenging, especially when data from multiple locations are needed or when there are not any CIMIS stations nearby.

Growers can log onto CIMIS once an account has been setup

The CIMIS weather station network has been, and continues to be, a valuable tool for agriculture. But growers and researchers need weather data that better represents their farm or research location. Some of California’s first “local weather stations” used in vineyards were hygrothermographs that recorded temperature and humidity. Several UC grapevine pest and disease models were developed and tested in the late 70s and early 80s using hygrothermographs placed throughout California’s vineyards. However, in the late 80s, hygrothermographs were replaced with weather stations equipped with radio telemetry and controlled by a data-collecting base station. Since then, as technology improved, weather stations have become more sophisticated and provide real-time, on-demand data, 24 hours/day.

Some of the first weather stations recorded temperature, humidity, precipitation and wind speed and direction, displaying the data as graphs that needed some interpretation. Today’s grape growers have access to the same data, but data presentation is clearer with user-friendly web portals and phone and tablet apps. Additionally, climate, environmental and irrigation sensors have been improved or newly developed to generate data that can be used to make farming decisions (e.g. solar radiation, atmospheric pressure, leaf wetness, plant and fruit growth, plant health, soil moisture, electrical conductivity, pH, nitrogen, phosphorus, potassium, microbial activity, water pressure and usage, and more). Having access to numerous types of data allows growers to manage their vineyards in a much different manner than just a decade ago. However, access to that much data can be overwhelming if it is not understood or managed properly. Growers should be trained or have dedicated personnel to help interpret the information and share it with colleagues that will be making farm management decisions.


Some Practical Uses of Vineyard Weather Station Data

Advanced sensor technology has made it easier for growers to install, build, maintain and expand a reliable in-house network of stations collecting different information. Access to local data helps decision-making that impacts crop yield and quality. For example, in addition to knowing how much precipitation a vineyard experienced during a rain event, information such as leaf wetness, relative humidity, soil moisture and wetting depth can help forecast diseases (i.e. bunch rot), future fertilizer and irrigation applications and general vineyard activity that involves tractor work. Combine that information with vineyard characteristics (i.e. variety, soil type, etc.) and suddenly growers can evaluate more acres with fewer vineyard visits that save them time and money. The improved collection and transmission of data from base (aka weather) stations equipped with unique sensors have become valuable tools for managing vineyards. Base stations now incorporate weather, phenological, pest and disease models developed by university researchers to enhance their offerings via portals and apps. The following are some additional applications that can benefit grape growers interested in designing their own network of sensors.
 

Pesticide Applications

Pesticide applications must follow California’s laws and regulations. Prior to any application, climatic conditions must be checked so pesticide applications are optimized. Having a base station within a vineyard can improve pesticide application efficiency and efficacy. An anemometer, which measures wind speed and direction, can help pesticide applicators decide if wind conditions will permit a pesticide application. Wind speeds need to be between 2 to 10 mph to make a legal application. Knowing the wind direction can help decide the potential movement of a pesticide to an undesirable target (i.e. organic field). Tracking vineyard temperature can help determine if temperatures are hot enough to cause spray mist evaporation or phytotoxicity. In that situation, waiting for daytime temperatures to cool or spraying at night could help solve the issue. Being able to check a vineyard’s temperature prior to sending a crew to apply pesticides will save time, money and improve pesticide planning. Temperature sensors can also be used to detect inversion layers that can contribute to pesticide drift. Placing temperature sensors at multiple heights (e.g. 5 feet and 30 feet) will determine if the lower layer is cooler than the upper layer. When this happens, pesticides can move horizontally from thousands of feet to miles from the original point of application. When a vineyard experiences inversion layers, temperature sensors and a base station can detect the scenario and send an alarm to the person planning pesticide applications.
 

Degree Days and Temperature Modeling

Temperature, measured in degree-days (DD), influences grapevine growth throughout the season. From grapevine bud dormancy to fruit maturity, temperature regulates vine and fruit development. DD model predictions can help growers prepare for seasonal cultural practices (i.e. bloom sprays). For grapes, temperatures greater than 50 degrees F have been determined as the developmental DD threshold. In California, Thompson Seedless development as a function of DD has been determined. Approximately 50% bud break for this cultivar is observed when 155 DD are obtained with a February 20th start date. To reach 50% bloom, an additional 741 DD are needed, with maturity reached between 2880-3240 DD. A grower can use this information to track and identify DD specific to the varieties that they grow that have similar growth characteristics to Thompson Seedless. UC has also developed DD models for western grape leafhopper, omnivorous leafroller, powdery mildew and other pests and diseases to help grape growers make management decisions.


Chilling Hours

Grapes require a specific number of chill hours to complete dormancy, break bud and begin a new season. The minimum number of chill hours required for grapes to produce a commercially viable crop averages approximately 150 hours, which is low compared to stone fruit (i.e. cherries, peaches, etc.) that need ≥800 hours. Without adequate chill hour accumulation, bud break and yield become erratic, increasing farming costs significantly. Knowing when chill hour requirements are not being met can help a grower decide when to apply chemicals that improve bud break. A local weather station can better define chill hour accumulation than regional weather data (i.e. CIMIS). Most weather stations can automatically calculate the chill hours and portions. The chill portions algorithm accounts for warmer times of the day and presents a clearer forecast for predicting cold temperature needed for uniform bud break. More information about chill hour accumulation can be found here: fruitsandnuts.ucdavis.edu/Weather_Services/chilling_accumulation_models/about_chilling_units/.


Worker Protection

Worker protection is undoubtedly one of the most important responsibilities a grower has when people are working in the vineyard. Excessive UV or heat exposure can result in chronic and acute health issues. Weather stations not only track and monitor adverse weather conditions, but can also be programmed to send warning emails prior to critical UV or heat events. Since growers must record these events, weather station data is an easy way obtain documentation.

Weather stations have many uses in the vineyard beyond temperature and precipitation. The complexity of the station will depend on a grower’s need. They can generate an enormous amount of data that will need to be interpreted correctly so good decisions can be made. Table 1 shows what types of information can be determined from the different kinds of sensors.

Types of sensors needed to make management decisions.


Selecting a Weather Station that Makes Sense

Purchasing the right weather station will depend on the type of data needed to meet your needs. With multiple weather station options, growers can design a simple or complex weather station network that best suits their farm operation. Working with a weather tech company will help a grower determine their specific needs. After an initial needs assessment, a few follow-up meetings with a vendor will help finetune a weather network design. A 40-acre vineyard might easily be covered by a single station, especially when site characteristics are similar (i.e. climate, soil). However, using a single station to cover a 400-acre vineyard could result in misinterpreted climate data that may vary over a large property. Advancements in communication and sensor technologies now make it possible to have multiple sensors communicate remotely with a base station and have the information organized into an easy-to-read format.


Hardwired vs Solar Panel

The decision to use hardwired or solar power will depend on where the station will be located. Easy access to electricity and/or communication lines is usually the determining factor. Open space near buildings or rooftops are sometimes preferred because electricity is in close proximity. If in-field hardwired installation is preferred, wires placed in conduit to the correct depth and properly wired will be needed to avoid damage or interference with data collection. Solar-powered stations have become more affordable and are also easy to install. Solar panels and batteries will need to be checked and maintained biannually to avoid data collection interruptions. Whichever type you choose, it’s important to avoid installing stations near tall objects (e.g. trees, utility poles, buildings), paved roads or bodies of water because they will interfere with data collection. Poor site selection can result in poor data collection.


Number of Soil Moisture Sensors Per Acre

Temperature, humidity and wind speed and direction are less variable than soil moisture and can be located in one or two areas that represent the property (e.g. pump station). However, the number of soil moisture sensors required per block will depend on how variable the soil texture is. If soil and topography are homogeneous (i.e. uniform), and several blocks have similar characteristics (e.g. cultivar, rootstock, age, irrigation and management), two or three sampling points should be sufficient. Soil moisture measurements should be set at a minimum of one, three and five-foot depths to determine water movement. However, soil moisture sensors can take measurements every foot, which may be needed for certain situations. Additionally, if a vineyard has different types of soils that represent different blocks, multiple soils moisture sensors may be needed to collect accurate data for irrigation scheduling.


Basic vs High-End Stations

All weather stations will provide some type of climate data, but vineyard size (acres), one’s knowledge and confidence in interpreting the data and data access frequency will help you identify they type of weather station that’s right for your operation. A basic station will offer traditional climate data like temperature, humidity and, in some cases, rainfall amounts. In addition to traditional climate information, more sophisticated weather stations will include wind speed, soil moisture, water pressure and amounts, etc. that will result in a lot of data that someone will need to track if weekly decisions are going to be made. It’s important to evaluate the presentation of the data that weather station vendors offer. Portals and apps have simplified the way that growers see and use large amounts of data, which makes it easier for vineyard decisions to be made. If you have a larger operation or want to have a more automated system, a station that is connected to the internet can be a better option. With this station, you will be able to collect the data in real time in the field or remotely. General and more detailed data can be accessed from your computer or phone app. Some manufacturers offer services to set alarms for pest and diseases based on models, degree days and chilling days. The alarms can be sent to your phone via text, email or automated call. Services varies from providers.

General and detailed weather station information from an app.

No matter what type of base station and sensor configuration you choose to purchase, it is important that you first identify what information will help you make better management decisions. Additionally, you should identify someone that will be tasked with monitoring the system and sharing information with farm personnel. This person should be involved in the discussions with the vendor(s) since they will also be in constant contact with the vendor’s customer service representative.

Disease model (left) and degree days threshold option (right).

Biostimulant Regulations Evolving

0
New guidance is being developed for regulating Biostimulants as their use in California crops increases.

Biostimulant products have become widely used in agricultural production, but there are still unresolved issues around definitions, labels and efficacy claims.

Nick Young, senior environmental scientist with CDFA’s Fertilizing Materials Inspection Program, provided an update on biostimulant labeling from a regulatory perspective as part of the UC Ag Experts Talk webinar

The pending USDA definition of a biostimulant is, “a substance, microorganism or mixtures thereof that, when applied to seeds, plants, the rhizosphere, soil or other growth media, act to support a plant’s natural nutrition processes independently of the biostimulant’s nutrient content. The plant biostimulant thereby improves nutrient availability, uptake or use efficiency, tolerance to abiotic stress and consequent growth, development, quality or yield.”

No state fertilizer program currently permits the term “biostimulant” on labeling, Young said, but there are established standards for many biostimulant ingredients and a path to distribution.

Per CDFA requirements, labels for biostimulant products do require that the specific ingredient be named. If the ingredient isn’t recognized, then efficacy data may be required. Recognized ingredients should appear in a guaranteed analysis.

The issue with some biostimulant products, Young said, is that they may be required to have registration both as a fertilizing material and a pesticide. Adding the pesticide label is more costly and time consuming, and manufacturers would rather avoid the pesticide label if possible.

Young noted that just because a product is registered with CDFA as a fertilizing material, that doesn’t preclude CDPR jurisdiction.

An update draft of the Guidance for Plant Regulators and Claims, including Plant Biostimulants, was released in November by EPA, and Young said it has clarified many issues with biostimulants for industry and regulators, but questions still remain.

“It was a step in the right direction and there are a couple of flaws, but it is going to help the industry and regulators know what to do,” Young said.

Claims are a key EPA consideration in determining if a biostimulant is a pesticide. Products that are not considered pesticides are plant nutrients and trace elements, plant inoculants, soil amendments and vitamin-hormone products.

The regulatory approach from CDFA for products that have multiple plant regulator and non-plant regulator modes of action is if it can be demonstrated that a particular product has the activity claims on the product label and does not make any plant regulator claims on the label, it can be excluded from FIFRA regulation.

Update on Sudden Vine Collapse

1
Eskalen noted that sudden vine collapse vines he tested were planted on Freedom rootstock and had presence of vine mealybug as well as girdling at the graft union, lack of starch in the rootstock and lack of feeder roots (photo by A. Eskalen.)

Grapevines can die for a number of reasons, but increasing incidences of Sudden Vine Collapse across all California grape growing regions have sparked investigation into possible causes for this disease.

In the 2020 San Joaquin Valley Virtual Grape Symposium, UC Davis plant pathologist Akif Eskalen shared what he and other researchers know about Sudden Vine Collapse and some management options.

Eskalen said this condition causes sudden death of grapevines in the middle of summer. Sudden Vine Collapse disease has occurred in vineyards in the Lodi and Monterey grape growing regions as well as San Luis Obispo and Santa Barbara counties and San Joaquin Valley counties including Fresno, Tulare and Kern. Similarities in Sudden Vine Collapse include vines planted on Freedom rootstock and the presence of vine mealybug. In his investigation, Eskalen also found symptoms of girdling at the graft union, lack of starch in the rootstock and lack of feeder roots on infected grapevines.

Conclusions from a sampling study done by Eskalen found that in each of the vines with moderate to severe decline symptoms, GLRaV-3 and GVA, grapevine leafroll virus and grapevine virus A were present. Grapevine trunk disease pathogens and Fusarium solani were isolated from the symptomatic grapevine samples, but no consistent fungal pathogen was found among all vine samples.

He also noted that Freedom rootstock is most susceptible to co-infection by grapevine leafroll associated viruses and vitiviruses. Virus infections can also cause graft incompatibility in certain rootstock, Eskalen noted.

Results from the sampling study also showed that efforts of the rootstock to reject the scion following infection causes girdling at the graft union, preventing flow of starch throughout phloem of the vine. The inability of the plant to transport starch leads to starch depletion in the roots and subsequent lack of feeder roots, further preventing the vine to acquire nutrients from the soil. Finally, Eskalen said, interactions between the grapevine viruses and Fusarium solani may play a role in the vine death.

Management options for grape growers, Eskalen advised, include first testing to confirm presence of viruses. Lodi Grape Growers recommends testing both healthy and collapsed vines for common leafroll viruses in California.

Testing in the fall (before the leaves senesce) is the best time of year to sample for these viruses.

Mealybug control in the vineyard is also advised as is removal of infected grapevines.

When replanting, Eskalen recommended using less sensitive rootstocks and continued control of grapevine trunk diseases in the vineyard.

-Advertisement-