


We are blessed in California to have the ability to farm year-round. With over 400 commodities grown here, we are the fifth largest food producer in the world. In 2020, approximately 24,300,000 acres of farm operations were accounted for. Visiting with colleagues and other crop managers and consultants from across the nation, I am aware that agriculture in most states is very seasonal.
Limited crops and short growing seasons allow for agriculture producers to shut down and start thinking about next year’s crops.
Winter months are times to plan, repair equipment, prepare fields for next season and possibly take some time off. Not here in California or parts of Arizona. From October through February, many California and Arizona farmers are planting crops.
No Time Off
Crop planting in October may include crops such as artichoke, fennel, and sweet anise. In November, heavy hitters such as cauliflower and strawberry are started in the coastal areas of California. December brings time to plant asparagus, cabbage, carrot, kale, lettuce (head, leaf, romaine) and the popular spring mix. January, however, unlike much of the nation, brings plantings of bok choy, broccoli, cilantro, endive and escarole, Napa cabbage, onion green, peas, rappini and spinach. And the list goes on through February.
So, what should growers be considering when deciding how, when and where to fertilize these crops? As with all crops at any given time, we need to understand plant nutrition. For annual crops, a plant’s nitrogen requirement is a function of its total N uptake and how efficiently it can access the available N in the soil. The nitrogen use efficiency depends on the crop type, soil type and how well irrigation, N application rates and timing match plant demand. For example, in general, we need to be aware N use efficiency will be lower with flood irrigation, on sandy soils, and when all N fertilizer has to be applied prior to planting. Cold, wet soils will limit availability and uptake by the plant. In today’s climate situation, we need to determine if adequate irrigation water will be available to us.
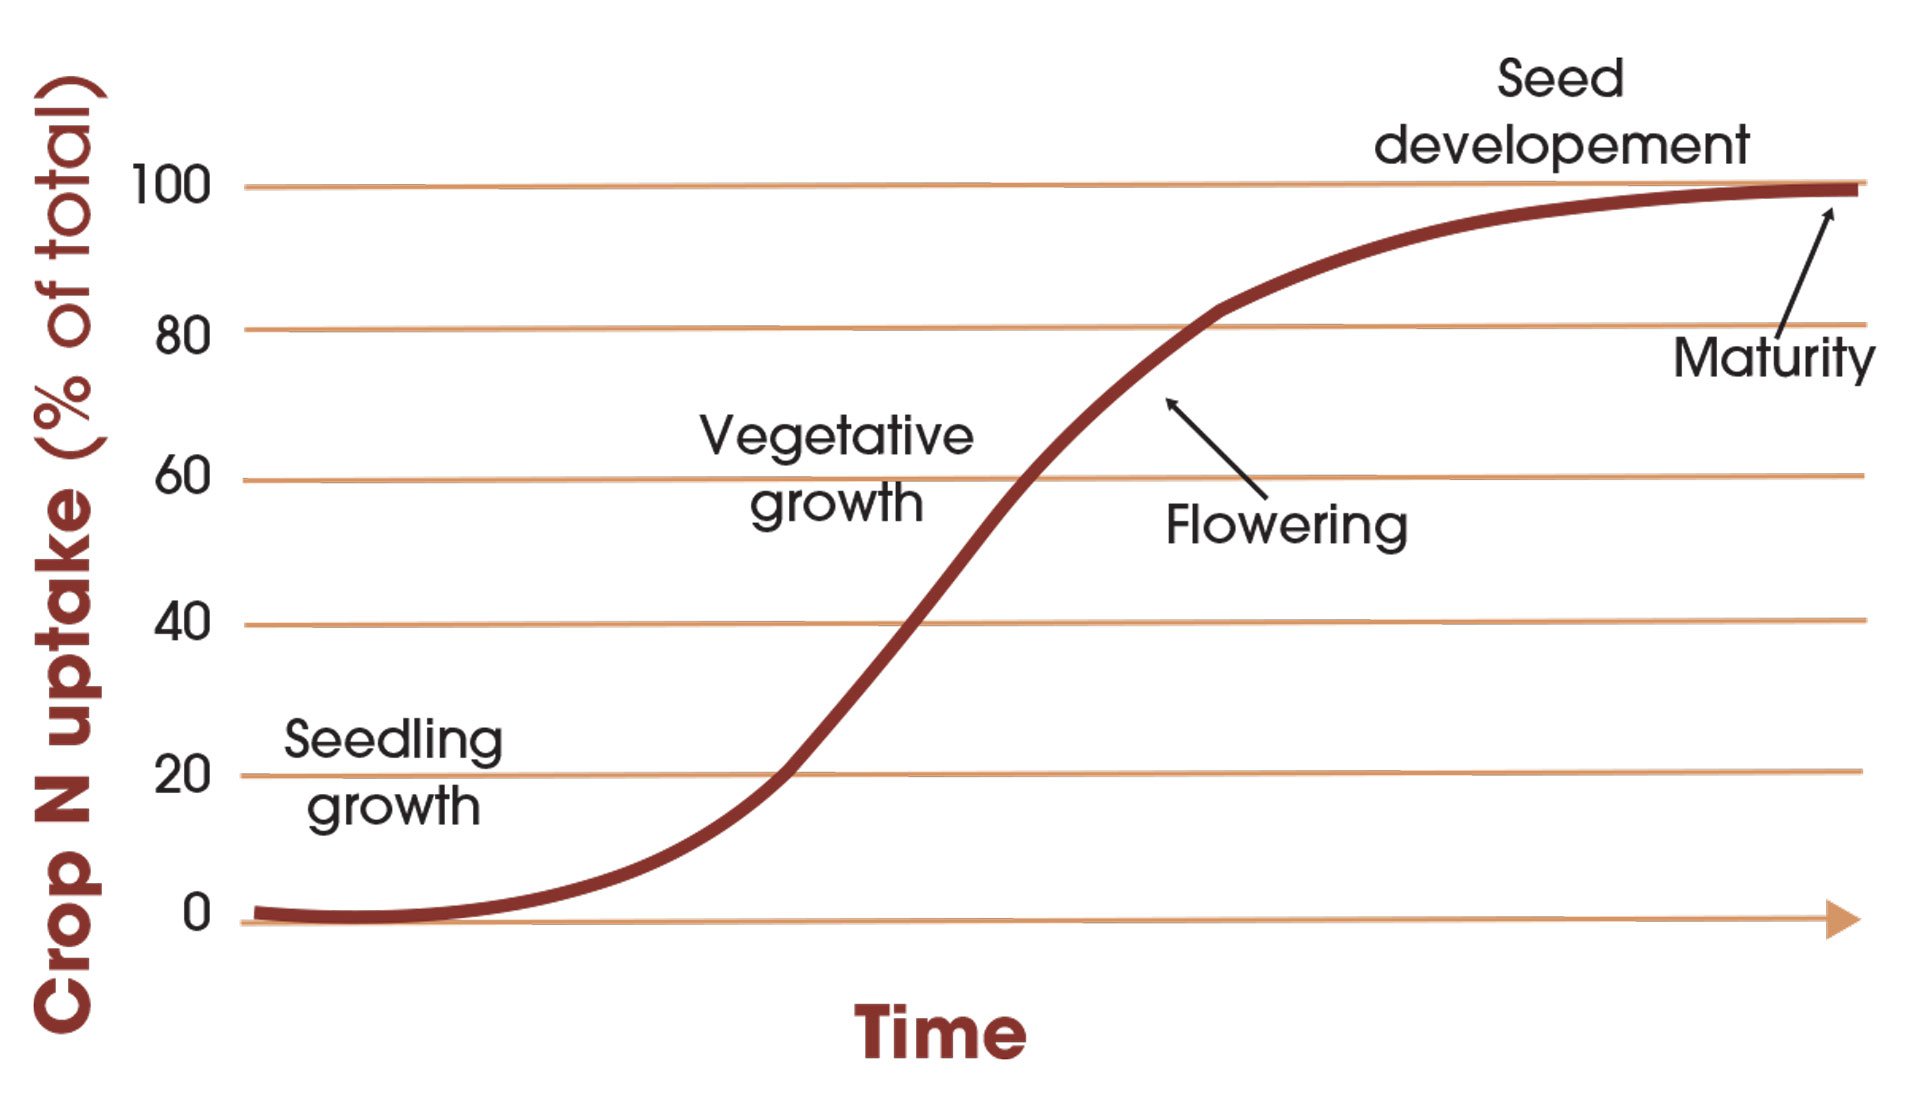
The crops are too numerous to go through detailed plans for every one of them. I am happy to say much of this information is available online through local university sources. Take time to look at what has been done on your individual crops. Some general guidelines on N application to consider: Most times, it is more efficient to split N applications than to apply the whole rate prior to planting. This is because most annual crops have a phase of slow early growth when they take up little N, which is followed by a period of rapid vegetative growth and N uptake. Consider that a small starter application at planting is sufficient to support early growth of many crops. High rates risk being leached during the early season. Side-dressing most or part of the N rate just before the rapid growth phase helps ensure that enough N will be present to meet plant demand.
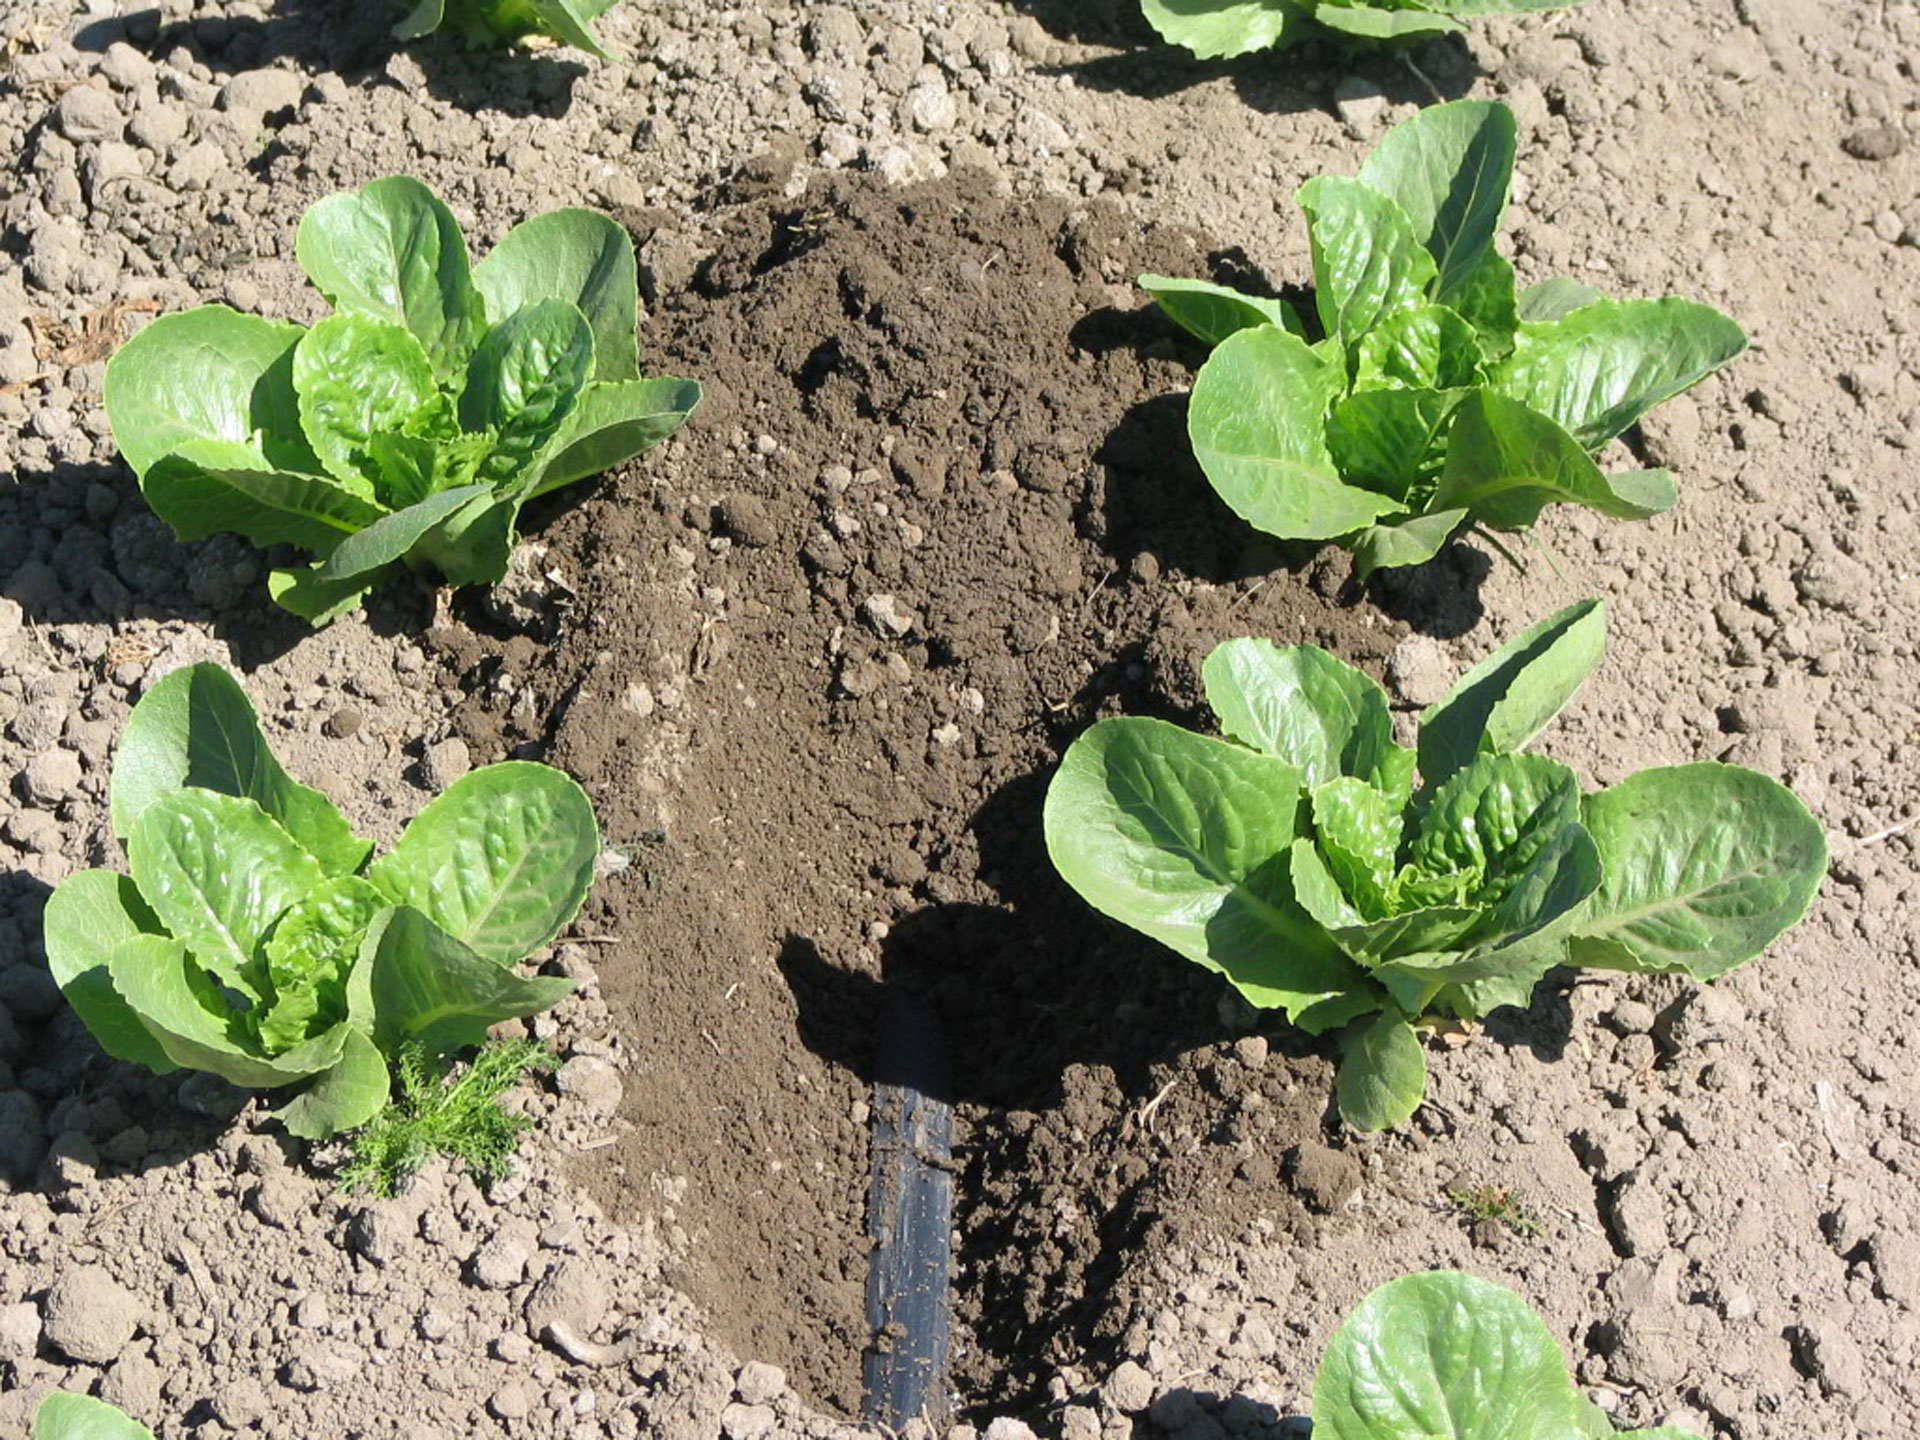
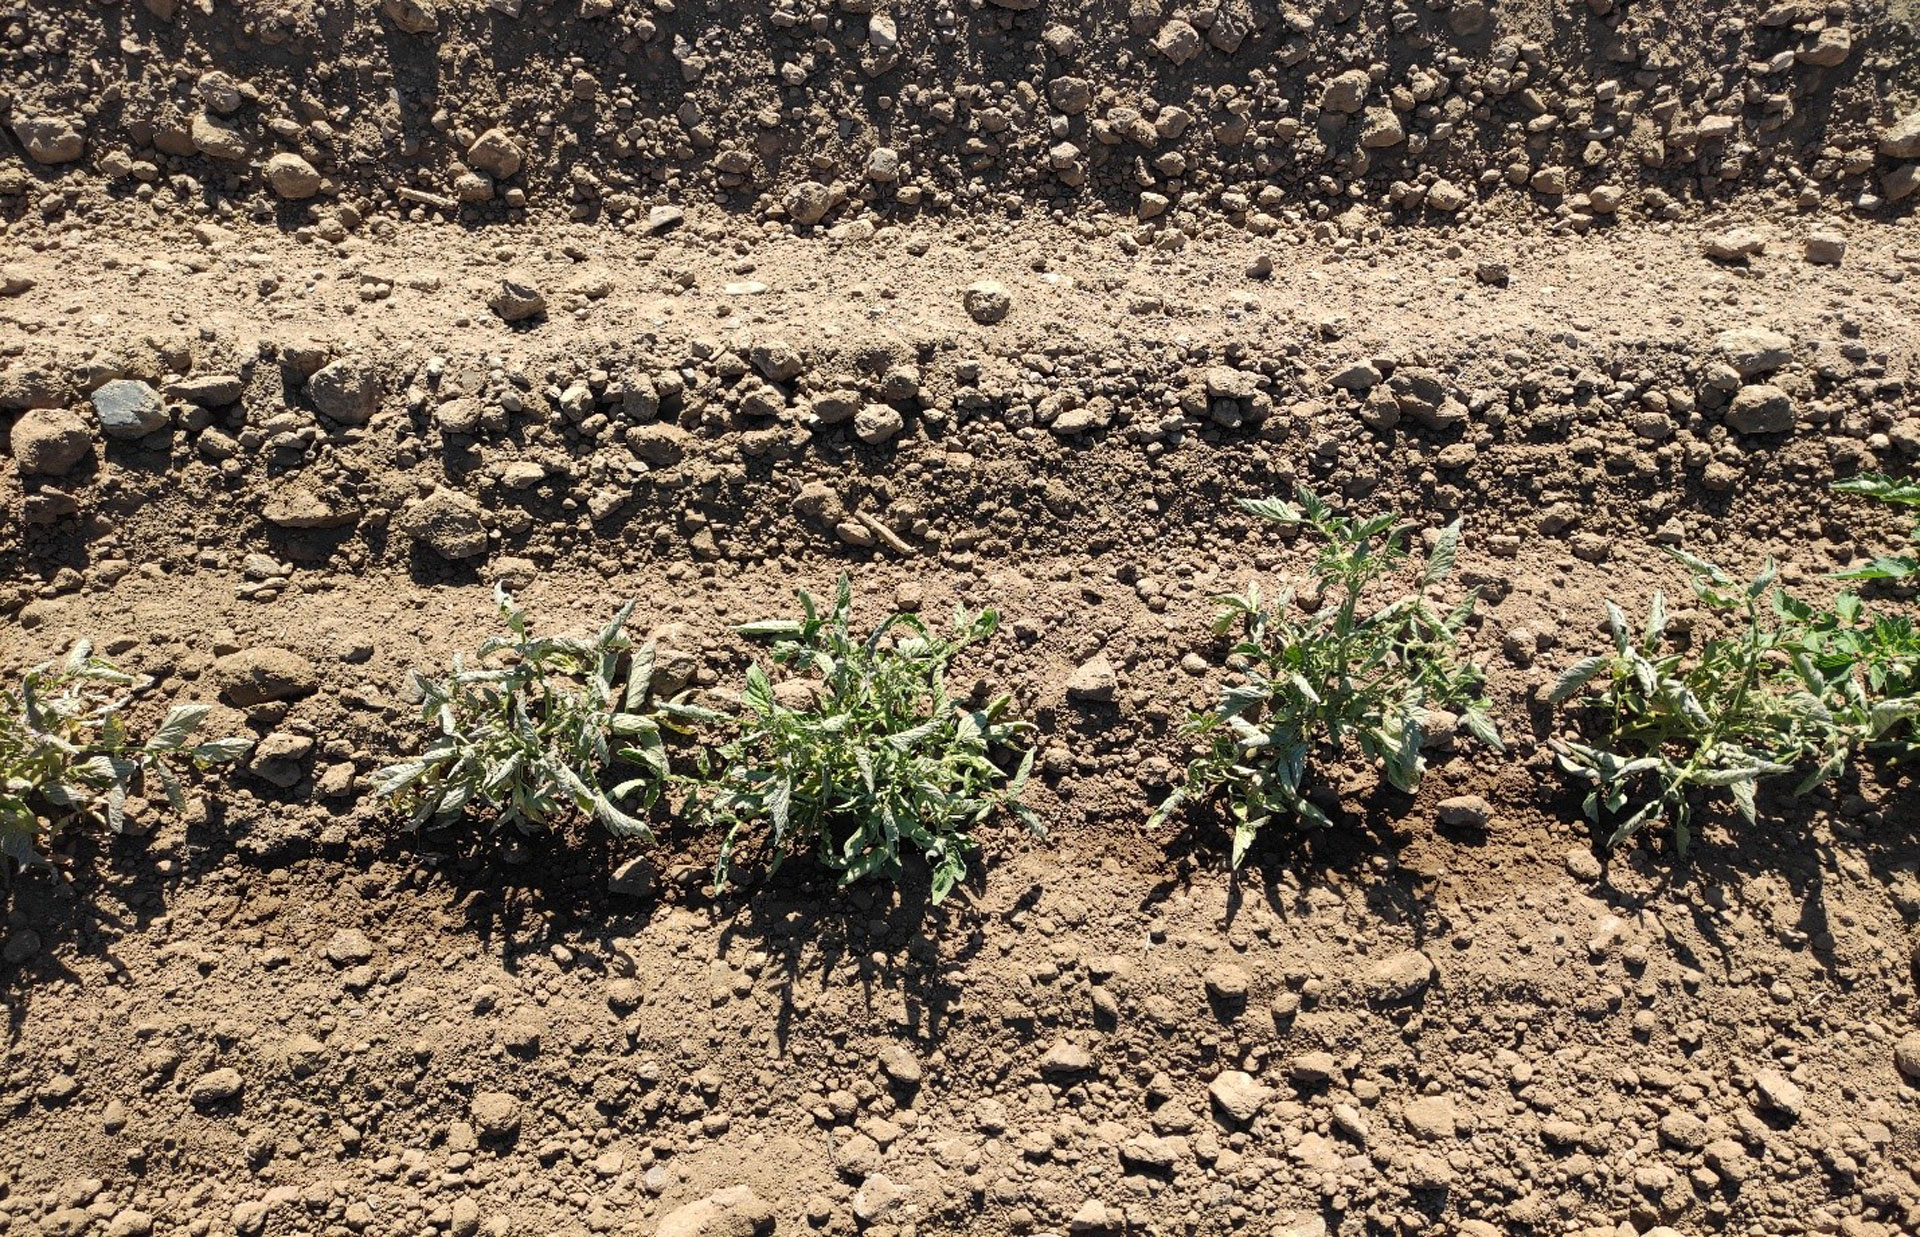
If we just look at one single crop in more detail, such as lettuce, we can start understanding the multiple things we should be aware of.
Watch Preplan N
Pre-plant N applied in fall at bed listing is highly susceptible to leaching below the root zone by winter rain, and it has been found that lettuce receiving starter and side dress N outperformed lettuce that received a broadcast N application before seedbed preparation.
It would be wise to note that lettuce requires little N in the early phase of growth. Studies found that N uptake during the first month after planting represented no more than 20% of total uptake. As should always be the case, I highly advise using a current soil test to know where your N level is before applications. The optimal pre-plant application rate depends on residual soil nitrate N. When the residual nitrate N concentration exceeds 20 ppm, no pre-plant N application is required. When the residual soil nitrate N concentration is lower, a small application of 20 to 40 lbs./acre just before or at planting is sufficient to cover the early N needs. To ensure that N is available in the root zone of young plants, irrigation management should be optimized to limit nitrate movement below the root zone.
High application rates not only increase the risk of N losses, but may also damage seedlings. Studies in the Imperial Valley showed that pre-plant or starter ammonium N applications exceeding 50 to 60 lbs./acre may damage seedlings, resulting in uneven growth.
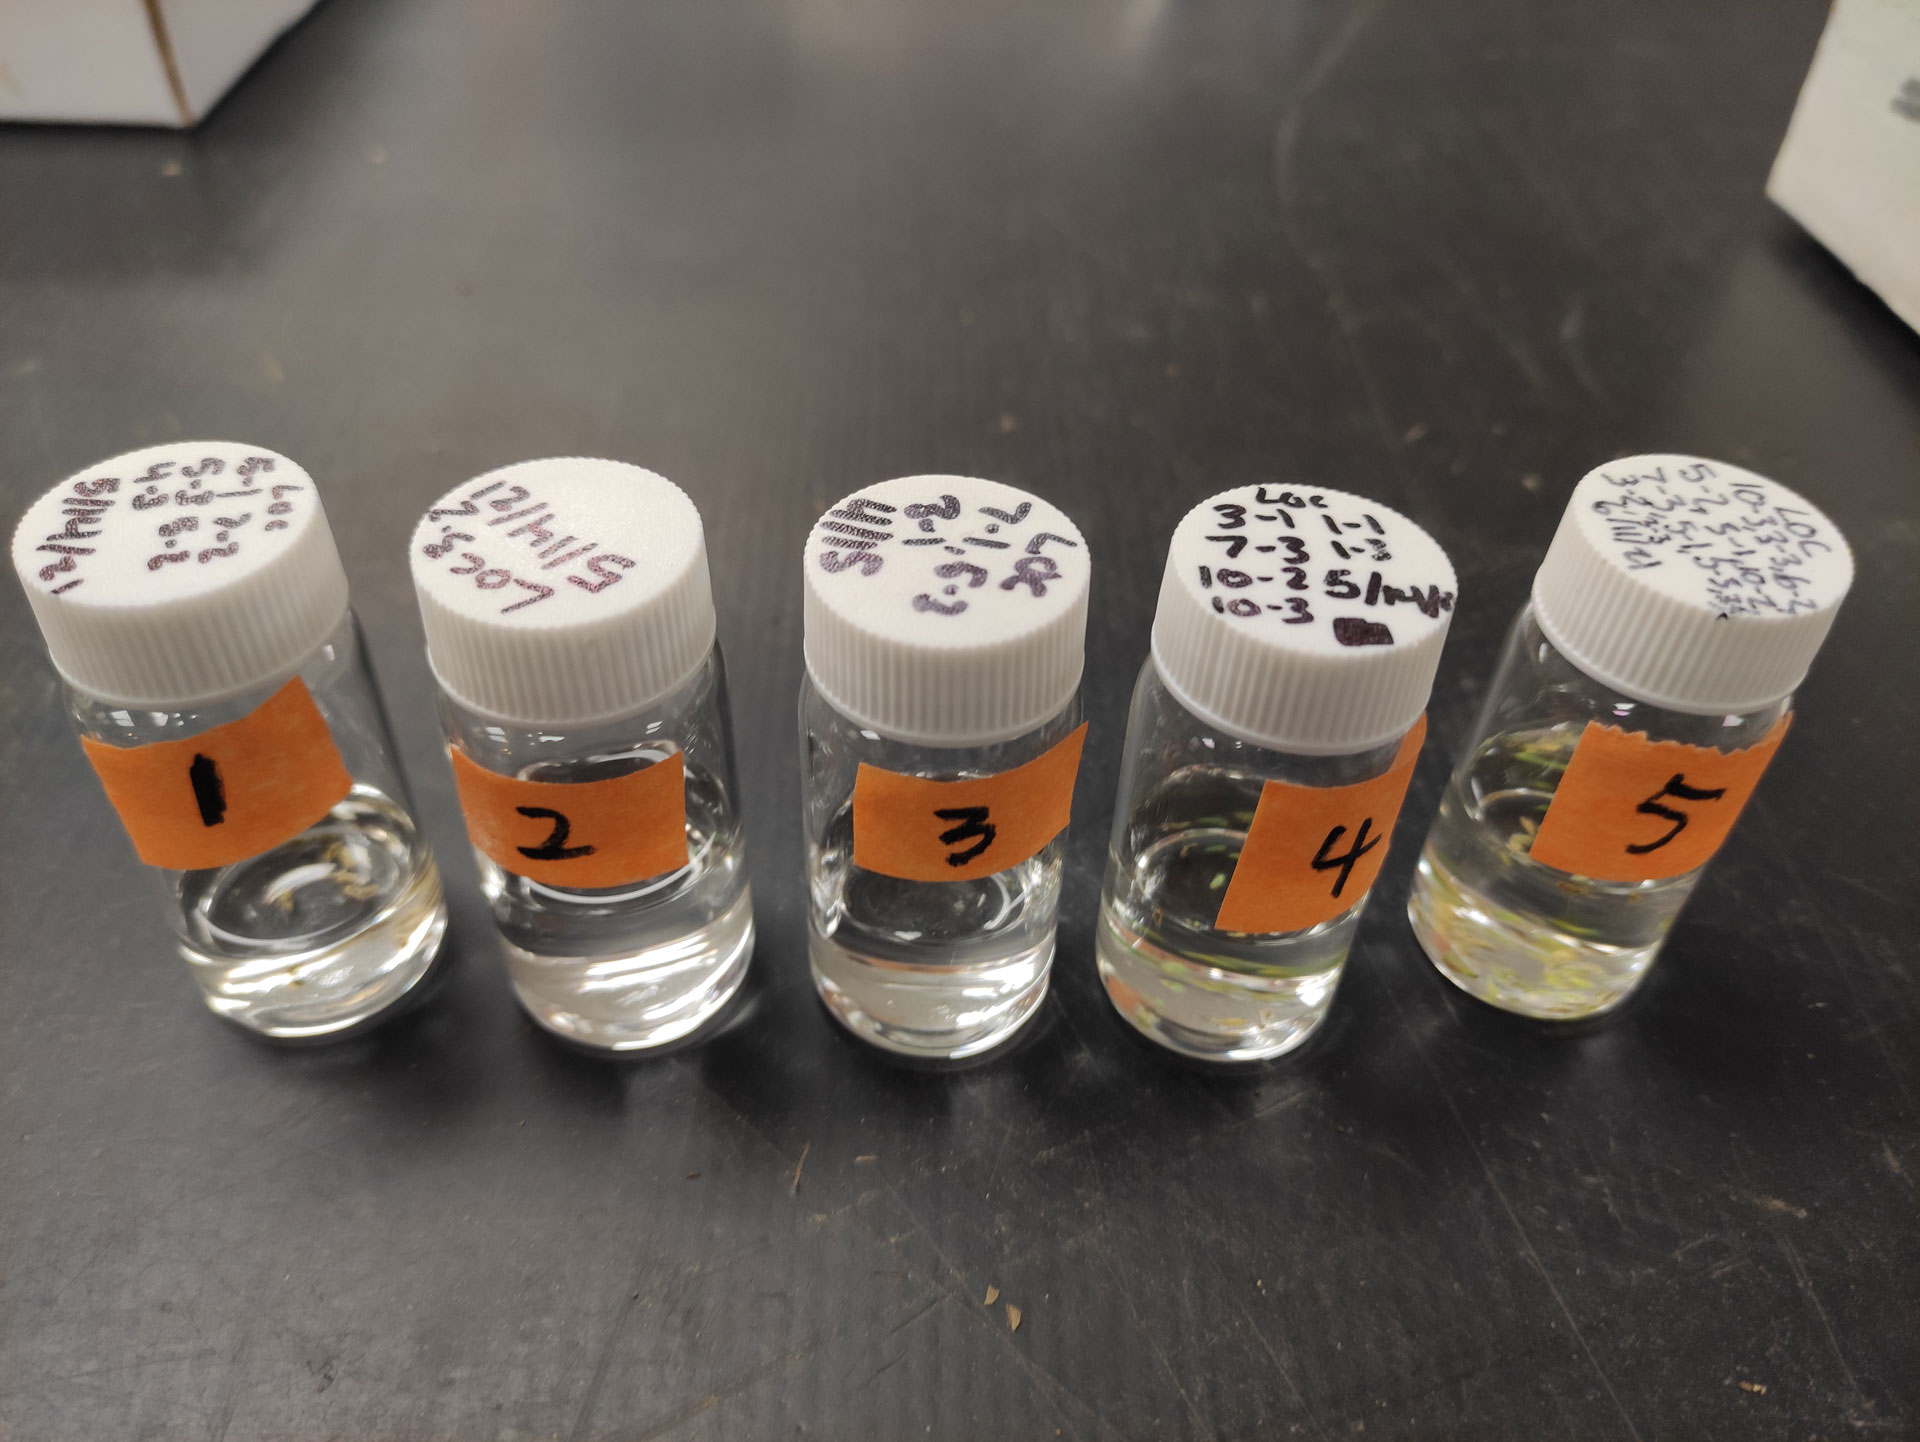
Interpretation of Test Results
Several studies carried out in commercial fields in the Salinas Valley found that no fertilizer N is necessary when the pre-side dress nitrate N level in the soil is above 20 mg/kg (= 20 ppm). A concentration of 20 ppm nitrate N in the top foot of soil equals approximately 80 lbs. N/acre. In the absence of leaching, this amount of N could supply a crop for at least two weeks, even at peak N demand. However, if you experience a heavy rainfall event or the have cold wet soil conditions this amount might turn out to be inadequate.
Understanding your crop and its response to soil temperature and moisture conditions might avoid a poor yield. N treatment technologies can help to hold the nutrients in position near the root zone for longer periods. This could help mitigate stress conditions and help the crop rebound from adverse climate conditions. Again, seek information from your crop consultant about current technology available. It might come in the form of seed treatment or a direct treatment or additive to the nutrient added to promote nitrogen use efficiency. There are nitrogen fertilizer manager technologies that will let you increase nutrient availability over longer periods in season. It can help protect from losses by stabilizing your N and allowing for less loss by volatilization, nitrification and denitrification.
After reading your soil report, you find that the nitrate N concentration in the soil is below 20 ppm, and adding only enough N to increase soil-available nitrate N to 20 ppm is needed. Contact your local crop advisor for more information. You may need or benefit from a second opinion on the sample interpretations.
As you can plainly see, a lot more goes into nutrient management than just applying a rule of thumb amount of nutrients to the soil or plant. Fall is upon us now, so prepare your fields. Study your crop needs and keep a close eye on field and weather conditions. Use your Crop Advisors and Extension experts and pay attention to current releases of technology by reading web-based and printed articles that could improve not only your yield but crop quality.
Happy Planting!


-by-Surendra-Dara-UCCE")


 Invading California")

