
Nitrogen management plans (NMP) for California olive orchards are essential for the Irrigated Lands Regulatory Program and can increase net return. A good NMP has the potential to increase yield, improve oil quality and mitigate biotic and abiotic stresses while reducing nitrogen losses from the orchard.
Olives differ from other orchard crops in California in that they are both evergreen and alternate bearing. Individual leaves may persist on the tree for two to three years. Leaf abscission is somewhat seasonal, with most leaf drop occurring in late spring.
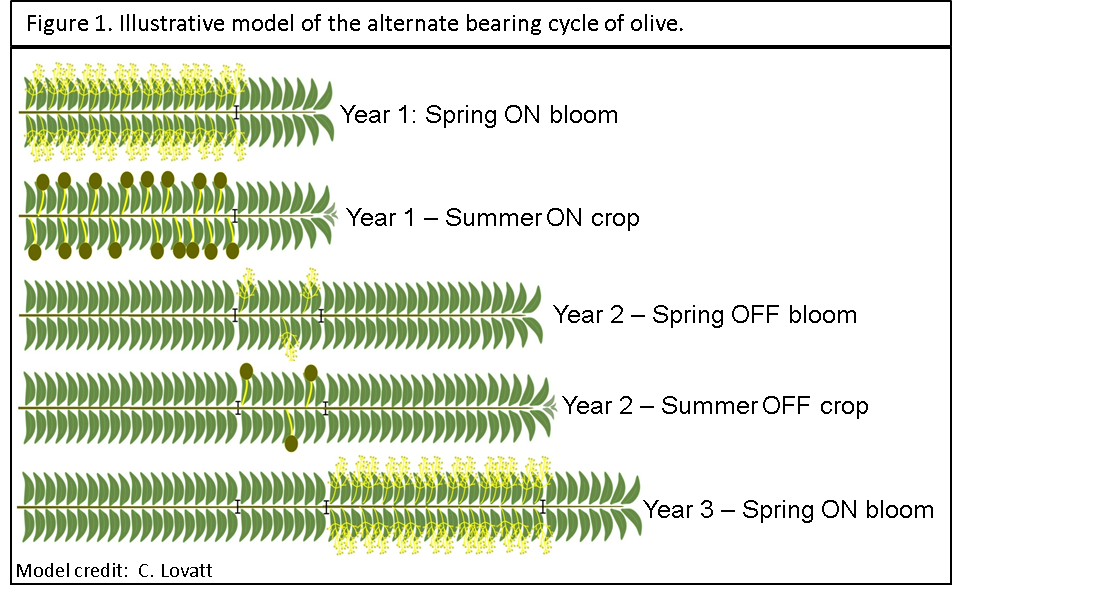
Rapid shoot expansion occurs on non-bearing branches during the hottest part of the summer (July/August) on ‘Manzanillo’ olives in California. The fruit on bearing branches limits current-season vegetative growth. Olives bear fruit on the prior year’s growth, and the alternate bearing cycle is characterized by extensive vegetative growth in one year followed by reproductive growth the following year (Figure 1). With bloom occurring in late April to mid-May, fruit set can be estimated in early July, allowing for consideration of crop load while interpreting foliar nutritional analysis in late July-early August.
Critical Nitrogen Values
Foliar nitrogen content in July/August should range from approximately 1.3% to 1.7% to maintain adequate plant health. The symptoms of nitrogen deficiency manifest when foliar nitrogen content drops to 1.1% N. As leaves become increasingly nitrogen deficient, foliar chlorosis progresses from yellow-green to yellow. Leaf abscission is common at nitrogen levels below 0.9%. Nitrogen deficiency in olive is associated with a reduced number of flowers per inflorescence, low fruit set and reduced yield.
Excess nitrogen (>1.7%) adversely affects oil quality. Oil with low polyphenol concentration is associated with orchards exhibiting excess nitrogen fertility. Since polyphenols are the main antioxidant in olive oil, reduced polyphenol levels are associated with reduced oxidative stability.
Nitrogen content may impact orchard susceptibility to biotic and abiotic stresses. For example, while excess nitrogen content has been associated with increased tolerance to frost prior to dormancy, it is associated with sensitivity to low temperatures in spring (post-dormancy). High nitrogen content has also been associated with increased susceptibility to peacock spot, a foliar fungal disease on olive.
Foliar Sampling for Nitrogen Analysis
By convention, foliar nutrient analysis is conducted in late July to early August in California. Fully-expanded leaves are collected from the middle to basal region of the current year’s growth at a height of about five to eight feet from the ground. To capture a general estimate of the nitrogen status of the orchard, samples should be taken from 15 to 30 trees, with approximately five to eight leaf samples collected per tree. Leaves for analysis should only be collected from non-bearing branches. Growers may find it beneficial to make note of the ‘ON’ and ‘OFF’ status in the historical records of each block. The orchard bearing status, combined with anticipated yield and foliar analysis, will guide decisions for nitrogen applications the following year.
Nitrogen Distribution in the Tree
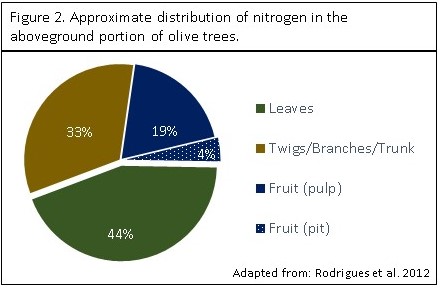
Over 75% of the aboveground nitrogen in the olive tree is incorporated in the vegetative biomass (Figure 2). The twigs, secondary branches, main branches and trunk account for approximately 33% of aboveground nitrogen. 23% of the aboveground nitrogen is harbored in the fruit, with the majority in the pulp (19%). Fruit is only an important nitrogen sink during the initial phase of growth. As fruit size increases, the N concentration decreases due to dilution.
Estimation of Nitrogen Removed from the Orchard
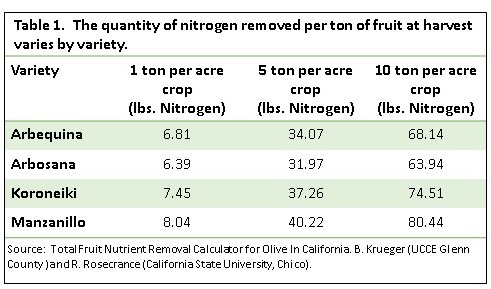
The easiest component of orchard nitrogen loss to estimate is the N in the harvested fruit. A ton of harvested olives removes approximately 6-8 lbs N from the orchard. The quantity of nitrogen in the fruit varies slightly between olive varieties (Table 1). Growers can use the Fruit Removal Nutrient Calculator for Olive on the CSU Chico website to gain estimates of N removal by the three oil varieties (Arbequina, Arbosana and Koroneiki) and the Manzanillo table olive. This tool was developed by Dr. Richard Rosecrance, a professor at CSU Chico, and Bill Krueger UCCE farm advisor. To access the Fruit Removal Nutrient Calculator for Olive, visit rrosecrance.yourweb.csuchico.edu/Model/OliveCalculator/OliveCalculator.html.
Pruning may generate a second component of nitrogen loss from orchards. The best practice to mitigate nitrogen loss from pruning is to reincorporate the pruned material into the orchard floor by flail mowing. The nitrogen in this organic material will gradually become available to the trees through mineralization.
In mature orchards, the wood removed by annually pruning is approximately equal to the annual vegetative growth. Consequently, the input and removal of nitrogen in vegetative growth is cyclic and almost equal in mature orchards. In young orchards, nitrogen inputs are utilized to support vegetative growth and little N is removed from the orchard in prunings or crop. During this time, nitrogen must be supplied to meet the demand to support vegetative growth. It is estimated that approximately 2.5 lbs N is required to produce 1000 lbs fresh weight of tree growth.
Nitrogen Use Efficiency
Not all the nitrogen supplied to the orchard from fertilizer and other inputs (i.e., organic matter, irrigation water) is utilized for tree growth and crop production. A fraction of nitrogen is lost from the orchard ecosystem through processes such as runoff, leaching and denitrification. Efficiency varies among orchards, with some orchard systems exhibiting higher nitrogen utilization rates than others. The efficiency generally varies from 60% to 90%. Higher values denote more efficient use of nitrogen inputs. To estimate the amount of nitrogen to supply an orchard, the demand is divided by the estimated efficiency. For example, if nitrogen demand is 50 lbs. per acre and efficiency is estimated at 0.8, then 62.5 lbs N per acre should be applied.
Nitrogen management plans are site-specific and designed to meet orchard and crop demand while reducing environmental losses. Nitrogen utilization is never 100% efficient. Nitrogen use efficiency can be maximized by minimizing losses from irrigation and fertilization practices while utilizing foliar analysis and knowledge of alternate bearing status to fine-tune applications.
References
Fernández-Escobar, et al. 2011. Scientia Horticulturae 127:452–454.
Hartman, H.T. 1958. Cal Ag. Pgs 6-10.
Rodrigues, M.A. et al. 2012. Scientia Horticulturae 142:205-211.