
Ag Industry
California Code of Regulations Update: Neonicotinoids
On Jan. 1, 2024, an update to California Code of Regulations went into effect addressing the use of…
Read ArticleArticle Archive
On Jan. 1, 2024, an update to California Code of Regulations went into effect addressing the use of…
Read Article
The relentless storms of 2023 set new precipitation records for California and caused widespread local flooding. “Atmospheric rivers,”…
Read Article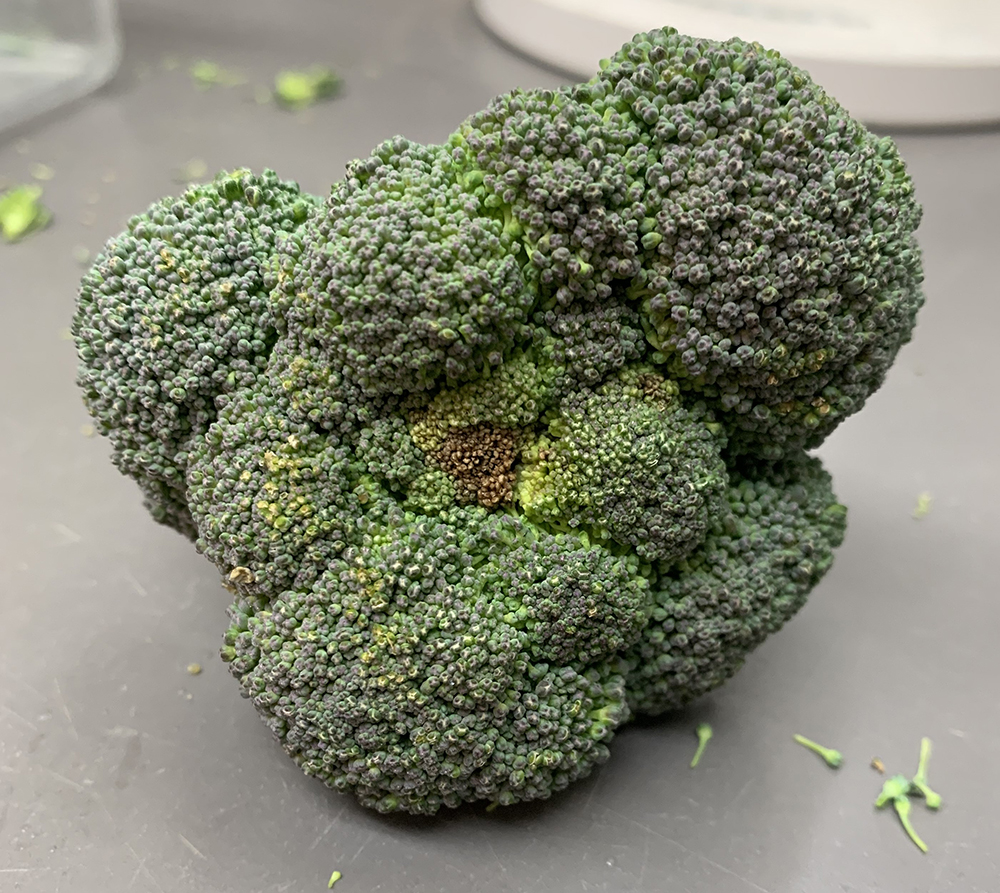
Broccoli head rot, also known as pin rot, continues to increase in the Salinas Valley, especially in fall…
Read Article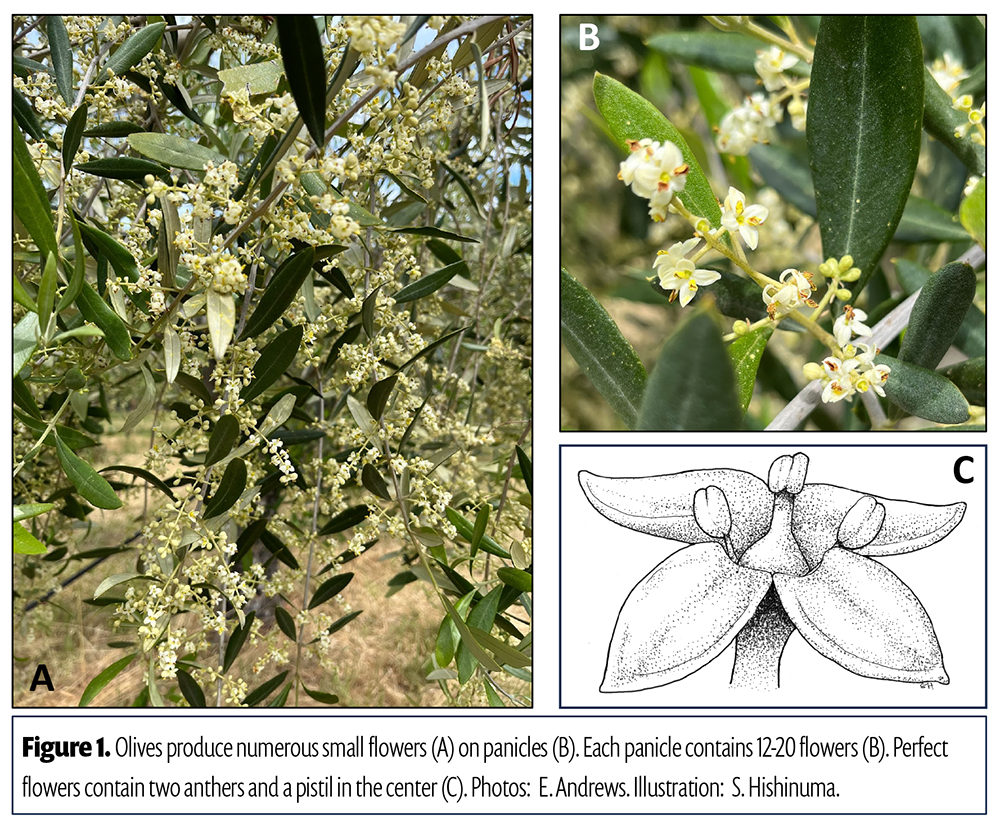
Olive orchards entering an ‘off’ year in 2024 may benefit from pre-bloom foliar boron applications to support reproduction…
Read Article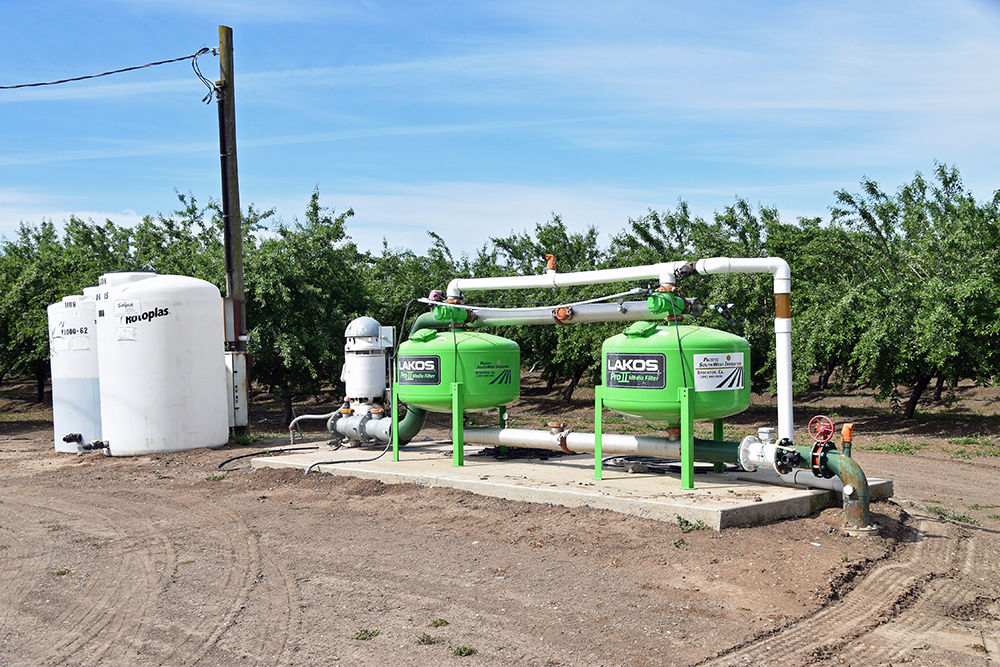
As water quality regulations intensify for California growers, the industry has drawn attention to crop consultants as a…
Read Article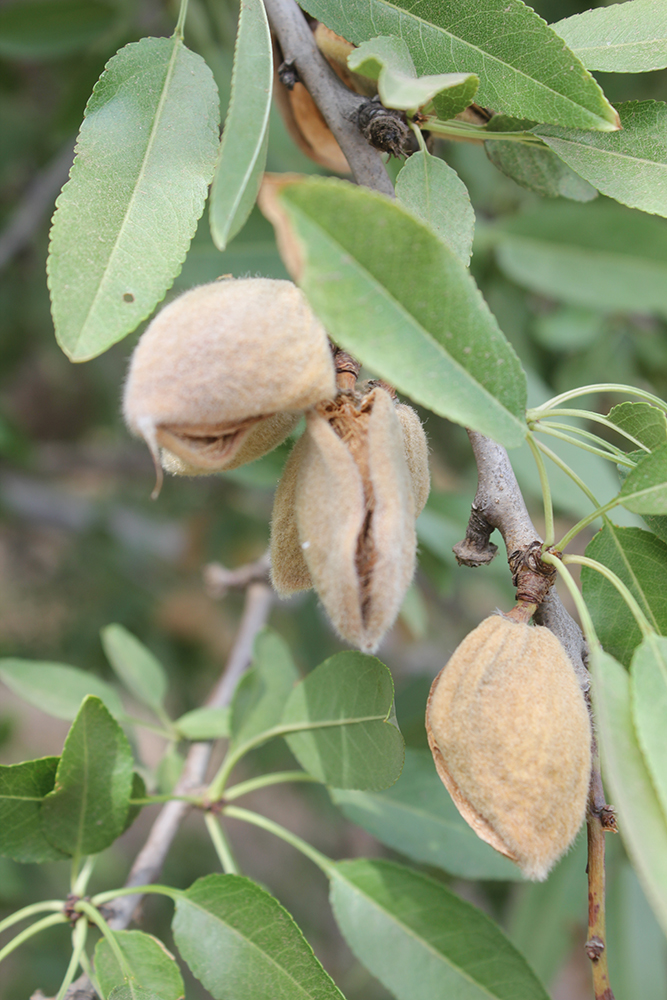
I know what you’re thinking; another green-washed lecture from someone who has no understanding of farming practices and…
Read Article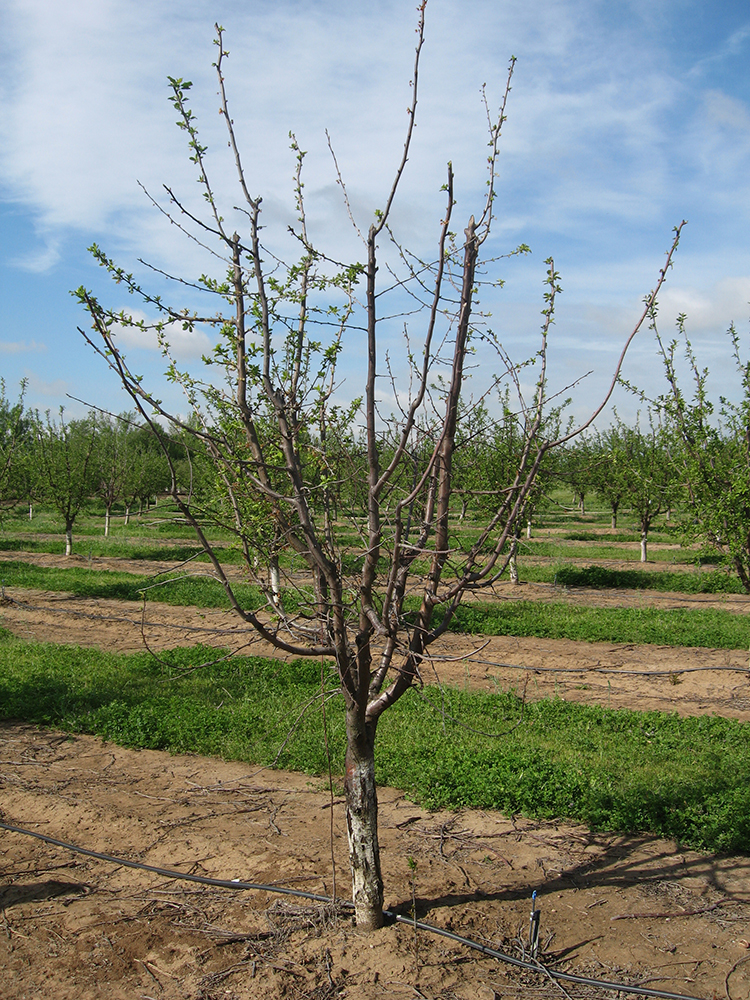
In the Sacramento Valley orchard business, the grass is blue and the sky is green. The primary nut…
Read Article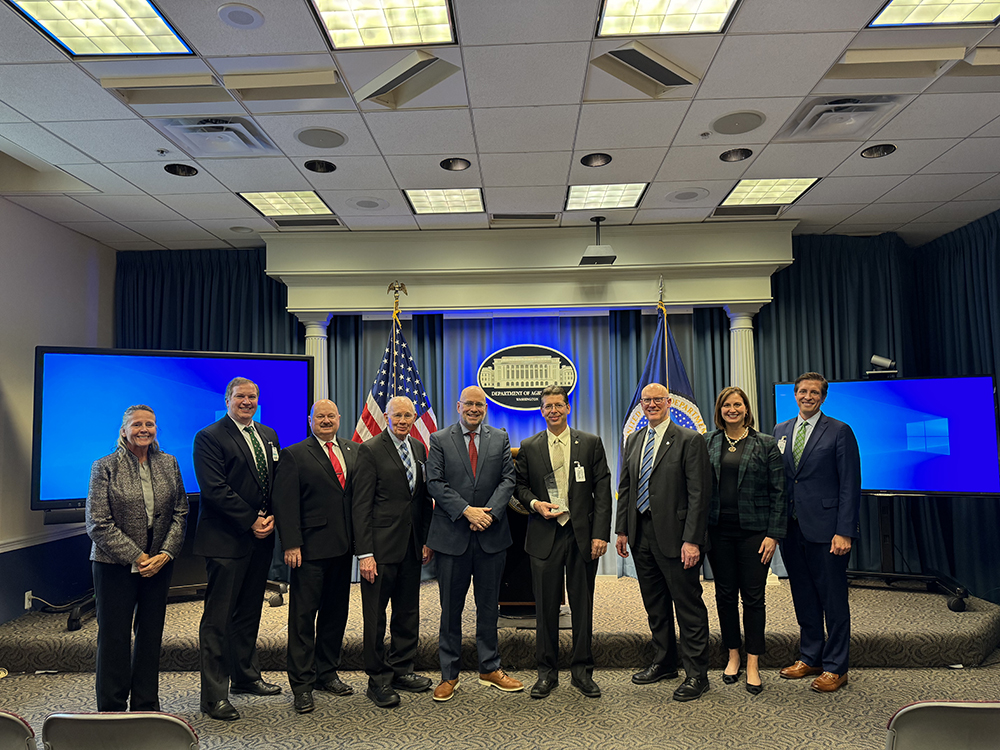
In early December 2023, Russell Taylor received the 2023 Certified Crop Adviser Conservationist of the Year Award in…
Read Article
According to the Sustainable Agriculture Research and Education (SARE), “a cover crop is a plant that is used…
Read Article
Utilizing lab data successfully comes down to knowing what is being measured and why. Take for example soil…
Read Article