


Fruit trees need low temperatures during the winter season to break dormancy and ensure synchronized fruit development during the growing season. If winter is warm, bloom will be inadequate, delayed and uneven, cross-pollination will be limited, and fruit set will be reduced, resulting in varying crop sizes and maturity stages at harvest time, which can further reduce yield and substantially impact growers’ returns. To overcome low chill, growers rely on chemical rest breaking agents that ‘mitigate the lack of chill,’ advance and condense bloom and ensure sustainable yields and profitability. However, these products must be applied at the right time to be effective and reduce the risk of phytotoxicity. The time to apply dormancy-breaking agents is currently based on the accumulation of a certain level of chill, given a certain chill model.
Chill Accumulation Models
Different models to calculate winter chill accumulation are available for growers. Some models consider chill hour accumulation as the number of hours below 45 degrees F. The more recent and complex model, referred to as the Dynamic Model, also considers the loss of chill when temperatures are warm for calculating the chill portions. However, all these models have shown differences among locations and years, with this inconsistency being amplified by climate change. These inconsistences have significantly reduced model reliability with profound effects on growers who rely on these calculations for important management practices, such as selecting appropriate cultivars or timing the application of dormancy-breaking products. One weakness of all these models is they base chill accumulation calculation using air temperature as the only environmental factor.
Climatic Shifts and Impact on Chill Accumulation Calculation
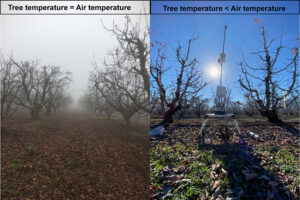
Prolonged periods of fog in the Central Valley contributed significantly to chill accumulation in this region. However, the intensity and duration of this fog declined significantly over the years. Analyses of climate from Baldocchi and Waller from UC Berkley published in 2014 showed a reduction of the number of winter fog events in the Central Valley of California by 46% over 33 years. This climate change is reducing chill accumulation and, importantly, is reducing our capability to properly predict chill accumulation with the currently available models based on air temperature only. In fact, on foggy days tree temperatures are very similar to air temperatures (opposite to sunny days when radiation directly heats the tree), leading to tree branches and main scaffolds becoming warmer than air temperature (Figure 1). Thus, air temperatures would reflect the temperatures trees are experiencing on foggy days but not on clear-sky days. Growers have been observing these changes happening for decades now, and researchers have described them in scientific publications, but we still do not have any practical tool to integrate these climatic shifts in our orchards management practices.
Measuring Tree Temperature in California Cherry Orchards
Supported by the California cherry industry, we started in 2020 a series of research trials aiming to characterize cherry tree temperature under different growing conditions. Our final objective was to integrate tree temperature in the chill accumulation models. This would increase their accuracy in predicting chill accumulation, since it is more representative of tree real condition than air temperature, especially in warm and sunny winters.
A large dataset of environmental and physiological parameters was collected for three consecutive seasons in three commercial cherry orchards located in the Lodi (San Joaquin Valley) and Bakersfield (Kern County) areas. We installed meteorological stations in the field to measure weather (mainly air temperature and solar radiation). Tree bark temperature was monitored by inserting thermocouples (very small temperature measuring sensors) just below the bark of branches located at the four cardinal points as demonstrated in Figure 2. As expected, trees were warmer than the air most of the time during clear days. The average difference between tree and air temperatures was about 10 degrees F. The largest temperature difference between trees and air was recorded in the southernmost orchard, where the bark of south-exposed branches was 20 to 25 degrees F warmer than the air.
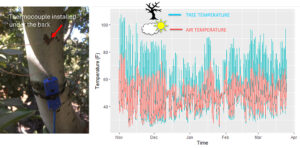
thermocouple installed below the bark in the south exposed side of a main branch in a cherry orchard located in southern California.
Tree Chill Accumulation
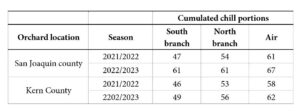
Using tree temperature instead of air temperature, chill accumulation is lower by about 8 to 12 chill portions. This quantity was not constant between locations, years and branch exposures, as mainly affected by climate conditions. For example, in the San Joaquin Valley, 2021-22, which was a relatively warm winter, the south-exposed branches accumulated 14 chill portions less than the air; in 2022-23, which was a very cold winter, the south-exposed branches accumulated only 5 to 6 chill portions less than the air.
Development of the TreeChill Model
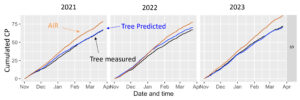
The large dataset collected during the three years of project was used to develop the TreeChill model, a grower-friendly tool that predicts tree temperature based only on environmental parameters easily achievable from public weather stations. The model is highly accurate right now for predicting the temperature of cherry trees located in growing areas where the experiment was performed. As it can be observed in Figure 3, the chill accumulation predicted using the TreeChill model (blue line) is extremely close to the measured tree temperature (black line) and always lower than the measured air temperature (orange line).
locations and two winter seasons and calculated using the air temperature and the
bark temperature measured in branches exposed to South and North.
Future Work
We are now working on publishing the TreeChill calculator as an online tool through our Lab website (Tree System Lab at UC Davis) and the Fruit and Nut Research and Information Center website. The calculator automatically uses the data from the CIMIS, so researchers and growers will only need to input their orchard location and they will have access to tree temperature data and chill accumulation calculated using tree temperature as an input instead of air temperature. Next step will be creating a correlation between TreeChill and AirChill for different years and locations so we can start to implement tree temperature in grower management decisions, including dormancy breaking agent applications, cultivar selection, pest control, etc. In the future, we plan to adapt the model to different crops and locations.


 Invading California")

