
In California, avocados are primarily grown in southern and central parts of the state along the coast. These regions face uncertain water supplies, mandatory reductions of water use and the rising cost of water, while efficient use of irrigation water is one of the highest conservation priorities. Data on water use by avocado orchards and optimal irrigation strategies needs to be updated in light of increasing water pressure in order to achieve efficient water and fertilizer management. Moreover, due to increasing salinity in water sources, effective irrigation is more critical to ensure optimal yield and high-quality fruit as avocados are one of the most salt-sensitive crops.
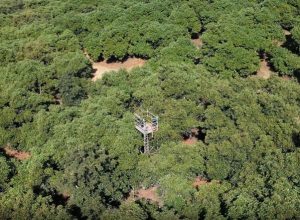
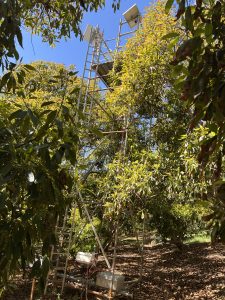
An ongoing irrigation study aims to acquire relevant information on crop water consumption and develop more accurate crop coefficient curves over the season for avocados under different environment and cropping systems in southern California. Extensive data collection is being conducted in nine mature avocado sites in San Diego, Temecula, Orange and Ventura counties using combined cutting-edge ground- and remote-sensing technologies. A combination of surface renewal and eddy covariance equipment (flux tower, Figure 1) are utilized to measure actual crop evapotranspiration to develop crop coefficient curves at each site. Several other sensors and equipment are being used to monitor soil and plant water status and soil salinity, and high-resolution images are being captured by unmanned aerial systems to evaluate canopy features. This article provides some avocado water management tips based on the preliminary findings of this study.
Variable Spatial and Temporal Crop Water Needs
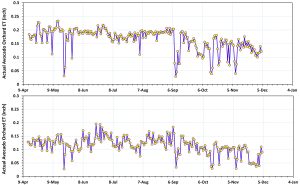
The results from the avocado experimental sites demonstrate considerable variability in avocado consumptive water use, both spatially and temporally. The cumulative avocado consumptive water use (actual evapotranspiration or ET) across two sites in Temecula (site 1 with an elevation of 1,490 ft. above sea level) and in the San Pasqual Valley, Escondido (site 2 with an elevation of 720 ft. above sea level) varied from 28.1 in. to 38.5 in. over a 235-day period (Figure 2). The average daily actual ET was 0.18 in d-1 in June/July at site 2, while the amount was 0.14 in d-1 at site 1 for the same period. This is a notable difference of actual ET between these two sites. More uniform daily crop water consumption over the summer period occurred at site 2 when compared with site 1 located at a higher elevation.
Crop Coefficient Values a Valuable Tool
To estimate crop water requirements, various crop coefficient (Kc) values of 0.64 (Grismer et al. 2000), 0.72 (Gardiazabal et al. 2003) and 0.86 (Oster et al. 2007) were reported for “Hass” avocado. Kc value is greatly impacted by differences in climatic conditions, canopy features (size of crop canopy and shaded area), row orientation, soil and irrigation water salinities, and amounts and frequencies of water applied. The question is, can we use a single crop coefficient the entire season that is based upon data developed decades ago that does not consider the impacts of plant density, row orientation and microirrigation? Can this value be used for different avocado regions in California?
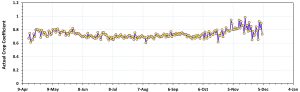
Figure 3, see page 10 demonstrates the trend of daily actual crop coefficient values over a 235-day period at avocado site 2. More variations in water use were found during fall months when compared with spring and summer months. Average crop coefficient values of 0.77, 0.72 and 0.81 were determined for the periods of April to May, June to mid-October, and mid-October to early December, respectively. Lower crop coefficient values were obtained at site 1. It needs to be noted that these sites haven’t been under water stress and/or salinity stress most of the study period while due to the two heat waves in late June and early September, trees could experience heat stress for a while. The continuous measurements across the experimental sites will provide a comprehensive data set to update and develop more accurate crop coefficient curves for avocados at each site. These crop coefficient curves could be considered as an effective tool for irrigation management in California avocado production systems.
Soil Moisture Sensing
Understanding the effects of irrigation events on soil moisture provides critical insight for growers about the present growing environment for crops. While experienced growers have learned over seasons of observations how their soils and water interact, utilizing a soil moisture measuring device of some sort enables them to put a number on their observations and more accurately track trends over time.
The sensors allow growers to better understand the frequency and duration of irrigation events needed and to maintain adequate moisture based on the crops being grown. There are instances where irrigation cycles are occurring too often and for far longer periods than needed to achieve field capacity of the rooted volume of soil. There are also instances where the use of sensors revealed malfunctioning irrigation system components by reporting unusually dry soil in areas that should have received ample irrigation. Soil moisture sensing is contingent on having a well-maintained irrigation system with a good distribution uniformity. Soil moisture sensors should be used as a useful tool to answer the following critical questions:
What is the water status of the soil early in the irrigation season?
When is the right time for the first and subsequent irrigation events?
Is the soil profile full after each irrigation event?
What is the length of irrigation time?
Should the irrigation practice be changed?
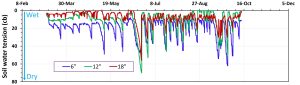
An example of the use of soil moisture monitoring at site 1 over a six-month period is shown in Figure 4. Half-hourly soil water tension was plotted for multiple depths (6”, 12” and 18”). The data shows that soil water was maintained at a desired level within the crop root zone at this site due to the frequent drip irrigation events. Although the average soil water tension varied over time in the top 18 in. of the soil, it never declined below 5 centibars and never exceeded 56 centibars over the period. The average values at 6”, 12” and 18” deep over the period were 20.1, 11.5 and 9.0 centibars, respectively. The soil moisture data at this site indicates that the irrigation frequency was scheduled properly while shorter irrigation runs could be considered in each irrigation event to improve irrigation efficiency.
Soil Types and Conditions, Canopy Features and Row Orientations
Avocado is one of the most salinity sensitive crops produced in California but is commonly grown in areas where poor quality is common. In recent years, salinity problems in California avocado have become increasingly common as the cost of irrigation water has risen and the availability of low salinity water for agriculture has diminished.
The source of water across the six avocado experimental sites in San Diego, Temecula and Orange counties have an ECe greater than 1.0 dS m-1 and chloride >100 ppm. Across the sites, the maximum soil ECe of the top 1 foot was measured (3.4 dS m-1) at a site with 28-year-old trees and a silty loam soil texture in Orange County. A high chloride content (311.3 ppm) was also measured in the top 1 foot. A leaf chloride percentage of 0.465 was observed in early September at this orchard. Under such circumstances, yield improvement could be gained for the avocado orchard with increasing amounts of applied water to leach salt and particularly chloride from the effective crop root zone. Excess irrigation can be considered as beneficial water use for salinity management in avocado groves while the optimal leaching strategy could be different from site to site depending on soil types and salinity status, quality of irrigation water and irrigation system.
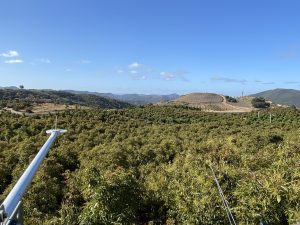
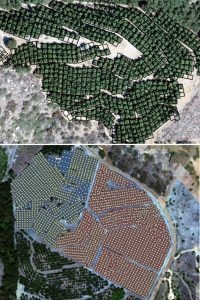
Ground shading percentage or canopy cover that provides a good estimation of canopy size/volume (Figure 5) and the amount of light that it can intercept is likely the most important driver influencing crop water needs. At the experimental sites, canopy vegetation cover percentage for each tree derived from drone-based multispectral imagery ranged from 0% (missing trees) to 100%. For instance, the canopy cover varied from 33.5% to 98.9% with tree spacings of 15 ft. × 18 ft. at site 1 versus 40.3% to 94.5% at site 2 with tree spacings of 20 ft. × 20 ft. The average canopy cover was 71.6% and 85.4% around the flux towers at site 1 and site 2, respectively. This clearly indicates that site 2 has a greater light interception, and as a result, greater crop water needs are expected when compared with site 1 (Figure 2).
Both sites 1 and 2 have a south-facing slope orientation which means there is unlikely to be a notable impact from slope differences on the crop water use between the two sites. Avocado sites with north- and east-facing slope orientations are expected to have lower crop water needs even in a single orchard, and accordingly sometimes a different irrigation schedule is required for different zones under different orientations in an avocado orchard.