


Putting a farming operation along a profitable path may seem like a simple proposition (spend less to produce the crop than the price it can sell for), but when you look closer, the task is much more nuanced. Solving this equation requires a proactive plan and flexibility for growers to respond to many different scenarios.
Many variables can negatively impact the profitability equation: labor costs, water access/availability, changes in pest management strategy, etc. The chances of enhancing profitability increase when growers put themselves in a stable financial position where they can withstand threats and adapt to variable economic and environmental conditions.
To get there, California growers need to consider several factors that will impact farm finances this year.
Where to Look for Cost Savings
The cost of doing business continues to creep up, but there are savings to be had if you look in the right places.
To start, it’s important to review interest expenses and evaluate different lending options that can impact the cost of borrowing. There will always be a cost to borrowing money, but growers might be overpaying if they don’t research options, particularly in the current rate environment where costs can add up.
Over the last few years, growers have seen a much higher percentage of their profits eaten up by interest expenses due to rising interest rates, which climbed higher than many have seen in a generation. As of March, the Federal Reserve is holding rates steady, but they are still at a 20-year high, so interest rates remain critical.
Growers can’t control rates, but they can take advantage of promotional offers alongside traditional fixed rate financing to bring the total effective interest rate down to a level that, when consolidated, lands below Prime.
Take a hypothetical example where a grower finances an equal amount for three different input purchases over the same financing period. In addition to their own in-house financing offer, a retailer may have access to a variety of promotional rate offers on some brands. For example, a financing package might look like:
- Product A at 9% APR
- Product B at 2% APR
- Product C at 4% APR
If this grower paid for these products with their operating line of credit, they would be looking at a financing rate ranging between 7% to 11% APR. If this same grower used the blended approach and took advantage of the option to finance the purchase of all three products, they would bring their effective interest rate down to 5% APR, which adds up to meaningful savings on interest expense.
Be Proactive When It Comes to Managing Cash Flow
Beyond interest rates, California growers can also impact profitability by looking closely at their cash flow needs and evaluating the terms of any financing programs they participate in to ensure that payment due dates line up with crop schedules.
One of the biggest benefits that comes with strategic use of financing is cash preservation. It’s not enough to have the right mix of crop nutrition and protection products; growers must go a step further and think about how and when they’re paying for those products, whether that strategy affords the amount of financial flexibility they need. For example, growers may experience unexpected costs if they need to adjust their pest management strategy mid-season.
Let’s say a crop is infested by navel orangeworm in July, but a grower won’t have cash on-hand until harvest proceeds are recorded in December. In this scenario, it’s helpful to use other financing programs that can complement a grower’s operating line of credit. This affords more options in terms of how and when to spend capital, depending on changing needs.
Creating a Layer of Protection Against Market Volatility, Other Uncertainties
Growers know they are going to face challenges every season, and they need to be ready to respond to impacts from the market, Mother Nature and other factors that play into the success of their crop. We can’t control every threat as no one has a crystal ball to show where the market will go. It’s hard to predict how consumer preferences are going to shift and how that will impact crop selection and planting decisions. However, there are a few proven strategies that can give California growers some peace of mind when it comes to protecting themselves, and their money, against external forces.
It starts with capital management strategy, and being surrounded with people who can provide partnership and expertise to help succeed. Second, it may seem elementary, but diversification is also critical to manage risk. That may come in the form of crops, but it also comes back to finances and having a diverse stream of capital to pull from as to not overextend or put too much leverage on one source of capital.
Having a sound financial plan is also helpful when it comes to contingency plans and avoiding situations where a grower might take a financial hit when something unexpected happens. Strategic financing of crop inputs enables growers to keep cash on-hand for those unexpected expenses. Growers who are paying for operational expenses with a bank operating note have fewer options in terms of a backup plan if they run into unforeseen circumstances.
As we see how things start coming up after planting season, now is a good time to evaluate a financial plan and make sure growers are taking steps to positively impact profitability. With informed financial planning and sound money management, 2024 can be a grower’s best year yet.
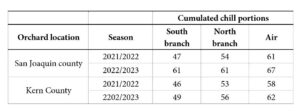
")


 copy")


 Invading California")

