
newsletter
Thinking About Smarter Irrigation Strategies for California Avocados
At the recent UCCE Avocado Irrigation Workshop in San Diego County, industry experts, crop consultants and growers gathered…
Read ArticleArticle Archive
At the recent UCCE Avocado Irrigation Workshop in San Diego County, industry experts, crop consultants and growers gathered…
Read Article
Champaign, Illinois – July 15, 2025 – BioLumic, the only agricultural biotechnology company that programs seed traits using light, today…
Read ArticleThe California Walnut Conference, the annual gathering for walnut growers and handlers, is returning with a new date…
Read Article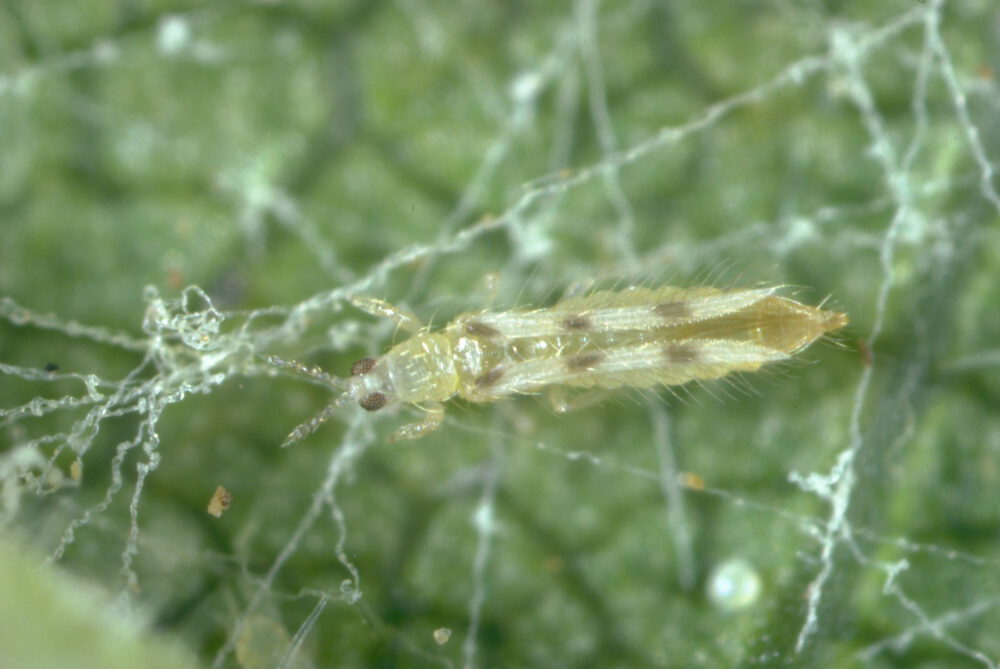
As summer temperatures soar into triple digits across California’s Central Valley, the annual battle against spider mites has…
Read Article
The 2025 Crop Consultant Conference returns September 24-25 at the Visalia Convention Center, bringing together California’s leading PCAs,…
Read Article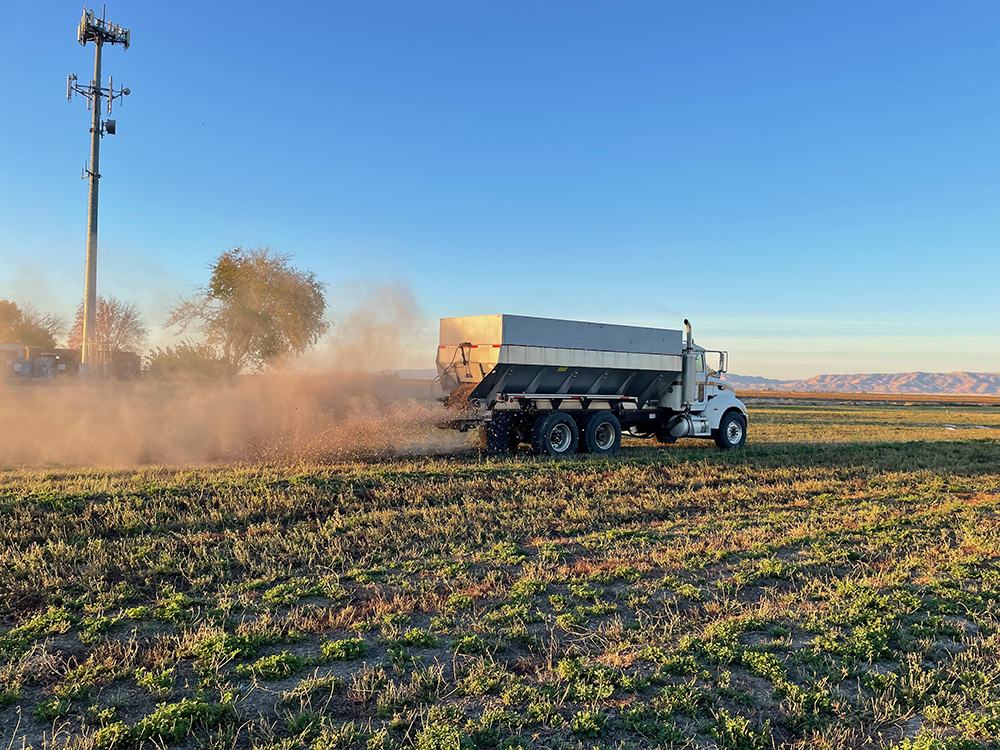
Almond shells were applied as a mulch to an established alfalfa field in Yolo County over a two-year…
Read Article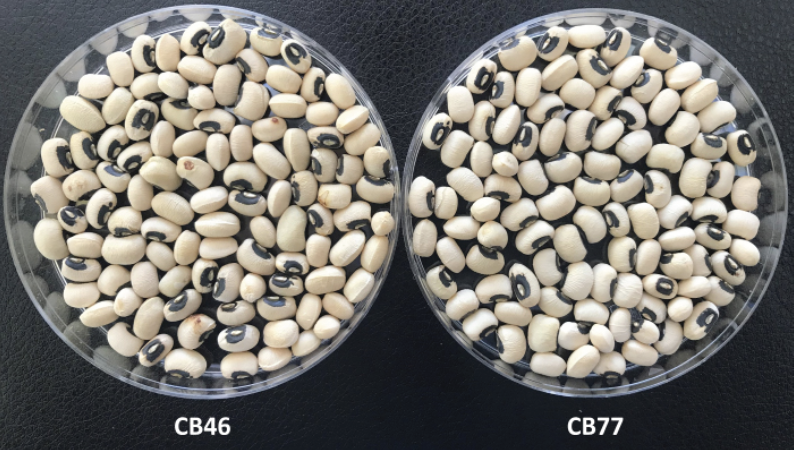
Black-eyed peas, also called cowpeas, are a bean species native to Africa in the Vigna genus of legumes.…
Read Article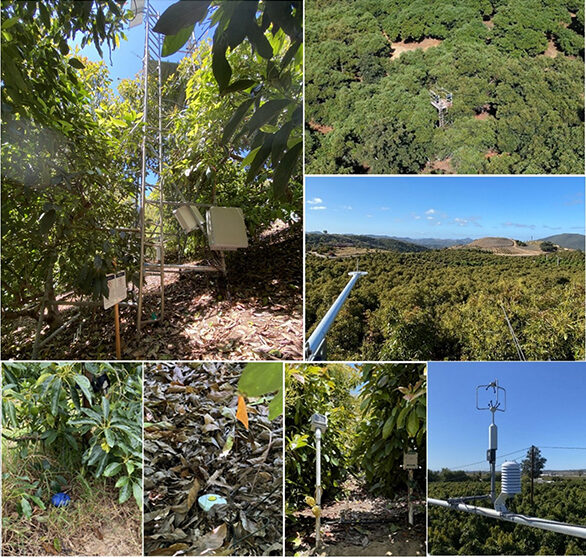
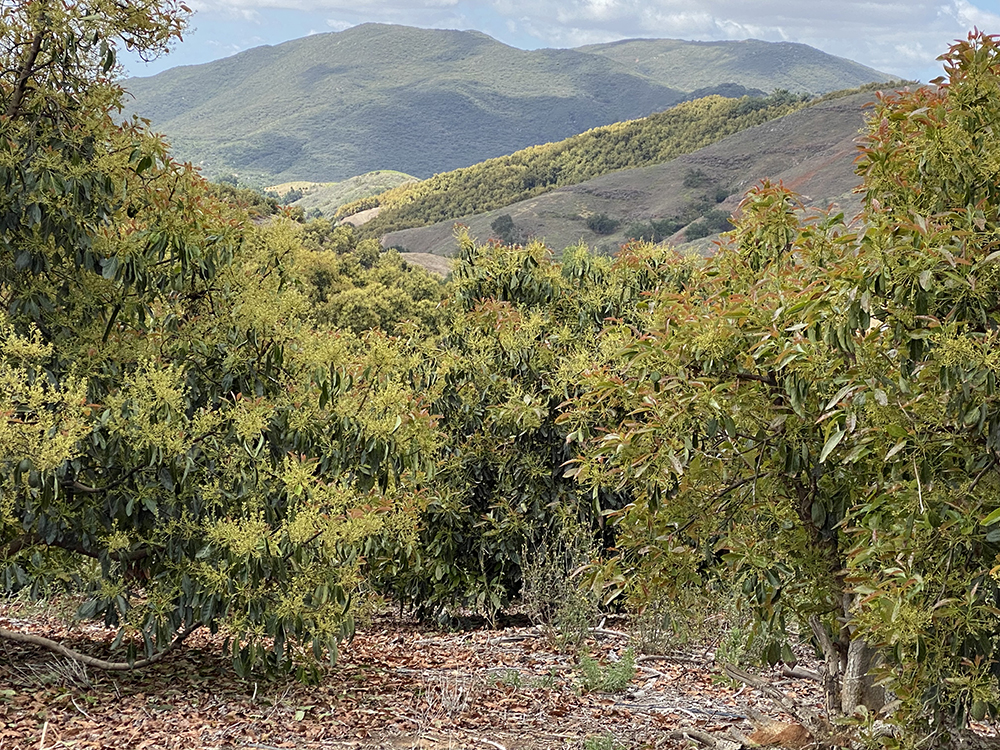
In California, avocado (Persea americana Mill.) is primarily grown in southern and central parts of the state along…
Read Article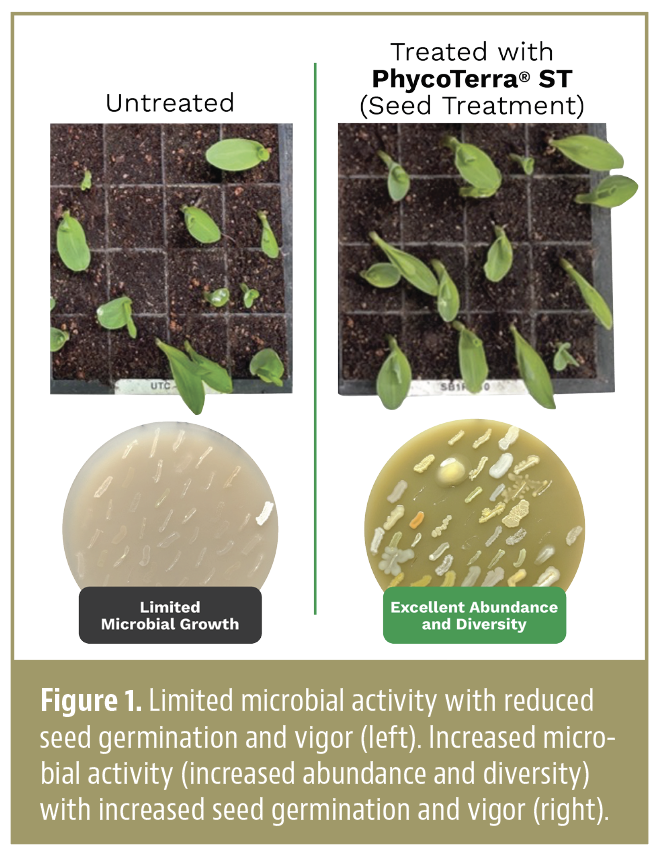
Literally and figuratively, it is the little things that count when establishing crops. Yes, it is the microbes…
Read Article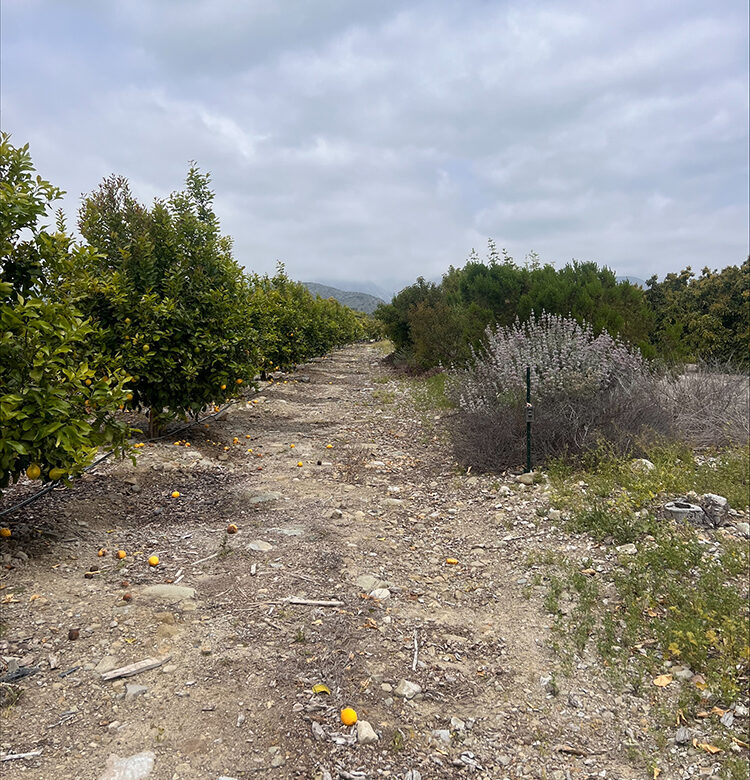
Invasive pests can wreak havoc on orchards, and keeping them in check often means frequent pesticide applications. With…
Read Article