
Utilizing lab data successfully comes down to knowing what is being measured and why. Take for example soil testing; there is a broad range of analyses. A Total Nutrient Digest uses strong acids to provide a combined (available and unavailable) total nutrient assay, whereas a Saturated Paste test utilizes no acid and provides insight on nutrients that are water soluble in solution. Both are soil tests but provide drastically different data based on the type of lab analyses performed. The relationship between the two types of soil tests is analogous to the differences between leaf tissue and sap analysis for plant nutrition assessment.
Leaf tissue testing (whole leaf or petiole) quantifies the total accumulated nutrients that are both available and unavailable inside the plant. Unavailable nutrients have been taken up and used to build the leaf and its cellular structures. Because this test is measuring the nutrient content of the entire leaf, the results are mostly illustrating what the nutrient status was during the growth and development of those tissues. Sap analysis is measuring the liquids actively flowing in the vascular tissues (xylem and phloem) and provides a near real-time assessment of the nutrients currently available in the plant.
Leaf tissue analysis is carried out by drying, heating and pulverizing tissue for consistency in size and then employing ashing and strong acids to create a total nutrient assay solution. Sap analysis only employes linear pressure to extract the sap but keep the integrity of the leaf with no leaf mastication, for a liquid sap extraction, no heat, acids or solvents are used in preparation of sap for analyses. Leaf sap analysis identifies mostly available nutrients located inside the xylem and phloem. Nutrients within the vascular bundle are not yet incorporated into the leaf structure. The proprietary sap extraction process used at NEWAGE Laboratories in South Haven, Mich. uses differing pressures for different crop types so as not to violate the integrity of the leaves and cellular structures.
With these two different types of leaf tests also comes differing sampling protocols. Leaf tissue samples are collected from a singular age of leaf and placed in a paper bag to facilitate dehydration. Sample dehydrating is a key component for tissue analysis but in so doing one loses the ability to assess nitrogen species such as nitrate or ammonium, as well as sugars, brix, pH and electrical conductivity. With sap analysis, it is critical to maintain the samples’ integrity from the moment leaves are removed from the plant. Protocols for sampling and handling are available to help ensure leaves maintain a condition of stasis (the least amount of moisture lost and low respiration until received by the lab). To alleviate this issue, NEWAGE provides an overnight shipping program and protocol to keep samples fresh all the way to the lab.
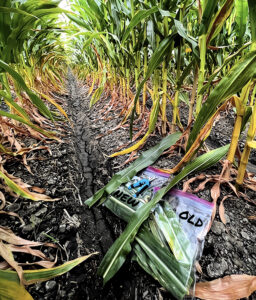
Sap samples are collected from both new and old age leaf sources and placed in separate plastic zip style locking bags in a cooler. Collecting a new yet fully formed leaf plus petiole and an old yet still viable leaf plus petiole sample set allows for plant nutrient uptake and mobility to be observed. Nutrient mobility assessment is something Leaf Tissue testing cannot offer though an important feature of sap analysis.
How to Analyze and Interpret Nutrient Mobility from Sap
Increased understanding of nutrient mobility from sap analysis can often identify nutrient deficiency, excess or toxicity long before any symptoms become visible. As an example, N, being highly phloem-mobile, will produce a deficiency symptom initially in the old leaves if the plant has been nitrogen deficient for a prolonged period. Old leaves start to turn yellow due to lack of chlorophyll synthesis. On a sap report, N deficiency is identified, many times long before visual symptoms occur, when higher amounts of N are measured in the new leaf than the old leaf, meaning the plant is remobilizing N from old leaves to meet the high demand in the new leaves when not enough N uptake is available. An excess of N is commonly identified in sap results as well. In an excess N condition, the sap report shows more N in the old leaves than in the new. When an excess of N is persistent in sap, this points to an area where fertilizer rates can be potentially decreased and production problems with pests and diseases associated with excess N can be avoided. This comparison of new vs old leaves is applicable to identify deficiencies and excesses of all phloem-mobile nutrients which include phosphorus, potassium, magnesium, chloride, sodium, molybdenum, nickel and, of course, N. The unique N information available from sap analysis also includes N conversion efficiency analysis, something unique to NEWAGE Labs’ sap analysis and again something not available from leaf tissue analysis.
Nitrogen Conversion
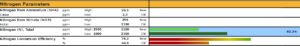
Consideration with N fertilization is the type of N being applied and how to measure it. Sap reports from NEWAGE have four N parameters to provide an enhanced picture of N uptake and its conversion, ultimately to more complex forms like amino acids and proteins. NEWAGE measures Total Nitrogen (all species of N in the plant), N in nitrate and N in ammonium and compares all three. To compare Total Nitrogen to the N in nitrate and ammonium, the oxygen in NO3 and hydrogen in NH4 need to be removed from the equation so they are directly comparable in terms of N concentration.
Now that the different forms of N have been normalized for the analysis, this apples-to-apples N comparison can be translated into an algebraic equation to solve for ‘x’. Total Nitrogen is the product, N in NH4 and N in NO3 are known values and x is the amino acids and proteins portion of this Nitrogen Conversion equation. NEWAGE Labs has labeled this as Nitrogen Conversion Efficiency % (NCE%). The NCE% provides insight on how N is converted inside the plant. If the NCE% is at or above 90%, it means 90% of total N being taken up by the plant is being converted to amino acids and/or proteins and 10% is staying in NO3 and/or NH4 forms. A 90% or higher conversation rate is the target. As seen in Table 1, see page 30 NCE% in new and old leaves are less than 80%, and there is more Total Nitrogen in the old leaves by >80%; therefore, the color code in the report is blue to indicate an excess condition. The plants from this example are potentially being overfertilized, and the nitrogen isn’t transforming well inside the plant, which can ultimately lead to increased diseases and pests, reduced grain or fruit quality (and fruit shelf life) and an undue burden on your fertility budget.
Quality of Data
When deciding which sap lab to work with, here are some laboratory attributes to evaluate that will have a direct bearing on the quality of the reports. These laboratory attributes to evaluate include:
- Report turnaround time
- Quality training
- Support of sample collection staff to ensure quality samples are collected, handled and shipped properly
- Sample transit time to the lab
- Report interpretation support and training
Easy-to-fill-out sample documentation is also important as a practical nutrient management tool. NEWAGE’s sample collection sheet is simple, capturing the essential information of collection date and time, field name, and who the sample was collected by. All this information is then transferred onto a NEWAGE report. With sap sampling it’s imperative the samples are kept cool to prevent N volatilization and degradation of the sample. If samples get too warm, usually by poor shipping, results of the 25 nutrient parameters NEWAGE analyses can be adversely affected. NEWAGE Labs’ overnight shipping decreases turnaround time to approximately 48 hours. Same-day sampling and shipping is recommended. If samples are held over to the next day for shipping, keep samples in refrigerator or cooler and let the air out of the plastic bags. Make sure samples do not freeze. When cellular structures burst, sap analysis is no longer a viable testing method. Leaves freeze mainly when samples are stored right up against a frozen gel back without a barrier between them like a paper towel or thin bubble wrap. Request a crop-specific sampling guide as how and when to sample are of great importance and impact data quality.
Leaf sap analysis is a tool to help growers make informed in season decisions by looking at nutrient uptake in greater detail using nutrient mobility and N conversion efficiency. Go to www.newagelaboratories.com or contact Info@newagelaboratories.com for more information.