


Beyond planting and harvesting techniques, precision involves understanding and management of the very foundation of agriculture: the soil. Recent research led by UC Riverside and USDA-ARS U. S. Salinity Laboratory scientists (Scudiero et al. 2024; Corwin et al. 2022) offer some new insights on the use of soil apparent electrical conductivity (ECa) sensors to characterize the spatial variability of soil texture, soil moisture, salinity and related soil properties in microirrigated orchards. Please reach out to the corresponding author of this article if you would like a copy of the research papers discussed here.
Knowledge of Average, Variation and Spatial Patterns of Soil Properties is Key
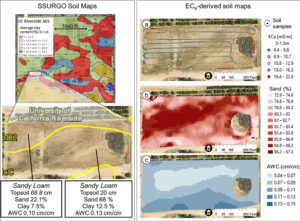
In this context, where to sample soil and trees for nutrient level or water status, where to install soil moisture sensors and where to collect yield measurements. Soil maps from the USDA Natural Resources Conservation Service (e.g., SSURGO maps) are an invaluable resource for landscape-scale analyses. They can be accessed and explored at https://casoilresource.lawr.ucdavis.edu/gmap/. Unfortunately, these maps were not created to support agricultural management at the sub-field scale. When accurate, higher-resolution field-scale maps are needed and there are no funds to take and analyze hundreds of soil cores, geospatial soil sensors such as ECa can come to the rescue. The use of ECa to direct soil sampling and map soil properties is well established. However, ECa is not a direct measurement of any agronomically relevant soil property; it is a measure of how well a soil can conduct electricity. Dennis Corwin and colleagues (see Corwin and Scudiero 2020) have developed field and laboratory protocols to obtain reliable ECa measurements and soil maps. One of the key recommendations in the protocols is that effectiveness of ECa measurements peaks in uniformly wet fields. In flood- and sprinkler-irrigated fields, this condition is easily met, which contributed to making ECa arguably the most popular on-the-go near-ground sensor in the U.S. and globally. Figure 1, see page 14 compares the SSURGO mapping units information for one 3.5-acre field at UC Riverside with high-resolution soil maps obtained from hundreds of georeferenced ECa measurements and 30 soil cores and lab analyses. Linear regression statistical models were used to “calibrate” the ECa measurements to estimate target soil properties across the whole field. The ECa-derived soil maps reveal a different spatial pattern of soil properties compared to the SSURGO maps as well as a generally wider range of sand content and available water capacity (AWC). Most importantly, the AWC values mapped at the site are overall substantially lower than the values reported in SSURGO.
Soil Moisture Rarely Uniform in Microirrigated Orchards
When done right, microirrigation delivers water only where desired and needed (i.e., where the tree roots are). At the beginning of irrigation, water content is usually very high near the emitters. Then, with time, water redistributes in depth and laterally. Lateral movement of water away from emitters is greater in finer-textured soils than in sandy soils. When salinity is present, salts are pushed downward and outward at the edges of the wetted soil volume. In contrast, soil in the alleyways (between the tree rows) is generally very dry unless it rains or during winter leaching irrigations. The typical ECa measurement setup has the sensor being dragged in a non-metallic sled behind a field vehicle. In orchards, that would therefore be in the middle of the alleyways, where the soil is generally too dry for making reliable ECa measurements.
What Happens if ECa is Surveyed Over Dry Alleyway Soils?
Chances are you will get an ECa survey that does not strongly correlate with the soil properties you intended to map. If the soil is too dry, electrical current may not find continuous pathways in a consistent manner through the soil (Scudiero et al. 2024). We took ECa measurements in a non-salt-affected drip-irrigated pistachio orchard (60 acres) in Lost Hills, Calif. both in the middle of the alleyways (around 10 ft away from the driplines) and along the driplines (1 foot away). The ECa measurements in the alleyways did not show reliable correlations with texture and water content. Conversely, ECa measured close to the driplines yielded significant correlations with soil moisture and texture in the topsoil and down to 5 ft.
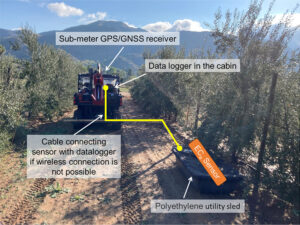
If the goal is to map soil physical properties that do not change over time such as texture and available water capacity, one of the solutions to the dry alleyway problem is to carry out ECa surveys after rain events when the soil profile is close to field capacity. If the goal is to monitor more dynamic properties, such as salinity, water content or nutrient availability, ECa should be measured close to the water emitters under the tree canopy. We developed the rig shown in Figure 2, see page 16 for carrying out such surveys. The electromagnetic induction sensor that measures ECa is housed in a polyethylene utility sled. An adjustable arm allows the sled to be towed to the side of the utility vehicle so ECa can be measured under tree canopies, a position that is otherwise largely inaccessible to vehicle-mounted sensors. The sensor communicates via Bluetooth or cable to a datalogger in the field vehicle cabin. A GPS or GNSS receiver is placed on top of the field vehicle cabin to reduce geopositioning interference from dense tree canopies. It is important to note GPS coordinates and corresponding sensor locations do not coincide. To calculate the actual coordinates of the soil sensor based on a fixed offset, Scudiero et al. (2024) presented a computer script for geospatial ECa data post-processing, which is available at https://github.com/usda-ars-ussl/sensoff. A Microsoft Excel spreadsheet to calculate the coordinate offset is also available and can be requested from the corresponding author of this article.
We tested the rig in a 1-acre navel orange orchard in Riverside, Calif. where around 250 ECa (0 to 1.5 m) measurements were taken along with 20 topsoil (0 to 0.4 m) soil samples (Scudiero et al. 2024). The ECa was used to map soil particle size fraction. For example, the silt content was mapped with a R2 of 0.72 and a Mean Absolute Error of 1.55 %.
Using a Similar Rig to Map Soil Salinity
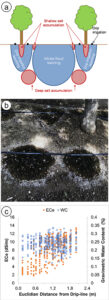
The short-scale changes of soil salinity from the microirrigated emitters and the edge of the wetted areas can be very large but are hard to capture with traditional soil sampling. Burt and colleagues (2003) characterized in detail the long-term salinity buildup on drip-irrigated/microirrigated trees in California (Figure 3a). Salinity buildup may often be seen on the soil surface at the edge of the areas wetted by the microirrigation emitters; see Figure 3b for an example in a drip-irrigated pistachio orchard in Fresno County. Corwin et al. (2022) presented a soil sampling protocol to reliably map soil salinity (ECe) from ECa surveys in microirrigated orchards. They present their recommended protocols using data from two pistachio sites in Lemoore, Calif. At each research site, they mapped ECa along the driplines. At 12 locations, they collected soil samples close to the dripline and out to 5 feet perpendicular from the dripline. Their survey was done days after irrigation and soil moisture was evenly distributed in the soil profile (Figure 3c). In contrast, ECe was low by the drip emitters and increased laterally and with depth (Figure 3c). Because of this short-scale variation in salinity, ECa was not correlated with the cores taken by the dripline (R2= 0.25; poor model performance). By averaging the soil cores collected by the dripline and 5 feet away from it, ECa’s correlation to soil salinity was much stronger (R2=0.73). Sampling by the dripline and 5 feet away from the dripline (i.e., at the edge of the root zone) provided the best “root zone” salinity average estimation. Mixing the two soil cores can make soil analyses cheaper.
Data Fusion Between ECa and Gamma-Ray Spectrometry
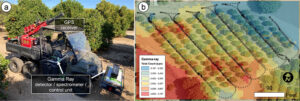
Researchers have utilized various geospatial sensor data, such as soil penetrometry, visible and near-infrared sensors and gamma-ray (γ-ray) spectrometry, either as independent sensing methods or in combination with ECa for a detailed understanding of soil variability and soil-plant interactions. Gamma-ray spectrometers detect radiation from soil, emanating from natural radioisotopes of elements like potassium, cesium, thorium and uranium (Figure 4). This technology has proven effective in creating accurate high-resolution maps of soil surface texture and clay mineralogy. While γ-ray spectrometry is generally employed for surveying the soil surface (usually the top few centimeters), under specific conditions, such as dry soil, it can assess soil profiles up to a depth of 1 meter. In dry soil conditions, which are less suitable for ECa measurements but ideal for γ-ray spectrometry, a 1% increase in soil moisture typically leads to an almost equivalent decrease in γ-ray emission from the soil. In microirrigated orchards, combining ECa data from the driplines with γ-ray data from these alleyways offers a promising approach to accurately assess soil spatial variability in such agricultural setups. We tested this fusion of ECa measured along the driplines and γ-ray total counts (TC) measured in the dry alleyways at a sandy loam citrus orchard in Riverside, Calif. (Scudiero et al. 2024). The study aimed to characterize field-scale soil particle size fraction spatial variability within the top 0.4 m of the soil profile. Significant Pearson correlation coefficients were found between sand and silt content with both ECa and TC. The results show a strong positive relationship between TC and clay content and negative with sand content. In particular, sand content was mapped with a very low mean absolute error (3.06%). These results indicated the ECa measurements obtained with the mobile platform were accurate and that both ECa and TC were effective predictors for soil texture spatial variability in non-salt-affected soils.
The integration of ECa and gamma-ray sensing technologies provides a robust and innovative approach to soil characterization in micro-irrigated orchard systems (Scudiero et al. 2024). If you can easily access the under-canopy space where the soil is moist, on-the-go ECa will be a good choice to map many soil properties. Otherwise, you may have to wait for abundant rains or resort to the use of γ-ray spectrometry in the alleyways. However, when salinity is a concern, there is no alternative to mapping the soil along the drip lines. Do not expect reliable soil salinity maps otherwise! The findings of Corwin et al. (2022) have significant practical implications for managing salinity in microirrigated orchards: ECa measurements should be calibrated with soil salinity measured in the entire rootzone, not just at a core by the dripline. Corwin et al.’s improved ECa-directed soil sampling guidelines offer a more accurate and representative measure of the soil salinity profile, which is critical for orchards with drip irrigation systems. We encourage crop consultants and practitioners in the field of precision agriculture to consider these advanced soil characterization techniques. Their adoption could significantly enhance the effectiveness of irrigation practices in microirrigated orchards, leading to more sustainable and productive agricultural outcomes.
References
Burt, C.M., Isbell, B. and Burt, L., 2003, November. Long-term salinity buildup on drip/micro-irrigated trees in California. In Proc. Irrigation Assoc. Tech. Conf (pp. 46-56).
Corwin, D.L., Scudiero, E., Zaccaria, D., 2022. Modified ECa – ECe protocols for mapping soil salinity under micro-irrigation. Agricultural Water Management 269, 107640. https://doi.org/10.1016/j.agwat.2022.107640.
Corwin, D.L., Scudiero, E., 2020. Field-scale apparent soil electrical conductivity. Soil Science Society of America Journal 84, 1405-1441. https://doi.org/10.1002/saj2.20153.
Scudiero, E., Corwin, D.L., Markley, P.T., Pourreza, A., Rounsaville, T., Bughici, T., Skaggs, T.H., 2024. A system for concurrent on-the-go soil apparent electrical conductivity and gamma-ray sensing in micro-irrigated orchards. Soil and Tillage Research 235, 105899. https://doi.org/10.1016/j.still.2023.105899.


 Invading California")

