A field demonstration of mechanized vineyard pruning at the Kearney Agriculture Research and Education Center. Transitioning existing vineyards to a single high wire system has been most successful for mechanized pruning, reports Fresno County UCCE farm advisor George Zhuang (photo courtesy G. Zhuang.)
Mechanical pruning operations continue to increase in San Joaquin Valley wine grape vineyards as a way to save on labor costs. Dormant pruning, suckering and leaf removal in vineyards can all be done mechanically.
George Zhuang, UCCE viticulture farm advisor in Fresno County, in a presentation at the San Joaquin Valley virtual Grape Symposium, said existing trellis systems in vineyards can be converted to mechanical pruning systems and retain production and fruit quality.
The most common trellis systems in San Joaquin Valley wine grape vineyards have been two-wire bilateral cordon, “California sprawl,” and quadrilateral, and both can be adapted to mechanized pruning, Zhuang said. The single high wire system is the standard system for mechanization.
Recent trials have looked at differences in cordon height and how that affects vineyard production. Transitioning existing vineyards to a single high wire system has been most successful for mechanized pruning operations. This trellis system has a single high wire at 62 to 66 inches in height, is single canopy, non-shoot positioned and has around 35% exposed leaf area. Production is at 18 to 24 months and yields are 11 to 24 tons per acre with 7×10-foot spacing.
Zhuang said the other trellis system in use in vineyards where mechanized pruning is done is the quadrilateral. This system has a divided canopy and a higher percentage of exposed leaf area. Production depends on variety and spacing of vines.
Setting up the box size is important in mechanized pruning. The spur height sets the height of the bearing surface. Precision pruning is four inches, while 6- and 8-inch set ups may require some hand pruning to keep from overloading the vines as the bearing surface increases.
Two Fresno county trials were done to compare single wire height in trellis systems for winegrapes. Vines were planted in 2017 and hand pruned the first year of production in 2019. In 2020, vines were mechanically pruned. Heights tested were 68-inch cordon and 52-inch, the classic “California Sprawl” height. First yields were comparable in both systems. Sugar (measured by Brix) was increased in the high wire system due to more leaf area, Zhuang said. Water use was lower in the higher wire system.
He said the trial would continue to determine if there are significant differences as the vines mature.
Availability of mechanical pruning custom operators may be a limiting factor going forward. The machinery is a significant investment more suitable for larger acreages. Smaller growers would need to hire a custom operator. Zhuang said he has seen efforts by winegrape growers to design and build their own pruning machinery.
At least four species of garlic bulb rots have been recovered from samples submitted to UCCE researchers by garlic growers. Fusarium proliferatum has been the most common, being recovered from all storage facilities and farms (photo courtesy T. Turini.)
Lesions on garlic cloves, which affect crop quality, have been associated with several species of Fusarium, said Tom Turini, UCCE vegetable crops farm advisor. Similar garlic diseases caused by this soilborne fungus were reported in other production areas, but recent studies investigating this issue in Central California until now have not been conducted.
The Fresno County 2019 crop report noted that 24,180 acres of garlic were harvested that year, making garlic one of the higher acreage vegetable crops in the county. In addition, the 2018-19 CDFA Agricultural Statistics Review documents that more than 80% of the garlic produced in the state was in Fresno County based on gross crop value.
Turini is working with UC Davis plant pathology specialist Cassandra Swett, who is receiving samples collected from fields and those submitted by growers and processors. In 2020, Swett ran tests to identify the Fusarium species associated with the clove lesions. The work planned for this growing season should provide a robust set of detailed information regarding the identity of the fungus responsible for the crop damage.
Swett reported that at least four species of garlic bulb rots have been recovered from samples submitted. Fusarium proliferatum has been the most common, being recovered from all storage facilities and farms. F. oxysporum and F. falciforme are also common, present in about 50% of farms or facilities. These three species have been confirmed to be capable of causing a clove rot in preliminary trials.
proliferatum is the only species found occurring alone, suggesting it might be the primary driver of bulb rot. A fourth species, F. brachygibbosum, was also found and is being tested for pathogenicity. Neither this species nor F. falciforme have previously been described as garlic pathogens. Swett said that with multiple species causing garlic bulb rot, it will be critical to identify strategies that can co-manage all species. Understanding when and how infections are occurring can help with identifying critical target periods for control.
Garlic bulb rots are not a new issue in garlic production, Turini said. Fusarium was previously associated with garlic rot in the Fresno production area and the fungus was considered ubiquitous. Current observations are that the issue is more common, and the character of the symptoms is not identical to those described decades ago. The work in progress will provide insight into what fungi are involved in the disease and other details critical in taking reasonable steps to mitigate the damage.
Research is ongoing to find the best strategies for material applications that help walnut trees overcome warmer winters (photo by C. Parsons.)
Walnut varieties with higher chill requirements during winter dormancy may be facing production challenges in the future. Climate prediction models are showing the amount of winter chill needed by trees may not be achievable every year.
UCCE Orchard Systems Advisor Katherine Jarvis-Shean said walnut varieties, including Chandler, might need some help to achieve a robust leaf-out in the spring. Research is ongoing to find the best strategies for material applications that help walnut trees overcome warmer winters.
Growers need to become familiar with the UC Davis Fruits and Nuts research on chill portions in preparation for warmer winters in the future, Jarvis-Shean said. Chill hour calculations differ from the newer chill portions models. Information on chill hours and portions can be found here.
Climate prediction models show that the amount of chill needed by walnut trees may not be achievable every year. A regional look at climate prediction models show more warming than cooling. There will still be variability, Jarvis-Shean said, but there will be more low-chill winters and more winters with lower chill than what is now experienced. By mid-century, the models are predicting less chill in the southern San Joaquin Valley than is necessary for the Chandler variety.
Research done over the last 30 years shows that dormancy is influenced by a number of factors, including hormones, transport capacity, oxidative stress and metabolism. Budbreak in the spring is normally preceded by a big upswing in starch production. Warm winters cause trees to lower their starch production and keep sugar levels stable. After trees make this adjustment, Jarvis-Shean said, they need more heat than normal in the spring to achieve high starch pre-budbreak.
Effects of a low-chill winter on walnut trees become apparent at leaf-out. Some buds don’t break, resulting in fewer flowers. A wider maturity window means there will be size variability in nuts. Early setting nuts are larger, taking up the available carbohydrates, and leaving later-maturing nuts much smaller.
Dormancy-breaking chemicals that can stimulate the hormone, transport capacity, oxidative stress and metabolism systems are under study to determine if their use can compensate for lower winter chill. Joint UC ANR/UC Davis studies are looking at applications of hydrogen cyanamide, also known as Dormex, a nitrogen cocktail and hormone analogue, over a couple of winters to understand how trees respond to treatments and to achieve consistent results.
Roof rat damage in citrus can vary depending on the variety. Extensive girdling has been observed in Lisbon lemons (photo courtesy UCCE.)
Invasive roof rats are causing damage in citrus orchards throughout California.
Kern and Tulare counties are sites of roof rat infestations in citrus as well as Southern California citrus growing regions. Once a population of roof rats becomes established, they can be found throughout an orchard, girdling tree branches and damaging fruit.
Roger Baldwin, UCCE wildlife specialist, said a multi-year study is underway to develop management strategies for roof rats, which are causing significant damage in a number of tree nut and fruit crops.
Roof rats are active year-round, building nests in citrus trees or burrows near the base of the trees. They forage away from their burrows, and signs of activity are sometimes difficult to see. Their burrows are about 1.5 to 2 inches in diameter, distinguishing them from ground squirrels.
Baldwin said roof rat activity may vary depending on the variety of citrus. In Meyer lemon, for example, he said rats have been found to eat the rind and leave the fruit. Extensive girdling of tree branches has also been observed in Lisbon lemon, but little branch girdling and more extensive fruit damage in navel orange. In navels, rats chew holes in the rind, eat the fruit and leave a shell behind. Another sign of a rat infestation, in orchards with snail populations, is piles of empty snail shells.
Baldwin said the UC study would be focused on cost-effective methods of control, including rodenticides and traps. He said the new A24 trap on the market, which use lures and CO2 cartridges triggered by rat activity, may save labor costs. However, these traps have not been tested in ag fields, so their efficacy is currently unknown. Rodenticides are another alternative, but restrictions may limit use. Diphacinone grain can be used, but bait stations are more effective when placed in trees rather than on the ground. Bait is also less likely to be eaten by non-target animals when placed up in the tree.
UC researchers plan to study rat movement patterns in orchards, which will help them test efficacy of management tools. Growers interested in participating in the study should contact UC research associate Ryan Meinerz at rmeinerz@ucdavis.edu for more information. More information on controlling roof rats can be found at UC ANR publication 8513, Managing Roof Rats and Deer Mice in Nut and Fruit Orchards.
Branched broomrape attaches to the root of a host plant, extracting water and nutrients. Methyl bromide was used to eradicate this weed in the past. Work is being done to find new control methods (photo courtesy G. Miyao, UCCE retired.)
The ‘delicate’ issue of reporting branched broomrape infested tomato fields continues in California.
Infestations of this parasitic weed in tomato fields can severely decrease yields because the weed attaches to tomato plant roots and extracts water and nutrients.
Gene Miyao, retired UCCE farm advisor from Yolo, Solano and Sacramento counties, said control options for branched broomrape are limited and expensive. The potential exists for spread of branched broomrape from field to field via equipment and field workers. Severe infestations of this weed occurred in Sacramento County in 1959. The California processing tomato industry responded with funding to begin an eradication effort which lasted for two decades. The program ended with successful control of the broomrape weed. Eradication was possible with the use of the fumigant methyl bromide.
Branched broomrape is classified in California as an “A” pest, an organism of known economic importance,and is subject to enforced action, including eradication, quarantine, regulation, containment, rejection or other holding action.
Extent of the branched broomrape infestation in tomato fields is not fully known, Miyao said. It has been reported in several tomato fields north of Stockton in recent years. Consequences of reporting an infestation to a county agricultural commissioner is complete loss of the crop without harvest within the infested area of the field. Miyao said not reporting an infestation also has consequences. At risk is the likelihood of increased spread of this weed and further crop loss in the future.
Research by UCCE weed specialist Brad Hanson found that emergence of broomrape occurs during early tomato fruit set and continues over a 10-week period. Attempts to hand weed broomrape can reduce the problem as it prevents seed production, but the weeding crew must carefully bag all shoots and stay out of uninfested parts of the field to contain the spread via seed. The hand removal must continue almost weekly for an extended period. Branched broomrape produces large amounts of tiny seeds, and seed set occurs within a week of emergence. Shoots of this weed are often hidden by the tomato plants and can go undetected.
Miyao said a grower who chooses to knowingly harvest through a broomrape-infested area will spread the seed down the row and will risk spreading seed across the field including into other fields. A grower who unknowingly harvests through an infestation is equally at risk.
The California Tomato Research Institute sponsored an herbicide trial to control branched broomrape in tomatoes. The trial in an infested field used two herbicides not currently registered for use in California. Compared to a successful Israeli program, it has not been as effective in the California trial. The herbicide rates and timing will be modified in the 2021 season. Miyao said this control program would be helpful, but if even a small percentage of the weed escapes, the seed bank in the soil will increase.
Miyao said an effort to eradicate this weed while the number of impacted acres is limited would be more cost effective than waiting until the infestation is widespread. The issue for the California processing tomato industry is that CDFA rates branched broomrape as a class “A” pest, which creates the ‘quarantine-like’ conditions of a no-harvest. Allowing the weed to not be under CDFA regulation could potentially cause substantial crop loss from this parasitic weed without an adequate control program.
Vine mealybug are the main mealybug species causing economic damage in California vineyards (photo courtesy Stephanie Bolton, Lodi Winegrape Commission.)
Control of vine mealybug (VMB) in grapevine continues to be stymied by this pest’s ability to take refuge underneath bark of the grapevine trunk and below the ground.
Kent Daane, UC pest management specialist, in a presentation for the San Joaquin Valley Virtual Grape Symposium, explained how VMB infestations persist in spite of insecticide applications and healthy parasitoid populations.
Daane said VMB is the worst invasive mealybug species due to its potential for causing extensive crop damage. Highly prolific and present year round in most California grape growing regions, VMB produces copious amounts of honeydew, causing vine defoliation and making fruit clusters unmarketable. VMB is also known to transmit viruses.
Vine trunks, roots and canes all provide protection for VMB from contact insecticides and natural enemies. In addition, ants drawn by honeydew will tend mealybug, kill parasites and remove honeydew from VMB hiding places. Knockdown of VMB on leaves with newer systemic materials can be achieved, Daane said, but population densities make complete control difficult.
Mating disruption may help control VMB, but the populations that persist under the bark remain an issue.
Trials using organic production approved materials showed they were only effective on contact, leaving the population hidden under the bark and below ground to grow.
In the San Joaquin Valley, systemic insecticides Movento and Applaud were effective on exposed areas of the vines, but left the hidden population. Daane explained that VMB infestations are clumped in that they start small in a few places that are difficult to find. It may be more cost-effective to spot spray where an infestation is found rather than treating an entire block.
Parasitoids have provided some control, but mainly on exposed areas. They cannot parasitize VMB under bark and can be killed by ants. Ants in vineyards aid VMB by not only removing honeydew, but making underground habitat available during periods of high temperatures.
There are strategies being developed to reach VMB populations under bark of the trunk and underground, Daane said, but they are expensive. Spot spraying of systemic insecticides is one alternative. Girdling the trunks can expose VMB and applications of tanglefoot directly on the exposed population is being studied. Barriers with insecticides placed around the trunk have also been tried to slow the movement of crawlers. Flaming the bark is another control tactic that is being studied.
Another study is the use of nematodes to impact VMB populations on the roots.
Figure 1: Holistic management tools that help improve soil structure and soil quality includes physical and chemical controls (Part I in this article series) and biological controls (Part 2).
You may have heard or read about improving your soil health or soil quality over the last year as this area of field management gains more attention. But what exactly do the terms mean and how can you incorporate the concepts in your day-to-day soil management practices? In Part 1 of this article series, the physical and chemical connection to optimizing soil quality by focusing on the structure of your soil will be explored.
Soil Quality and Health
Soil quality has broad application to your farm. It refers to how well a soil functions physically, chemically and biologically and how well it does its “job” (Fig. 1, page 6). For example, a forest soil has a different job than a farm soil, and soil properties can be measured on how well the soil is performing (e.g. soil structure).
Many factors influence the soil quality on a farm and are summed up in Figure 2, on page 7. In this article, the focus will be on the physical and chemical management practices that maximize soil quality, expressed here as soil structure (Fig. 3).
Soil health refers to the interaction between organisms and their environment in a soil ecosystem concept and the properties provided by such interactions (e.g. ecosystem stability). When you think of soil health, think of the biological integrity of your field (e.g. microbial population and diversity) and a focus on supporting plant growth. This will be the focus of Part 2 of this article series.
Poor soil structure and the resulting decrease in soil quality continues to impact yields in many farming areas. This is because many factors can negatively impact soil structure, including soil compaction from field equipment, poor salinity management, rainfall and irrigation droplets, excessive tillage, etc. Fortunately, fields that have poor structure (see Fig. 3 for a visual reference) can be fixed once you determine what is causing the issue. I strongly recommend that you put your field detective hat on and work with your favorite Certified Crop Adviser (CCA) to diagnose why your field is not performing as expected.
Figure 2: Crop productivity is influenced by several interrelated concepts, which have an impact on the soil quality of a field (courtesy K. Wyant.)
Physical Controls
Physical and chemical management strategies are important to help reverse poor soil structure and thus improve the overall soil quality of your field.
The physical controls on soil structure generally relate to reducing disturbance to the soil and protecting the soil from future disturbance. With this broad mandate, there are a variety of techniques out there to accomplish this goal and help restore soil structure, but reducing tillage and incorporating cover crops into the growing operation are the most important.
Tillage Practices and Soil Structure
Field activities like tillage are crucial for any successful growing season, whether in the short term or long term. However, excessive tillage can be hard on your soil structure as common implements can slice, compact or crush soil aggregates and quickly change a soil from having excellent tilth (see right side of Fig. 3) to one that lacks those properties (see left side of Fig. 3). The physical destruction of aggregates can have an immediate impact on your soil quality and can impact your operation’s bottom line. Fortunately, there are many modern options for avoiding excessive tillage, including conservation tillage and residue management, strip tillage and even a complete elimination of the practice (no-till). Every operation is different, and changes in tillage need to take local growing practices into account before moving forward. Reducing tillage has been shown to improve soil structure and soil quality; however, pulling it off can be tricky. It is worth noting that some tillage can be beneficial (e.g. deep ripping of hard pans) but should be employed only when necessary to help avoid impacts on soil structure.
Cover Crops
This concept is related to keeping the soil covered and physically protected from disturbance into the future after the crop is planted. The cover crop, usually grown in between the rows of permanent crops (e.g. trees and vines) or in the ‘off-season’ for annual crops, can be used to shield the soil from wind and water erosion and also help open up soils that have a history of poor soil structure. Briefly, the canopy of a cover crop can intercept and slow the velocity of raindrops and break up wind gusts, which helps keep soil on the field.
Belowground, the root systems of cover crops can poke through clods and hard pans and help open up channels in the soil profile to help move water downward into the profile. Fine root hairs can also tie soil particles together, improving soil structure and quality.
Please contact your preferred CCA for more advice on tillage practices and cover crop selection and to see if it fits into your farming operation.
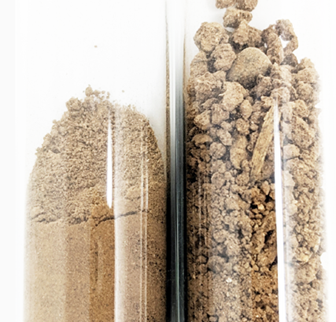
Figure 3: The soil on the left has poor soil structure while the soil on the right has excellent aggregation and structure. As a result, the two fields have substantial differences in soil quality and their ability to support optimized crop growth (photo courtesy K. Wyant.)
Chemical Controls
A common issue in fields that have poor soil structure and soil quality is related to a chemical relationship in the soil. A loss of soil structure due to a mismatch between soil structure, calcium and other elements is called deflocculation. Under normal conditions, soil particles with ample calcium naturally come together to form aggregates, which improves soil structure. When the calcium is displaced by other ions (e.g. sodium), the soil structure collapses, and soil quality can quickly deteriorate. One of the main goals of a chemical remediation program is to provide more calcium to the soil, thus reversing the collapse in soil structure and driving an improvement in soil quality. The question is, “Which calcium amendment do I use?”
I cannot stress enough the need to start your program with a soil sample and to utilize the experienced advice from a CCA. Taking a soil sample will help you figure out the following important parameters critical to your chemical program: 1) Which amendment to use (e.g. gypsum, lime, sulfur product); and 2) Dosage of correct amendment to apply.
Critical parameters on the soil report worth looking at are soil pH, fizz test results, EC (dS/m), SAR, sodium and chloride results. For example, the fizz test measures the amount of free lime in a soil (CaCO3), and this is either expressed qualitatively (low, high, etc.) or quantitatively (%). There are a few major bulk calcium amendments that are available to help restore your soil structure: lime, gypsum and sulfur products.
Lime
Lime (CaCO3) is commonly used in soils that are acidic with soil structural issues and should not be confused with ‘free lime’ that shows up on a soil test report. Lime can provide a calcium source while also neutralizing acidic soil pH. Thus, soil quality can be improved on two separate fronts (soil structure and soil pH) with one program. Calculating the liming rate for a field (lbs/acre) can be tricky since you have to factor in both the amount of calcium needed to fix your soil structure problem and the amount needed to adjust the pH. A good soil sample and an experienced CCA can help determine the optimum rate for your field.
Gypsum
Gypsum (CaSO4) is a calcium amendment when one has low or very low fizz test readings. This is one reason why I recommend that you start your program with a soil test. When gypsum dissolves, it can supply calcium directly to the soil, which improves soil structure and allows excess salts (e.g. sodium) to drain. However, unlike lime and sulfur products, gypsum will have little impact on soil pH and should only be used to provide calcium to help restore soil structure and soil quality. An experienced CCA can help interpret your soil test and provide a reasonable gypsum recommendation (lbs/acre) to fix the issue.
Sulfur Products
Sulfur products, such as sulfuric acid and elemental sulfur, require the presence of free lime in the soil (CaCO3). As such, soils that have medium to very high fizz test ratings are a great candidate for the use of sulfur products in your chemical reclamation program. Briefly, sulfur products react with the free lime in the soil to create gypsum as a by-product. The calcium in the gypsum is then able to go to work to improve soil structure. One advantage of using sulfur products is that you generally do not need as much material to get the job done as you do with gypsum (1 ton gypsum = 0.57 tons sulfuric acid = 0.19 tons elemental sulfur), which can impact field logistics and application costs.
Also, repeated applications of sulfur products can reduce problematic soil pH areas by moving the soil pH from alkaline to neutral. One disadvantage to using sulfur products is that they have several reaction steps that can slow the reclamation speed of the field relative to lime and gypsum. Also, sulfuric acid products present some safety concerns that must be considered from a worker safety and transport level. Like lime and gypsum, an experienced CCA can help interpret your soil test and provide a reasonable recommendation (lbs/acre) to fix the issue.
Conclusion
Physical and chemical factors can have a profound impact on your overall soil structure and, thus, the soil quality of your field. Generally, poorly structured soils have a difficult time supporting optimized crop growth due to the severe reduction in water storage capacity, low oxygen, surface crusting and seed bed issues, accumulation of salinity, etc. If your soil looks like the example on the left side of Figure 3, it may be well worth your time and money to start implementing soil improvement practices as outlined in this article. You have a variety of management options, including the implementation of practices that improve the physical components of soil quality (e.g. tillage reduction and use of cover crops) or the chemical components such as adding bulk calcium amendments to your program. A bit of detective work beforehand determining why your field is having a soil structure problem can pay off in turning your field around and using your input dollars most effectively.
In Part 2 of this article series, we explore the biological components that influence soil structure and soil health. We will define soil health and go through plenty of examples on how the living component of a soil can impact your soil structure and overall soil quality. Furthermore, we will discuss how to test for soil health in the field.
Botrytis gray mold in trials at the UC Shafter Research Station (all photos by S. Dara.)
Strawberry is a high-value specialty crop in California and is susceptible to multiple pathogens that infect roots, crowns, foliage, flowers and fruits. Verticillium wilt caused by Verticillium dahliae, Fusarium wilt caused by Fusarium oxysporum f. sp. fragariae and Macrophomina crown rot or charcoal rot caused by Macrophomina phaseolina are major soilborne diseases that cause significant losses if they were not controlled effectively. Chemical fumigation, crop rotation with broccoli, nutrient and irrigation management to minimize plant stress and non-chemical soil disinfestation are usual control strategies for these diseases. Botrytis fruit rot or gray mold caused by Botrytis cineaea is a common flower and fruit disease requiring frequent fungicidal applications. Propagules of gray mold fungus survive in the soil and infect flowers and fruits. A study was conducted to evaluate the impact of drip application of various fungicides on improving strawberry health and enhancing fruit yields.
Propagules of gray mold fungus survive in the soil and infect flowers and fruits.
Methodology
This study was conducted in an experimental strawberry field at the Shafter Research Station in fall-planted strawberry during 2019-2020. Cultivar San Andreas was planted on October 28, 2019. No pre-plant fertilizer application was made in this non-fumigated field which had Fusarium wilt, Macrophomina crown rot and Botrytis fruit rot in the previous year’s strawberry planting.
Both soilborne diseases were present throughout the field during late spring 2019 with symptoms of wilt or crown rot appearing in many plants. In the current study, each treatment was applied to a 300-foot-long bed with single drip tape in the center and two rows of strawberry plants. Sprinkler irrigation was provided immediately after planting along with drip irrigation, which was provided one or more times weekly as needed for the rest of the experimental period.
Each bed was divided into six 30-foot-long plots, representing replications, with an 18-foot buffer in between. Between November 6, 2019 and May 9, 2020, 1.88 qt of 20-10-0 (a combination of 32-0-0 urea ammonium nitrate and 10-34-0 ammonium phosphate) and 1.32 qt of potassium thiosulfate w ere applied 20 times at weekly intervals through fertigation. Treatments were applied either as a transplant dip or through the drip system using a Dosatron fertilizer injector (model number D14MZ2). The following treatments were evaluated in this study:
Untreated control: Neither transplants nor the planted crop was treated with any fungicides.
Abound transplant dip: Transplants were dipped in 7 fl oz of Abound (azoxystrobin) fungicide in 100 gal of water for four minutes immediately prior to planting. Transplant dip in a fungicide is practiced by several growers to protect the crop from fungal diseases.
Rhyme: Applied Rhyme (flutriafol) at 7 fl oz/ac immediately after and 30, 60 and 90 days after planting through the drip system.
Velum Prime with Switch: Applied Velum Prime (fluopyram) at 6.5 fl oz/ac 14 and 28 days after planting followed by Switch 62.5 WG (cyprodinil + fludioxinil) at 14 oz/ac 42 days after planting through the drip system.
Rhyme with Switch: Four applications of Rhyme at 7 fl oz/ac were made 14, 28, 56, and 70 days after planting with a single application of Switch 62.5 WG 42 days after planting through the drip system.
Parameters observed during the study included leaf chlorophyll and leaf nitrogen (with chlorophyll meter) in February and May; fruit sugar (with refractometer) in May; fruit firmness (with penetrometer) in April and May; severity of gray mold twice in March and once in May; other fruit diseases (mucor fruit rot caused by Mucor spp. and Rhizopus fruit rot caused by Rhizopus spp.) once in May, three and five days after harvest (on a scale of 0 to 4 where 0=no infection; 1=1-25%, 2=26-50%, 3=51-75% and 4=76-100% fungal growth); and fruit yield per plant from 11 weekly harvests between March 11, 2020 and May 14, 2020. Leaf chlorophyll and nitrogen data for the Abound dip treatment were not collected in February. Data were analyzed using analysis of variance in Statistix software and significant means were separated using the Least Significant Difference test.
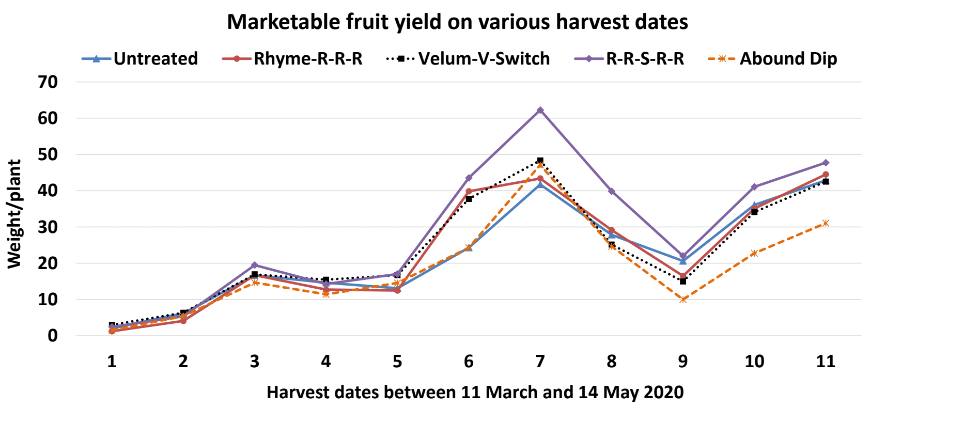
Fruit yield per plant from 11 weekly harvests between March 11, 2020 and May 14, 2020.
Results and Discussion
Leaf chlorophyll content was significantly higher in plants that received drip application of fungicides compared to untreated plants in February while leaf nitrogen content was significantly higher in the same treatments during the May observation. There were no differences in fruit sugar or average fruit firmness among the treatments.
The average gray mold severity from three harvest dates was low and did not statistically differ among the treatments. However, the severity of other diseases was significantly different among various treatments with the lowest rating in Abound transplant dip on both three and five days after harvest and only three days after harvest in plants that received four applications of Rhyme. Unlike the previous year, visible symptoms of the soilborne diseases were not seen during the study period to evaluate the impact of the treatments. However, there were significant differences among treatments for the marketable fruit yield.
Leaf chlorophyll and nitrogen content between February 4, 2020 and May, 15 2020.
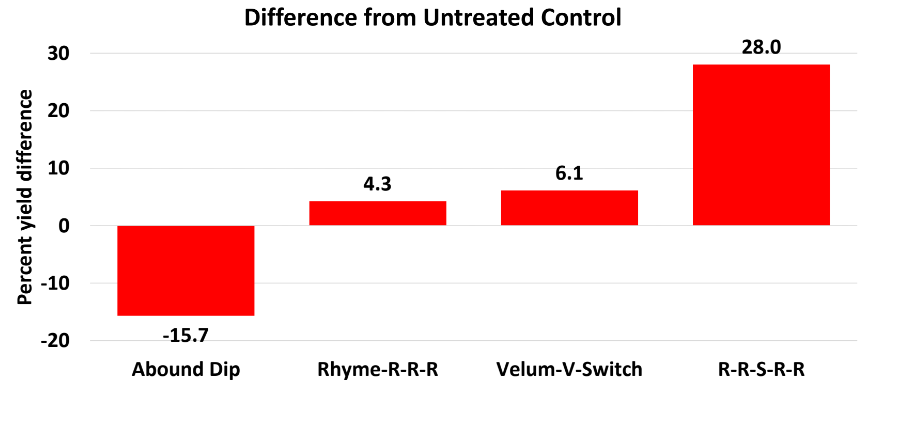
The highest marketable yield was observed in the treatment that received Rhyme and Switch followed by Velum Prime and Switch and Rhyme alone. The lowest fruit yield was observed in Abound dip treatment. Unmarketable fruit (deformed or diseased) yield was similar among the treatments. Compared to the untreated control, Abound dip resulted in 16% less marketable yield and such a negative impact from transplant dip in fungicides has been seen in other studies (Dara and Peck, 2017 and 2018; Dara, 2020). Marketable fruit yield was 4% to 28% higher where fungicides were applied to the soil. Although visible symptoms of soilborne diseases were absent during the study, periodic drip application of the fungicides probably suppressed the fungal inocula and associated stress and might have contributed to increased yields. The direct impact of fungicide treatments on soilborne pathogens was, however, not clear in this study due to the lack of disease symptoms.
Considering the cost of chemical fumigation or soil disinfestation and the environmental impact of chemical fumigation, treating the soil with fungicides can be an economical option if they are effective. While this study presents some preliminary data, additional studies in non-fumigated fields in the presence of pathogens are necessary to consider soil fungicide treatment as a control option.
Marketable fruit yield on various harvest dates. Marketable yield was 4% to 28% higher where fungicides were applied to the soil with the exception of Abound dip, which resulted in 16% less marketable yield.
Acknowledgments
Thanks to FMC for funding this study and Marjan Heidarian Dehkordi and Tamas Zold for their technical assistance.
Dara, S. K. and D. Peck. 2017. Evaluating beneficial microbe-based products for their impact on strawberry plant growth, health, and fruit yield. UCANR eJournal of Entomology and Biologicals. https://ucanr.edu/blogs/blogcore/postdetail.cfm?postnum=25122.
Dara, S. K. and D. Peck. 2018. Evaluation of additive, soil amendment, and biostimulant products in Santa Maria strawberry. CAPCA Adviser, 21 (5): 44-50.
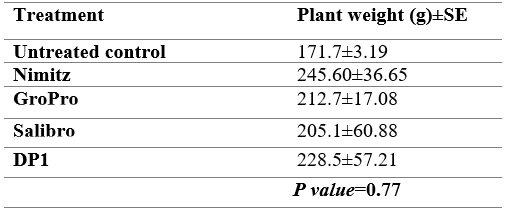
Melon nematicide trial 30 days after transplanting. (all photos courtesy J. Sidhu.)
California is one the largest producers of melons in the U.S., and melons most commonly grown in California are cantaloupes and honeydew types. Although some acreage is reported throughout the state, most are grown in the Southern desert valleys and San Joaquin Valley. Root-knot nematodes (RKN), Meloidogyne spp., are the most significant plant parasitic nematodes affecting melon production in California, especially in light-texture soils. The nematodes are widespread in Central and Southern California.
Damage results from feeding of second stage juveniles (J2) inside melon roots, and the roots respond to nematode invasion by formation of root galls. Nematode-infested plants become stunted and less vigorous with severe galling of roots. Deformed roots due to galls are unable to sustain the water and nutrient needs of the plant in hot weather, leading to wilting and poor growth of plants, reduced yield and poor fruit quality. Nematode-infested plants may also become more vulnerable to other soilborne pathogens.
Currently, there are no resistant cultivars in melons, and RKN management has mainly relied on the use of preplant soil fumigants and soil-applied nematicides. Management with these products is expensive and involves safety and environmental risks. New fumigant regulations by the Department of Pesticide Regulations (DPR) have been put in place to restrict the emissions of volatile organic compounds from the use of soil fumigants. These regulations include limits on the amount of soil fumigants a grower is allowed to use in a year, caps on the amounts allowed within a township and new expanded buffer zones, meaning large parts of a field may not be treated all. These new regulations by DPR may mean that there will be some fields not treated for nematodes because of caps placed on the amount a grower is allowed to use or caps on the amount of fumigants allowed in a township.
Alternative control options that have high efficacy, are economically viable and environmentally safe need to be evaluated under field situations. The goal of this project was to evaluate the efficacy of Salibro, an organic product and a developmental product (DP1) in comparison to Nimitz (fluensulfone) in melons applied through deep-buried drip tube. Nimitz is registered on melons in California.
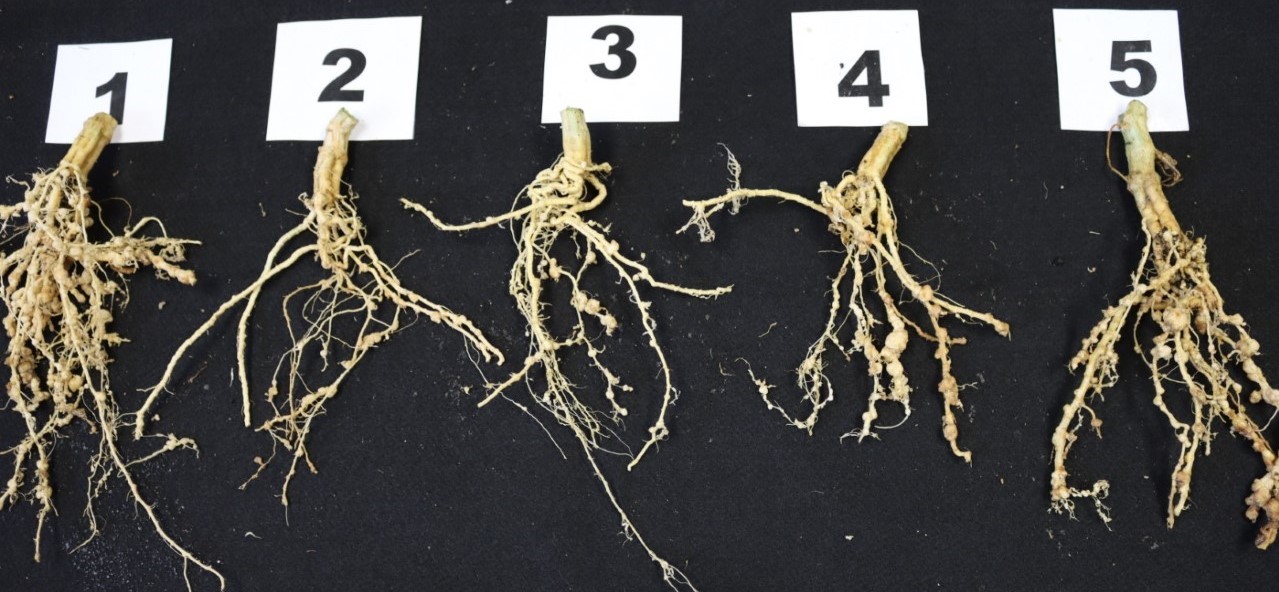
Root galling at harvest. 1) Untreated control 2) Nimitz 3) Gropro 4) Salibro 5) DP1
2020 Field Trial
This study was conducted as a small plot field trial on our RKN-infested site at the Shafter research farm. A western shipper-type melon variety, ‘Durango’, was hand transplanted onto 60-inch beds on June 30, 2020. There were four replications and five treatments in this trial arranged in a randomized block design. Rates, timings and method of application for each treatment is listed in Table 1, on page 18. Each plot was 20 feet in length with a five-foot buffer between plots along the bed. Treatments were applied either as a pre-plant or post-plant application through buried drip. Before chemigation, water was run for ten minutes to ensure all treatment tubing was filled, and after, chemigation water was run for about 20 minutes to flush the lines. The plots were irrigated using a surface drip and maintained using standard agronomic practices.
Table 1: Treatments, rate/A, application schedule and timings.
Before applying the treatments, soil samples were collected from all plots using a sampling tube at a depth of eight to 10 inches and submitted for analysis to determine the RKN count. Soil samples were collected and analyzed for nematodes again at harvest. Melon roots were evaluated for galling at mid-season and at harvest. Data on nematode counts and root galling was analyzed using SAS (statistical analysis software).
Data and Results
Plant vigor for each plot was rated visually on August 11, 2020 on a scale of 1-5, with 1=worse and 5=best plants. Vigor included the size of the vines and general appearance or health of plants. On the same day, five plants from each plot were randomly selected and visually rated for severity of root galling on a scale of 0-10; (0=no galls, 10=completely galled roots). The average galling on these five plants was used to give a galling index for each plot. The fresh shoot weights of these plants (without fruits) were determined.
At harvest on September 22, 2020, soil samples were collected from each plot for RKN count. All plants in each plot were dug and the severity of root galls on these plants was visually rated on a scale of 0-10 (0=no galls, 10=completely galled roots). The average of the galling on these plants in each plot was used to give a galling index for each plot.
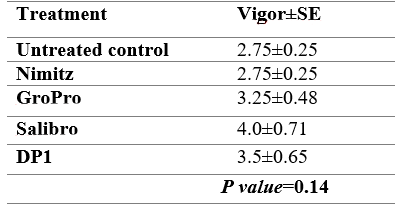
Plant Vigor
No obvious differences were observed in plant vigor among treatments (Table 2). Some plots were a little more vigorous than others, but these differences were not attributed to treatment effect.
Table 2: Mid-season average plant vigor of melon plots in five treatments during the 2020 growing season. Vigor on a scale of 1-5, with 1=worse and 5=best plants.
There were no significant differences observed in fresh shoot weight of melon plants during mid-season evaluation on August 11 (Table 3). However, Nimitz resulted in higher shoot weights than the other treatments.
Table 3: Average plant weight (g±SE) of melon vines in five treatments during the 2020 growing season.
Root Galling
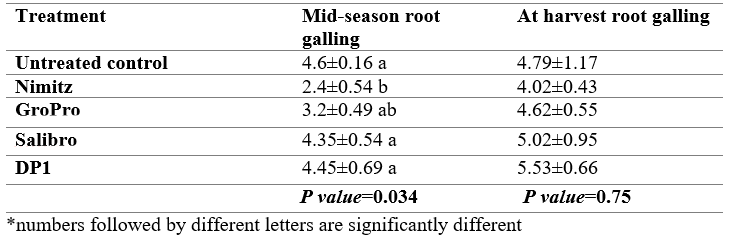
The severity of root galling was assessed at mid-season and at harvest. At mid-season evaluations, root galling was moderate and ranged between 2.4 in the Nimitz treatment and 4.6 in the untreated control (Table 4). Root galling in Nimitz and Gropro treatments was significantly lower than the other treatments. At harvest, there was a little increment in root galling across all treatments, however there were no significant differences among treatments. Surprisingly, Salibro and the developmental product was not beneficial in the trial and had higher root gall ratings than the non-treated control plots at harvest.
Table 4: Average root galling of melon plots in five treatments during the 2020 growing season. Galling on a scale of 0-10 (0=no galls, 10=completely galled roots).
Conclusion
In our 2020 trial, there were some treatment effects on mid-season root galling with Nimitz and the organic product Gropro having statistically lower root galling index compared to other products. However, none of the treatments were significantly different at harvest, and the results indicate that none of the treatments had a long-lasting effect on RKN levels in the soil. Therefore, further evaluations are needed to better determine the efficacy of these products as sole treatments and in combination with other products and their potential and continued use by the melon industry.
This project was funded by the California Melon Research Board.
Pierce’s disease leaf symptoms. Leaf margins turn yellow (or red in red varieties) then burn back from the margins to center in patches (photo by K.T. Lund, UCCE.)
Pierce’s disease is caused by the bacterium Xylella fastidiosa. These bacteria live within xylem, the vascular tissue through which water travels in a plant. As the bacteria population grows, it stimulates the plant to produce tyloses. The combination of bacteria and tyloses cause vessel plugging, which restricts water movement in the plant, thus causing many of the disease symptoms. These blockages will eventually lead to the vine’s death. It is estimated that Pierce’s disease costs the California grape industry $56.1 million a year in lost productivity (Tumber et al., 2014). To minimize losses, it is important to understand the biology of the disease, including the bacteria’s host range, how the bacteria moves from plant to plant, and how to identify infected plants will help growers prevent losses and control the disease.
About the Bacterium
The bacterium X. fastidiosa has a large known host range. The European Food Safety Authority maintains a database of known hosts for X. fastidiosa (their updated list approved in April 2020 can be found at doi.org/10.2903/j.efsa.2020.6114.) Research done throughout California has identified many hosts, including weeds such as shepherd’s purse (Capsella bursa-pastoris), filaree (Erodium spp.), cheeseweed (Malva parvifolia), burclover (Medicago polymorpha) and annual bluegrass (Poa annua) among many others (Shepland et al., 2006 and Costa et al., 2004). Overall, at least 350 host plants have been identified from over 75 plant families as hosts for X. fastidiosa. From a control standpoint, once X. fastidiosa has been introduced to a geographic area, it will be virtually impossible to eliminate it from that location with such a wide variety of possible hosts.
X. fastidiosa does have another level of complexity. To date, four distinct subspecies of X. fastidiosa have been identified. X. fastidiosa ssp. fastidiosa is the subspecies that causes Pierce’s disease in grapevine, while X. fastidiosa ssp. multiplex is the subspecies that causes almond leaf scorch (Rapicavoli et al., 2018). This does mean that almond trees with almond leaf scorch would be unable to be the source of Pierce’s disease in a vineyard. To narrow down the definitive host range, grape-specific PD (X. fastidiosa ssp. fastidiosa) was inoculated into a range of possible host plants using glassy-winged sharpshooters as a vector. After an incubation period, multiple positive ELISA results were obtained for several plants including black mustard (Brassica nigra), black sage (Salvia mellifera), mirror plant (Coprosma repens), Spanish broom (Spartium junceum), Mexican elderberry (Sambucus mexicana), almond (Butte) (Prunus dulcis), white sage (Salvia apiana), sycamore (Platunus racemose) and coast live oak (Quercus agrifolia), confirming that they could host the bacteria (Costa et al., 2004). This does ultimately lower the number of possible plant hosts for X. fastidiosa ssp. fastidiosa; however, it still includes a long list of common plants found in and around vineyards, enough that even including this reduced host list, managing only these species, and other hosts yet to be identified, is still outside the ability in most growing regions.
Insect Vectors
Bacteria within the xylem tissue of one plant may be spread to another plant through the feeding activities of certain xylem-feeding insects. In vineyards, two groups of insects have been identified as possible vectors: sharpshooters and spittlebugs. Spittlebugs have been shown to vector X. fastidiosa in controlled settings, but their importance as a Pierce’s disease vector in vineyards is unclear. Sharpshooters, on the other hand, are known to be effective vectors of Pierce’s disease in vineyards.
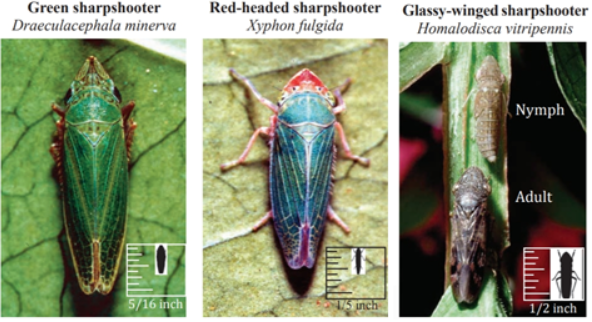
There are several different sharpshooters in California that vector X. fastidiosa. The most important of these in the coastal portions of California is the blue-green sharpshooter. This sharpshooter is not adapted to the hotter climate of the San Joaquin Valley (SJV). In the SJV, there are three other sharpshooters: the green sharpshooter (Draeculacephala minerva), the red-headed sharpshooter (Xyphon fulgida) and the glassy-winged sharpshooter (Homalodisca vitripennis).
From left to right: green, red-headed and glassy-winged sharpshooters. Size comparison measurements are in the bottom right of each individual image (photos by Jack K. Clark, Regents of the University of California.)
Green and Red-Headed Sharpshooter
The green sharpshooter and the red-headed sharpshooter are both small and prefer to feed on grasses. The red-headed sharpshooter is specifically drawn to and reproduces on Bermudagrass. Both the green and red-headed sharpshooter can be found in irrigated pastures and along waterways such as streams, creeks, canals and ditches. Neither of these sharpshooters prefers to feed on grapevines, however they may do so under certain conditions and thus transmit Pierce’s disease. Since they don’t prefer grapevines, they tend not to spread deeply into vineyards; thus, when these vectors transmit Xylella, it is usually only to grapevines along the edges of a vineyard, whereas vines in the middle or the sides away from the green or red-headed sharpshooters’ preferred habitat are not affected.
Glassy-Winged Sharpshooter
The glassy-winged sharpshooter is twice the size of either of the other two sharpshooters. Their large size makes them more effective as a vector for Pierce’s disease because they can travel further than smaller sharpshooters and feed more effectively on a wider variety of plants, including woody plants such as grapes. To date, over 350 plants have been identified as hosts of glassy-winged sharp shooter (cdfa.ca.gov/pdcp/Documents/HostListCommon.pdf). Many of the hosts for glassy-winged sharpshooters are also hosts for X. fastidiosa. One of the key hosts for both glassy-winged sharpshooters and X. fastidiosa in the SJV, and for local control of Pierce’s disease, is citrus. The large feeding range of the glassy-winged sharpshooter also means that it can spread the disease throughout the vineyard instead of just to the edges.
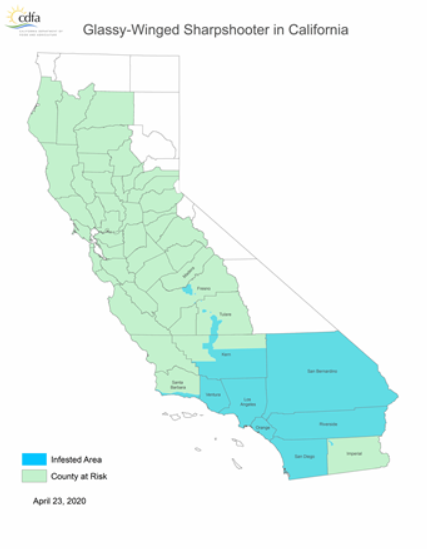
The glassy-winged sharpshooter is not a native California insect, only arriving in California in the late 1980s (first recorded in 1989). As this non-native pest is such a dangerous vector, the CDFA tracks their distribution. Most of Kern county, parts of Tulare and Fresno counties, and a very small sliver of Madera county just over the San Joaquin River are all hosts to naturalized populations of glassy-winged sharpshooters within the SJV. In SoCal, Ventura, Los Angeles, Orange, San Bernardino, Riverside and San Diego counties as well as portions of Santa Barbara county and a small section of Imperial county all play host to endemic populations.
CDFA map for April 2020 of glassy-winged sharpshooter distribution in California (photo courtesy CDFA.)
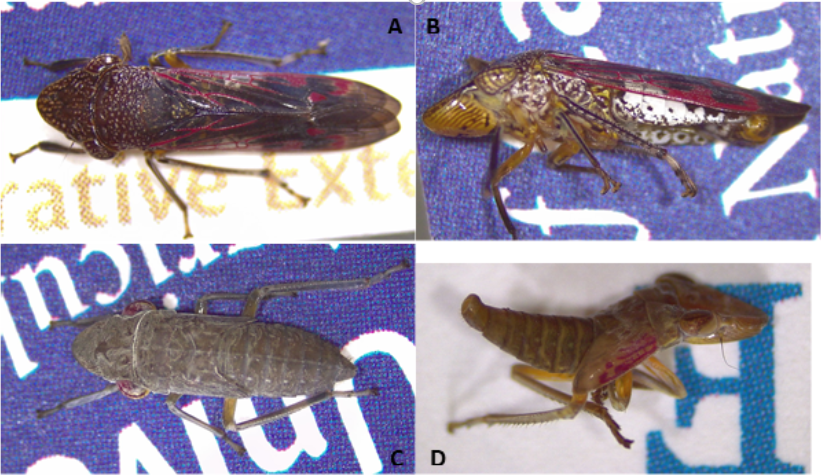
Identification of glassy-winged sharpshooters within and near these areas is important for controlling their spread as well as the spread of Pierce’s disease. At the top, the insect has a deep brown color with creamy white dots on the head and thorax. These colors and dots continue onto the abdomen; however, here they are covered with transparent wings (the source of their glassy name). Highlighting the glassy wings are red lines and patches which can be seen from both the top and side.
The other main identifying mark is the flat white marking along the side of the of the abdomen. When sitting on a stem, this white mark stands out under and through the wings of this sharpshooter. Younger nymph glassy-winger sharpshooters have yet to develop their namesake wings. Their bodies are a lighter grayish-brown with very small white dots. In this stage, the standout feature is their red eyes. The red is the same color that will soon highlight the parent’s wings.
Later-stage nymphs have started to transition to the adult body color, and the red color in the eye is mostly lost. However, the red color has transitioned onto the wing pads in a pattern that has started to develop the adult wing’s patterning.
Images of glassy-winged sharpshooter. A. Top view of adult glassy-winged sharpshooter. B. Side view of adult glassy-winged sharpshooter. C. Top view of young nymph glassy-winged sharpshooter. D. Side view of late-stage glassy-winged sharpshooter (photos by K.T. Lund, UCCE.)
Vector Monitoring and Treatment
Monitoring for glassy-winged sharpshooters can be done using yellow sticky cards. It is recommended to use cards that are at least 5.5” x 9” in size. One card should be placed for every 10 acres and checked weekly for recent activity. Monitoring should be done from budbreak through November. If a glassy-winged sharpshooter is found, and you are outside of a known population center, please contact your local agriculture commissioner’s office or cooperative extension office. Green and red-headed sharpshooters are not attracted to yellow sticky cards, so to monitor their populations you will need to use a sweep net. Sweep lush green grasses near and within your vineyard in April and May to assess population size.
For both green and red-headed sharpshooters, finding two adults in 50 sweeps warrants a response. Unfortunately, as both sharpshooters are only incidentally on grapevines, treating the grapevines will not help the situation. The preferred habitat (lush grassy areas) will need to be addressed. Due to the overlapping generations seen in these sharpshooters, insecticide treatments are often ineffective. Removal of preferred habitat is a more effective treatment option for these sharpshooters.
For glassy-winged sharpshooters, a single find warrants a response. A list of treatment options for glassy-winged sharpshooters can be found on the UC IPM webpage at ipm.ucanr.edu/PMG/r302301711.html. The most common insecticides used for glassy-winged sharpshooter control contain the active ingredient imidacloprid. As with all chemical control, it is important to rotate active ingredients regularly.
Research conducted in 2017 showed that several other insecticides had long-term control of glassy-wing sharpshooters. These included Sivanto (a.i. Flupyradifurone) and Assail (a.i. Acetamiprid), which still showed greater than 90% mortality 7 weeks after application; Actara (a.i. Thiamethoxam), which still showed greater than 90% mortality 5 weeks after application; Harvanta (a.i. Cyclaniliprole), which still showed greater than 90% mortality 4 weeks after application; and Sequoia (a.i. Sulfoxaflor), which still showed greater than 90% mortality 3 weeks after application (Haviland and Rill 2019). This research was conducted in citrus because relying on vineyard-only management is not enough for glassy-winged sharpshooters. With the larger range of the glassy-winged sharpshooter, it is important to focus on an area-wide approach. A pilot program with cooperation between grape and citrus growers has shown great promise in Kern county. Citrus groves are a primary overwintering spot for glassy-winged sharpshooters. When treatments can be applied to these locations, it can lower the number of glassy-winged sharpshooters and, thus, the presence of PD in the area.
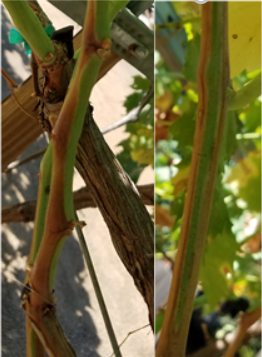
Pierce’s disease symptom on shoots. Patchy bark maturation on current year’s shoots leaving green islands (photo by K.T. Lund, UCCE.)
Vine Infections
Early identification of infected vines is the final step in preventing a larger problem from Pierce’s disease. Infected vines can be a source of the disease for vectors to spread to neighboring vines. They are also a strong indicator that the bacteria and a vector are present in your location.
The leaves of infected vines will turn yellow (for green varieties) or red (for red varieties) along the margins. This discoloration will then work inwards from the margin, with the discoloration quickly turning to brown/dried dead tissue. This often happens unevenly or in sections. Shoot tissue also shows an uneven maturation process, leaving green islands within lignified brown tissue.
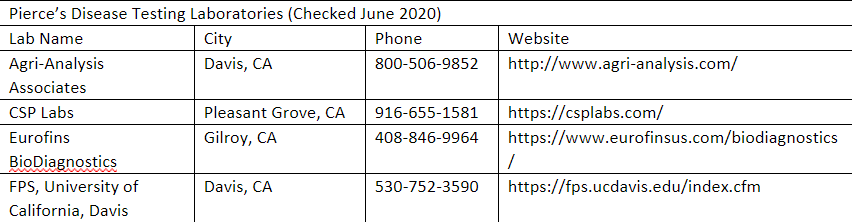
Affected leaves eventually fall off, but will sometimes leave the petiole still attached to the shoot. Not all these symptoms will be found on every infected vine. If you suspect a vine is infected with Pierce’s disease, you can contact your county’s viticulture advisor for corroboration. Ultimately, a diagnostic analysis is required to confirm the presence of X. fastidiosa in the suspected vine. Table 1 lists laboratories within California that offer Pierce’s disease testing.
Table 1: California Laboratories that offer Pierce’s disease testing.
References
Costa, H. S., Raetz, E., Pinckard, T. R., Gispert, C., Hernandez-Martinez, R., Dumenyo, C. K., and Cooksey, D. A. 2004. Plant hosts of Xylella fastidiosa in and near southern California vineyards. Plant Dis. 88:1255-1261.
Haviland, D. and Rill, S. 2019 Evaluation of glassy-winged sharpshooter mortality following exposure to aged insecticide residues, 2017. Arthropod Management Tests, 44(1), 1–1. doi: 10.1093/amt/tsz075
Rapicavoli, J., Ingel, B., Blanco-Ulate, B. Cantu, D. and Roper, C. 2018. Xylella fastidiosa: an examination of a re-emerging plant pathogen. Mol. Plant Pathol., 19(4), 786–800
Shapland, E. B., Daane, K. M., Yokota, G. Y., Wistrom, C., Connell, J. H., Duncan, R. A., and Viveros, M. A. 2006. Ground vegetation survey for Xylella fastidiosa in California almond or orchards. Plant Dis. 90:905-909.
Tumber, K. P, Alston, J. M, & Fuller, K. 2014. Pierce’s disease costs California $104 million per year. California Agriculture, 68(1-2)


")


 Invading California")

