


Planting an orchard requires a lot of work to ensure that the trees get off to the best start possible: picking the right rootstock and scion, prepping the ground and choosing the best irrigation system are just some of the decisions that need to be made. And of course, once the trees are in the ground, they need to be cared for so that they expand their canopies as fast as possible. While irrigation is the most critical part of establishing newly planted orchards, ensuring adequate nutrient availability without overfertilizing the trees is important, too.
I was first spurred to do this research when I realized that existing nonbearing pistachio tree fertilization guidelines were based on educated guesses, rather than research. Additionally, I, along with Greg Browne at the USDA, recently found that newly planted almonds grow more with some phosphorus fertilizer provided at planting. Could pistachios benefit from phosphorus, too?
Experimental Design and Sites
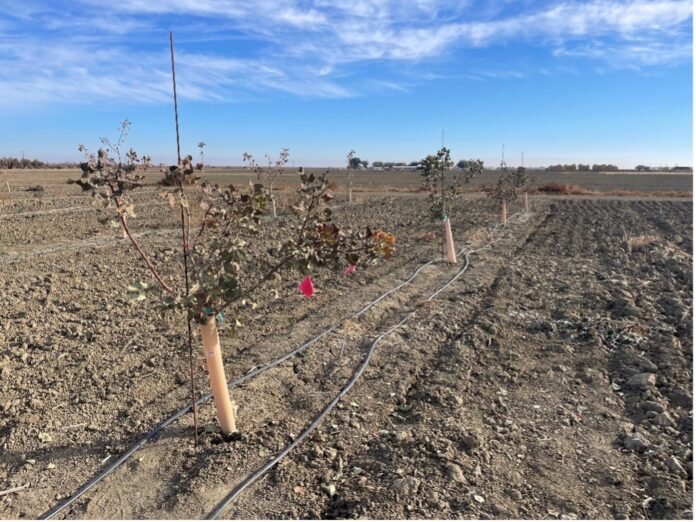
I established three different experimental locations to examine both nitrogen and phosphorus fertilization rates. The first orchard was at the Westside Research and Extension Center near Five Points, California, using nursery grafted Golden Hills on UCBI and planted in April 2023 (Fig. 1). The soil is a clay loam and has a soil organic matter level of 2.15% in the top foot of soil. Soil phosphorus levels are very low, less than 5 ppm, and nitrogen levels in the irrigation water are negligible.
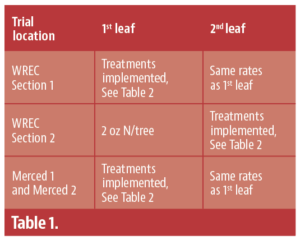
This plot was designed as the testing ground. As it was unclear how much nitrogen nonbearing trees needed, nor was it clear whether their needs would change as the trees aged, I divided the plot into several sections; only Sections 1 and 2 will be discussed in this article. After testing rates at this site, I then moved into commercial orchards in later years to confirm the results. Thus, there are four plots to keep track of in this article. Table 1 is an overview of the location and years the plots were monitored.
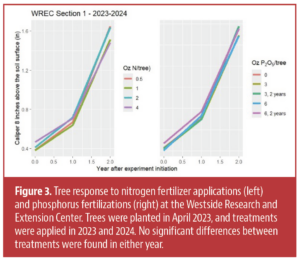
The trial began in WREC Section 1 in 2023, though I did apply some phosphorus fertilizer to a few plots in Section 2 to test out two years of phosphorus fertilization rates. Trees in Section 2 got 2 oz. of nitrogen per tree, as that was the hypothesized need for trees of that age. This gave me the flexibility to see if nitrogen rates changed as the trees aged by ensuring that previous years fertilization practices would not affect the current year’s. For instance, what if a 1st leaf tree needed very little nitrogen, but a 3rd leaf tree needed quite a bit? If I gave each treatment the same rate every year, this might not become apparent. Once a site was formally incorporated into the trial, those trees received the same rate throughout the rest of the trial. The nitrogen and phosphorus rates used can be found in Table 2.
Fertilizer Application Methods
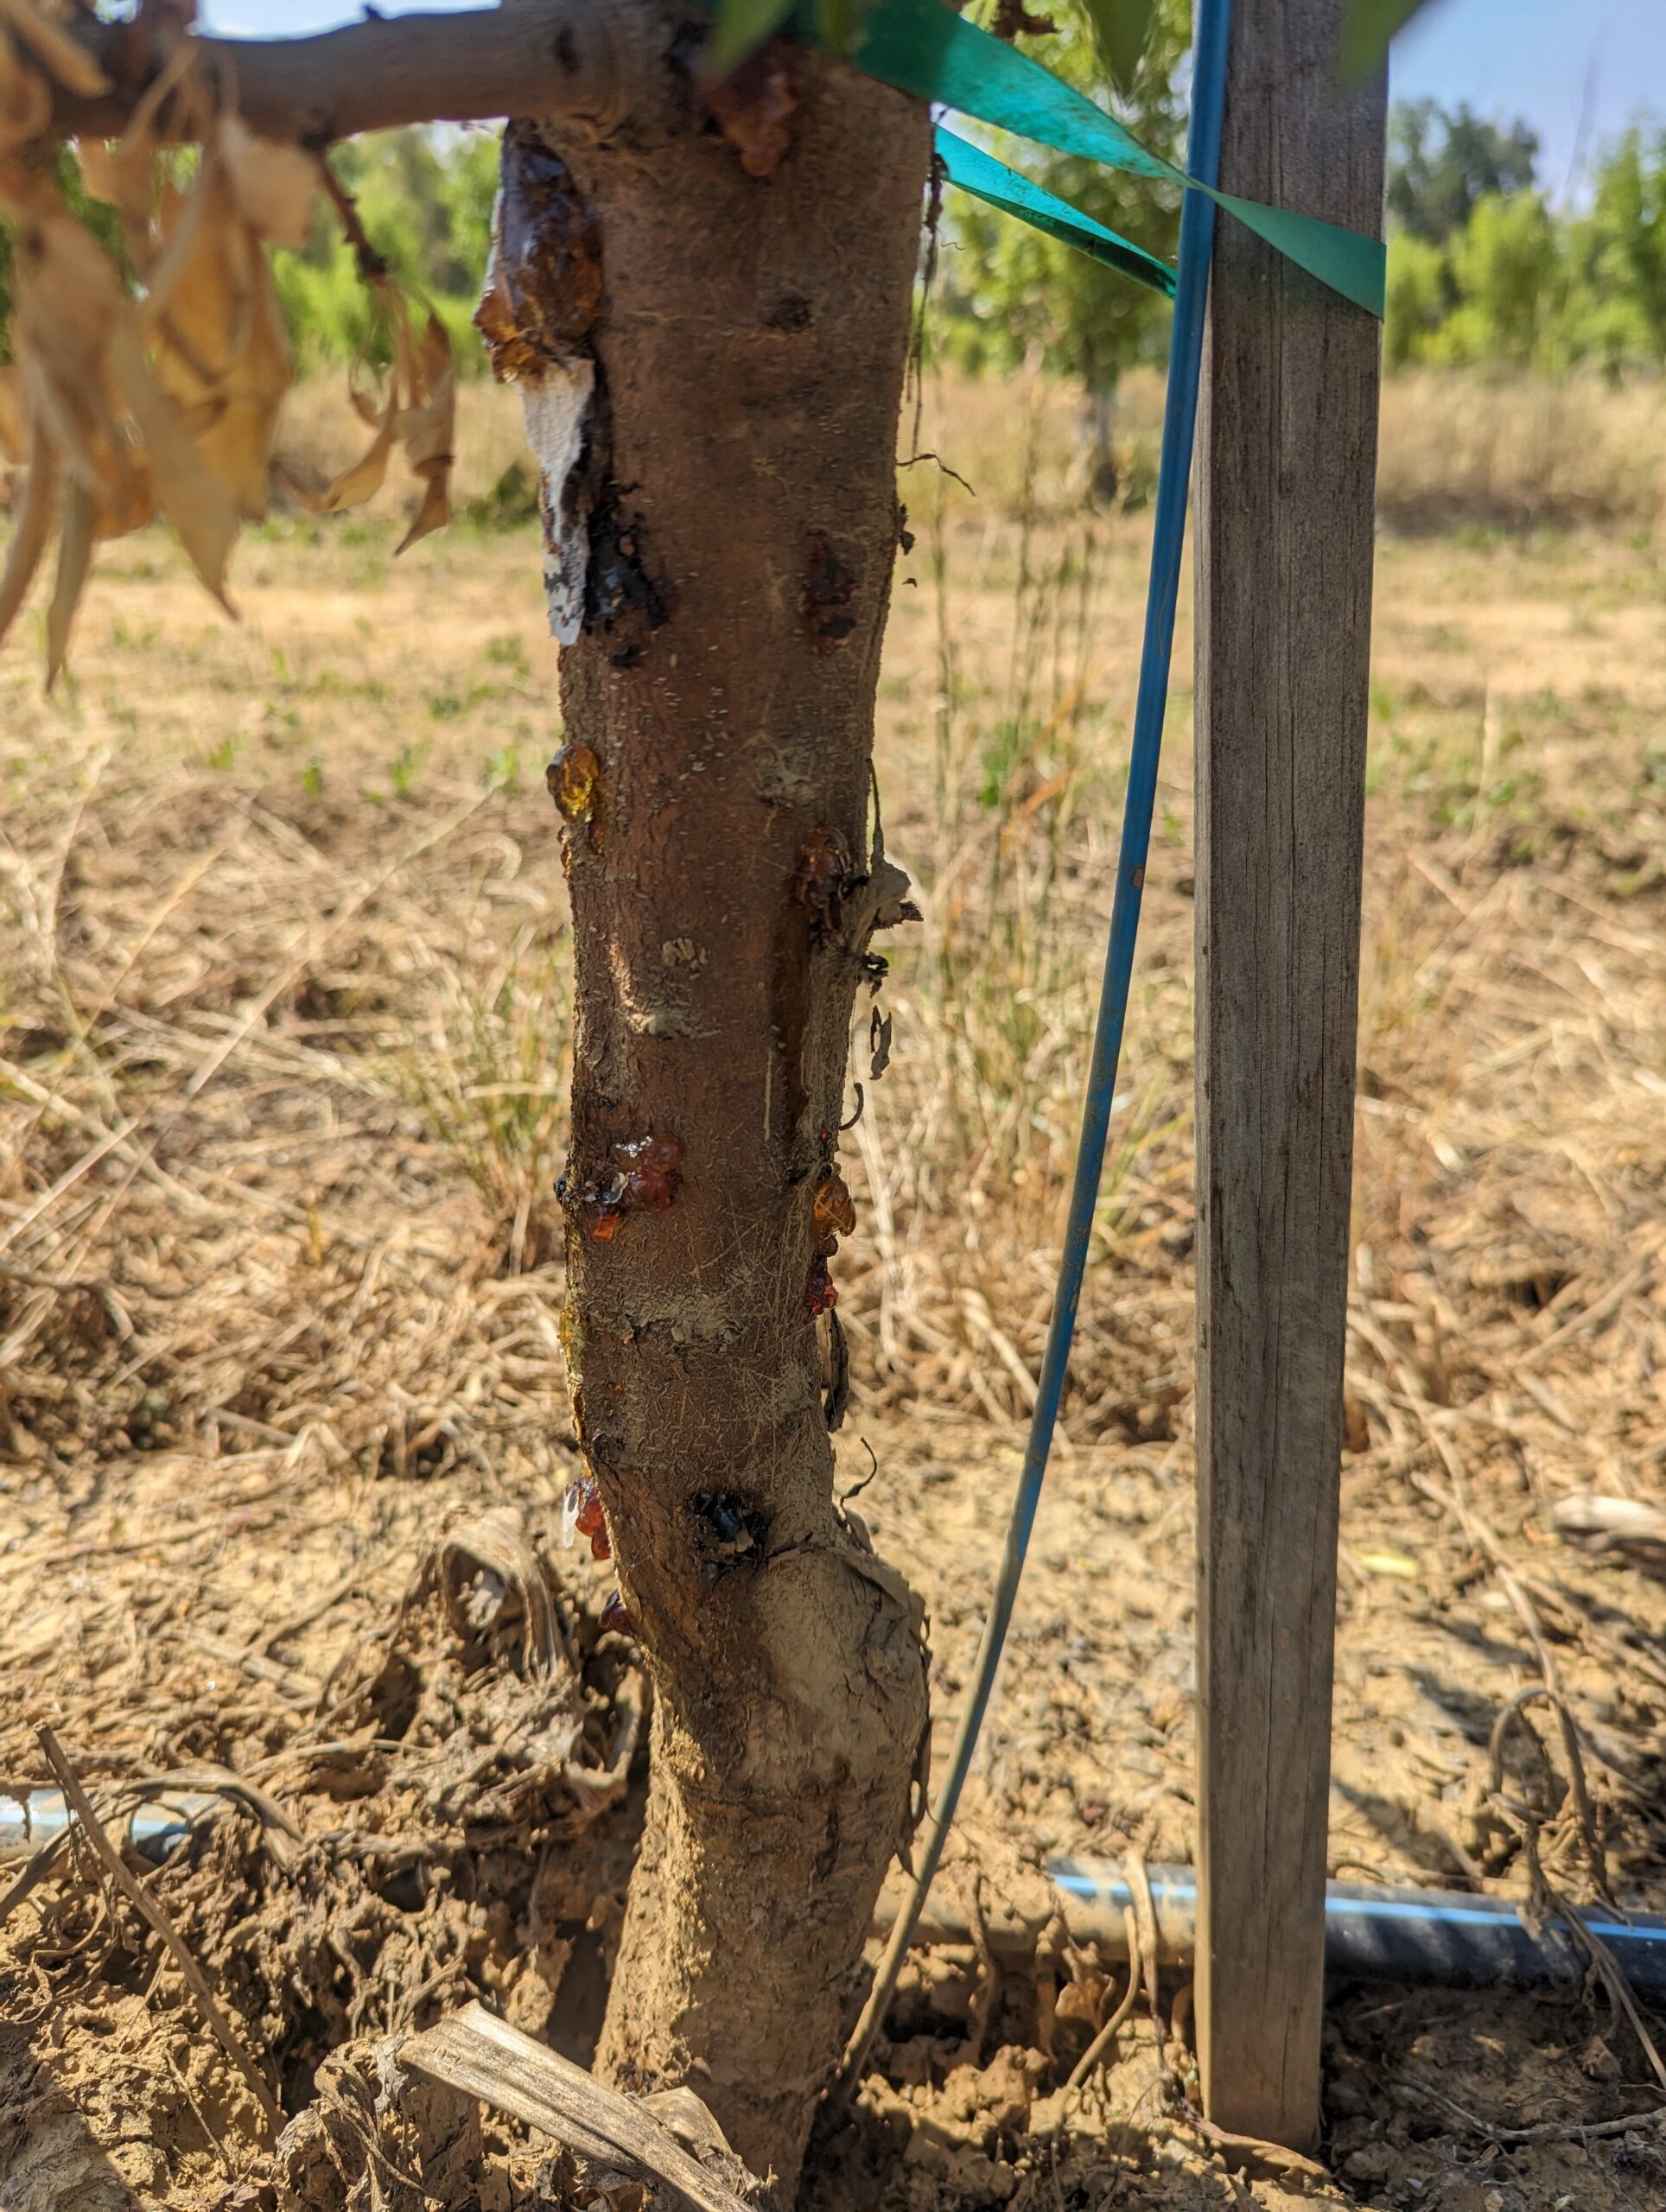
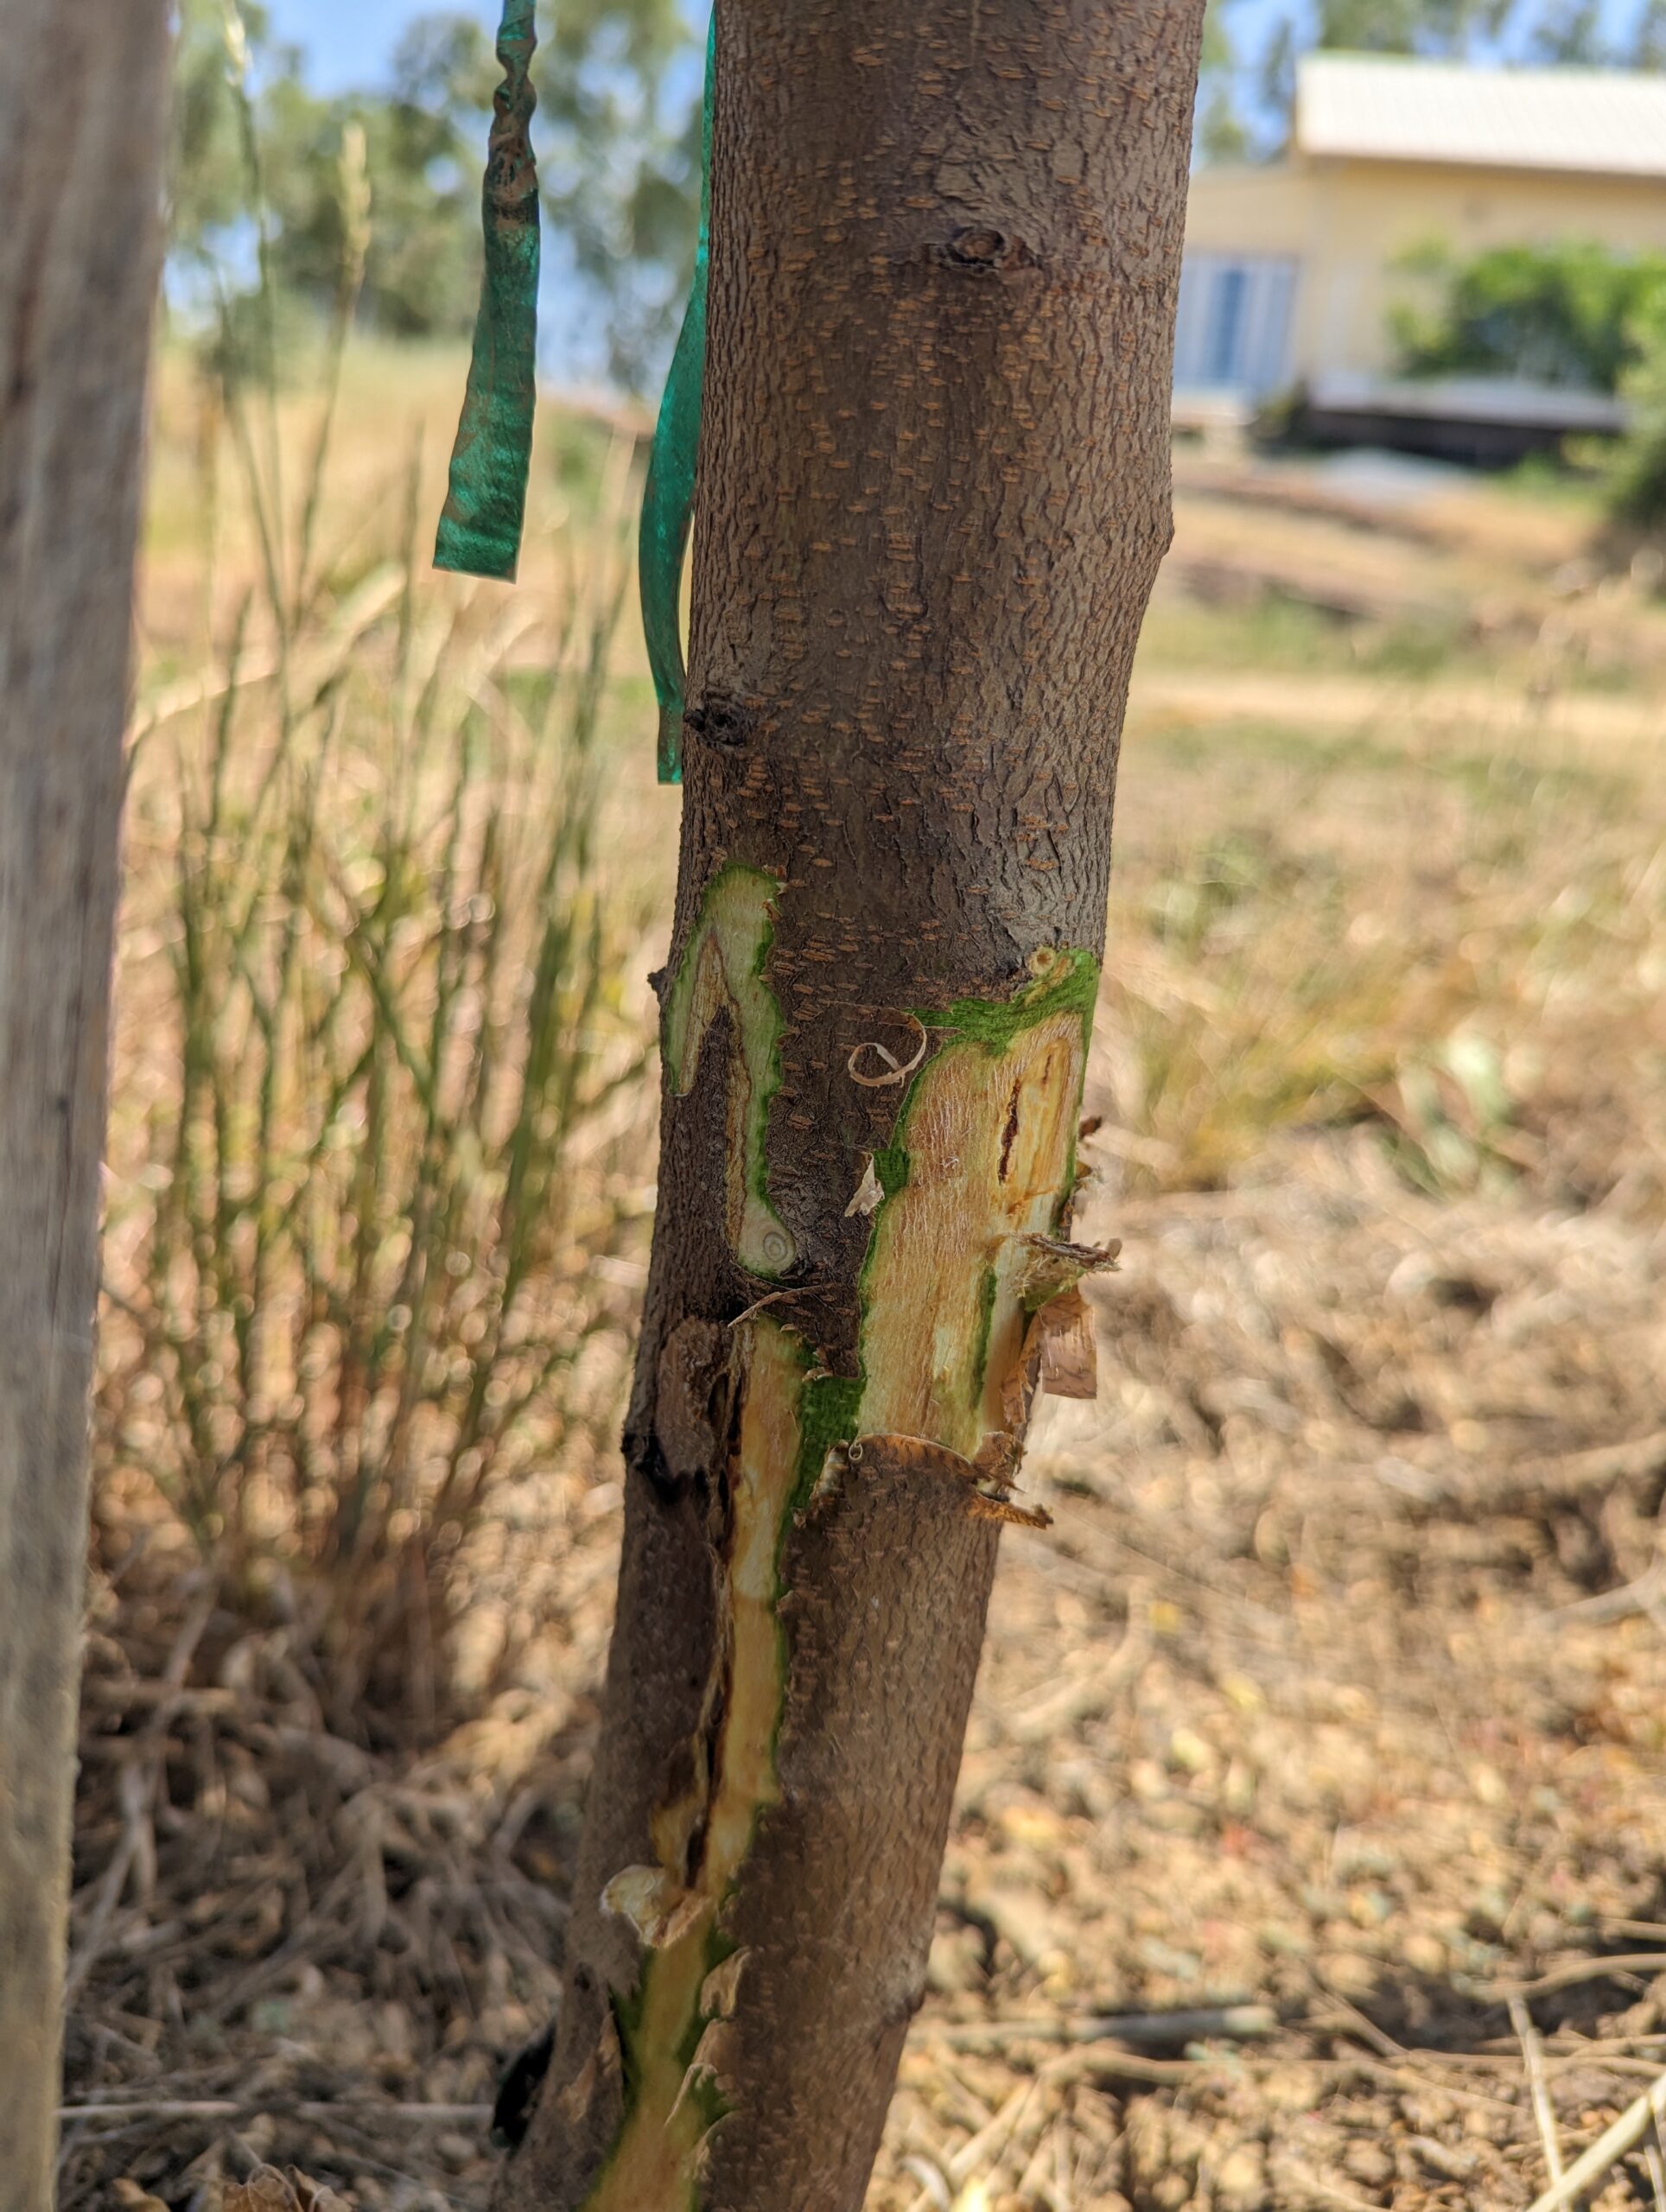
Nitrogen was applied as urea in 2023 and 2025, and ammonium sulfate in 2024. The fertilizer was inserted into the ground in the wetted zone of a drip emitter to ensure that the nitrogen would not volatilize and that it would be accessible for uptake. Additionally, applying the fertilizer in these forms reduced the chance that nitrogen would be leached out of the root zone. While urea is technically mobile in soils, it is converted to ammonium fairly quickly when soils are warm. I saw some fertilizer burn when we applied 1/4 oz. of N weekly to first leaf trees (Fig. 2) and reduced the weekly application rate to 1/8 oz. N at the follow-up research plots and no more leaf burn was observed. 2nd leaf trees did just fine with weekly application rates of 1/4 oz. N/tree.
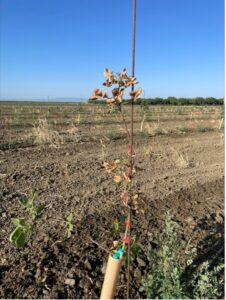
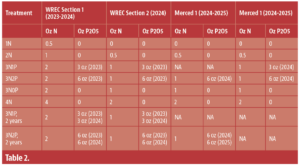
Table 2: Nitrogen and phosphorus fertilization rates at the Westside Research and Extension Center, WREC, and Merced locations. The WREC location was planted in 2023. The Merced locations were both planted in 2024.
Phosphorus was applied as triple superphosphate. While this form of phosphorus is not used much in the industry, I wanted to make sure that we were only applying a straight phosphorus product. The phosphorus was applied about a month before leafout, buried in the soil about a foot from the tree.
At all sites, I included buffer trees between each experimental plot to ensure that trees from one treatment would not be picking up fertilizer from a nearby treatment. These buffer trees received 1/2 oz. of N/tree at WREC Section 1 in 2023, but after that, buffer trees were always unfertilized.
We used the caliper of the rootstock to monitor tree vigor and collected July leaf tissue values. Soil samples were collected each fall to see if residual nitrogen was being left in the root zone after the growing season.
Results From WREC
There was no response to fertilizer growth at the Section 1 WREC plot in its 1st leaf (Figure 2). While leaf tissue values showed no response to nitrogen fertilizer, leaf phosphorus levels did increase with phosphorus fertilization, though it was inconsistent (data not shown). These differences disappeared in year 2, and I did not see any differences in leaf tissue concentrations at any other site in any other year.
Merced Expansion Sites and Findings
Due to the lack of response to fertilizer in WREC Section 1, I changed the rates applied to 1st leaf trees for my two expansion sites in commercial orchards in Merced County (Table 2). The lowest rate was now going to be 0 oz. of nitrogen per tree. I used the same rates in WREC Section 2, but kept the original rates in WREC Section 1 (Tables 1, 2).
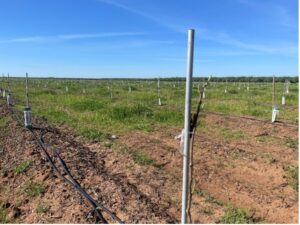
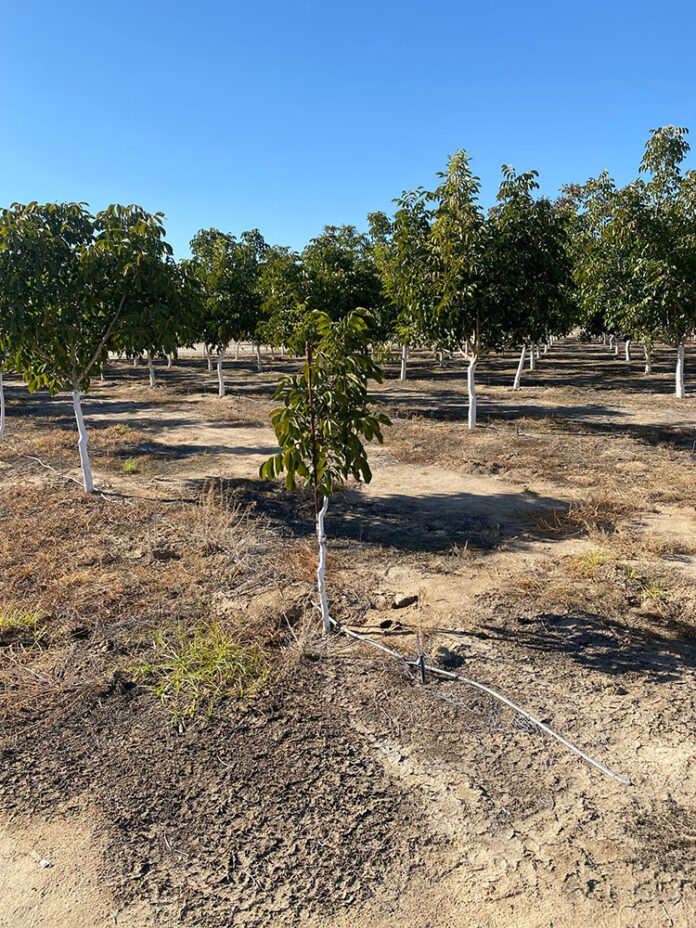
Both Merced sites are on loamy soil, and both had a previous almond orchard chipped and incorporated into the soil. Merced 1, a nursery-grafted Lost Hills orchard on UCBI, was planted in February 2024 (Fig. 4), and Merced 2, a Golden Hills orchard on UCBI, also nursery grafted, was planted in April 2024. Organic matter levels there were higher due to the wood chips. My team did their best to remove the chips but it was difficult. 3.0% and 2.3% at Merced 1 and Merced 2, respectively. Compost was incorporated before planting at Merced 1 and no compost was applied at Merced 2. The growers shut off lines before any fertigation events to ensure that the experimental trees were not fertilized.
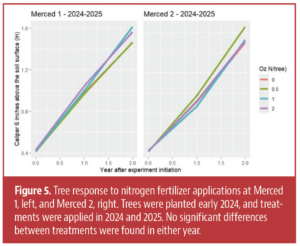
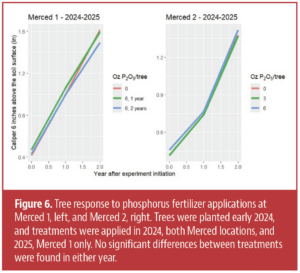
There was no response to nitrogen fertilizer at either of the Merced locations in either the first or second year of applications (Figs. 5, 6), nor was there a response to treatments at WREC Section 2 (data not shown due to space constraints).
Why has there been no response to either nitrogen or phosphorus fertilizer? Let’s address phosphorus first: with the exception of recently published research on 1st leaf almond trees, all available evidence pointed to orchard trees rarely responding to phosphorus fertilizer. So, if the established knowledge is that trees just do not need much, if any, phosphorus, then this trial in pistachios actually goes along with conventional wisdom, not against it.
What about nitrogen? That finding was much more surprising. All trees, even those that received no nitrogen, had excellent vigor, so I knew that there was not something stunting their growth. There were three possible explanations I could think of.
First: were tree roots expanding into neighboring root systems, either within a row or between rows? My team partially excavated some root systems in early 2025 at WREC and found no evidence for this. Additionally, I included buffer trees between each plot within a row to further reduce this chance.
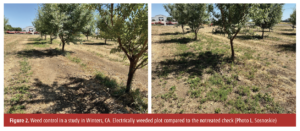
What about nitrogen mineralized from soil organic matter? This is likely, especially at the WREC location. The innate fertility of all three sites was high: despite the farm managers’ valiant efforts, weeds were difficult to keep down in the first leaf. While this is partly due to limited herbicide options in 1st leaf orchards and no PRE herbicides, the vigorous weed growth is notable in the Merced locations as these sites had incorporated wood chips. Previous research into whole orchard recycling showed that weed growth is often suppressed in the 1st leaf, probably due to nitrogen starvation. This indicates to me that there is likely nitrogen available in the soil at my research plots.
The last likely explanation is that pistachios just do not need as much nitrogen as almonds, the only other nonbearing tree with research-backed nitrogen fertilization rates. While this can only be formally determined by cutting down some 1st leaf almond and pistachio trees and weighing them, it is easily observed that pistachio trees just do not develop their canopies as much as almonds in the 1st leaf. To add to this, our soil samples indicated that much of the nitrogen that was applied to the trees in the higher fertilization rates was being left in the soil (data not shown). The trees did not need it, so they were not taking it up.
To sum up: at three different trial locations managed by different farm managers, 1st and 2nd leaf pistachio trees do not appear to need any nitrogen or phosphorus fertilizer. It is possible that trees growing in extremely sandy locations with low soil organic matter could respond to nitrogen fertilizer.
Acknowledgments: This research was primarily funded by the California Pistachio Research Board, with some salary support from a USDA NIFA grant. The trees planted at WREC were donated by Duarte Nursery, and Jeb Headrick provided the tree stakes. Richard Saldate, Gagan Gade, Baudelio Perez, Kelsey Leyva and Rito Medina helped make this research possible.


 Invading California")

