
newsletter
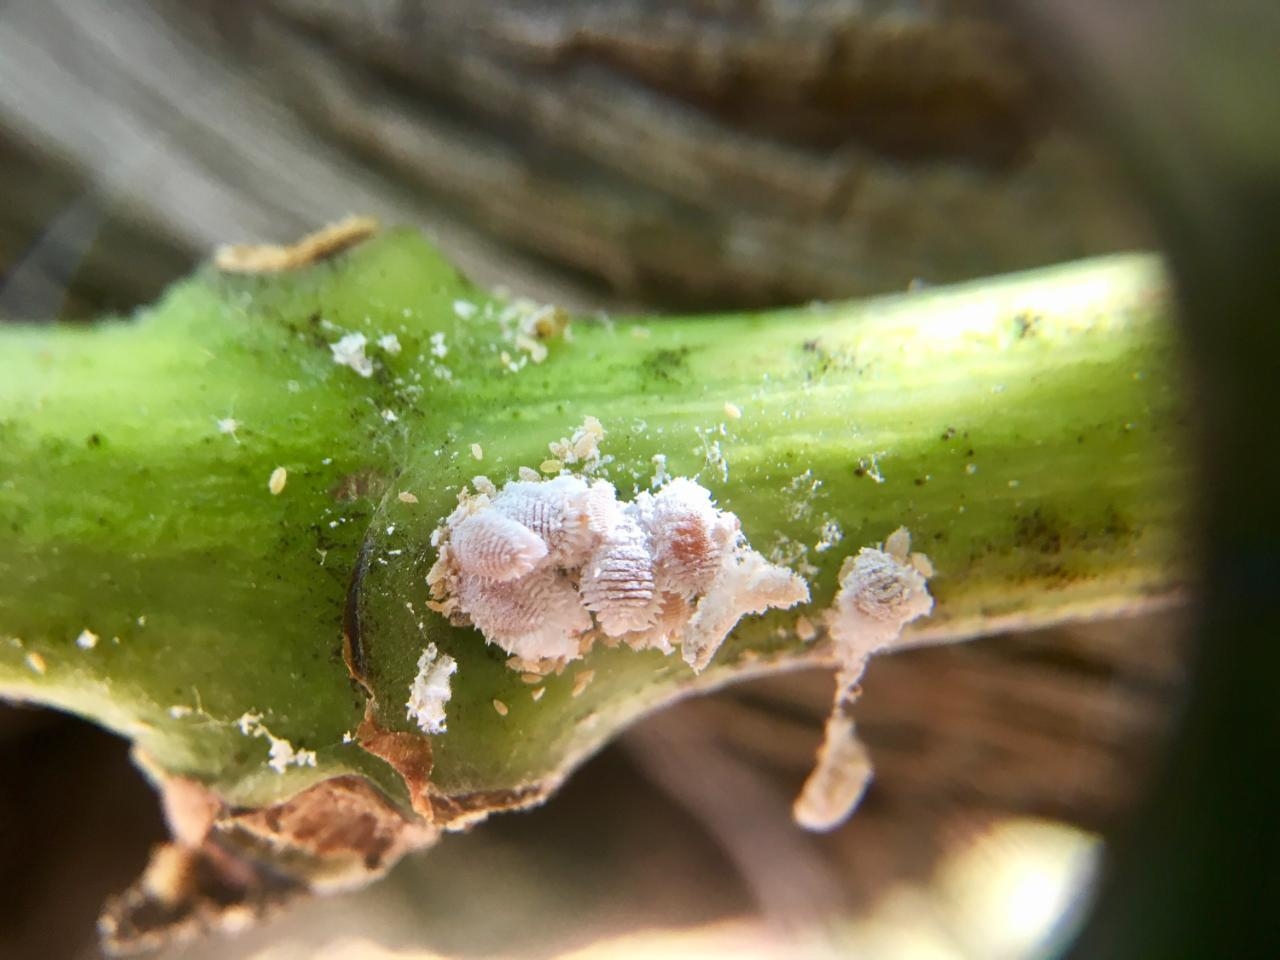
Mealybugs Pose Threat to Grape Quality
Mealybug management is an important part in controlling grapevine leafroll disease. At a Fresno State grapevine viruses symposium,…
Read ArticleArticle Archive
Mealybug management is an important part in controlling grapevine leafroll disease. At a Fresno State grapevine viruses symposium,…
Read Article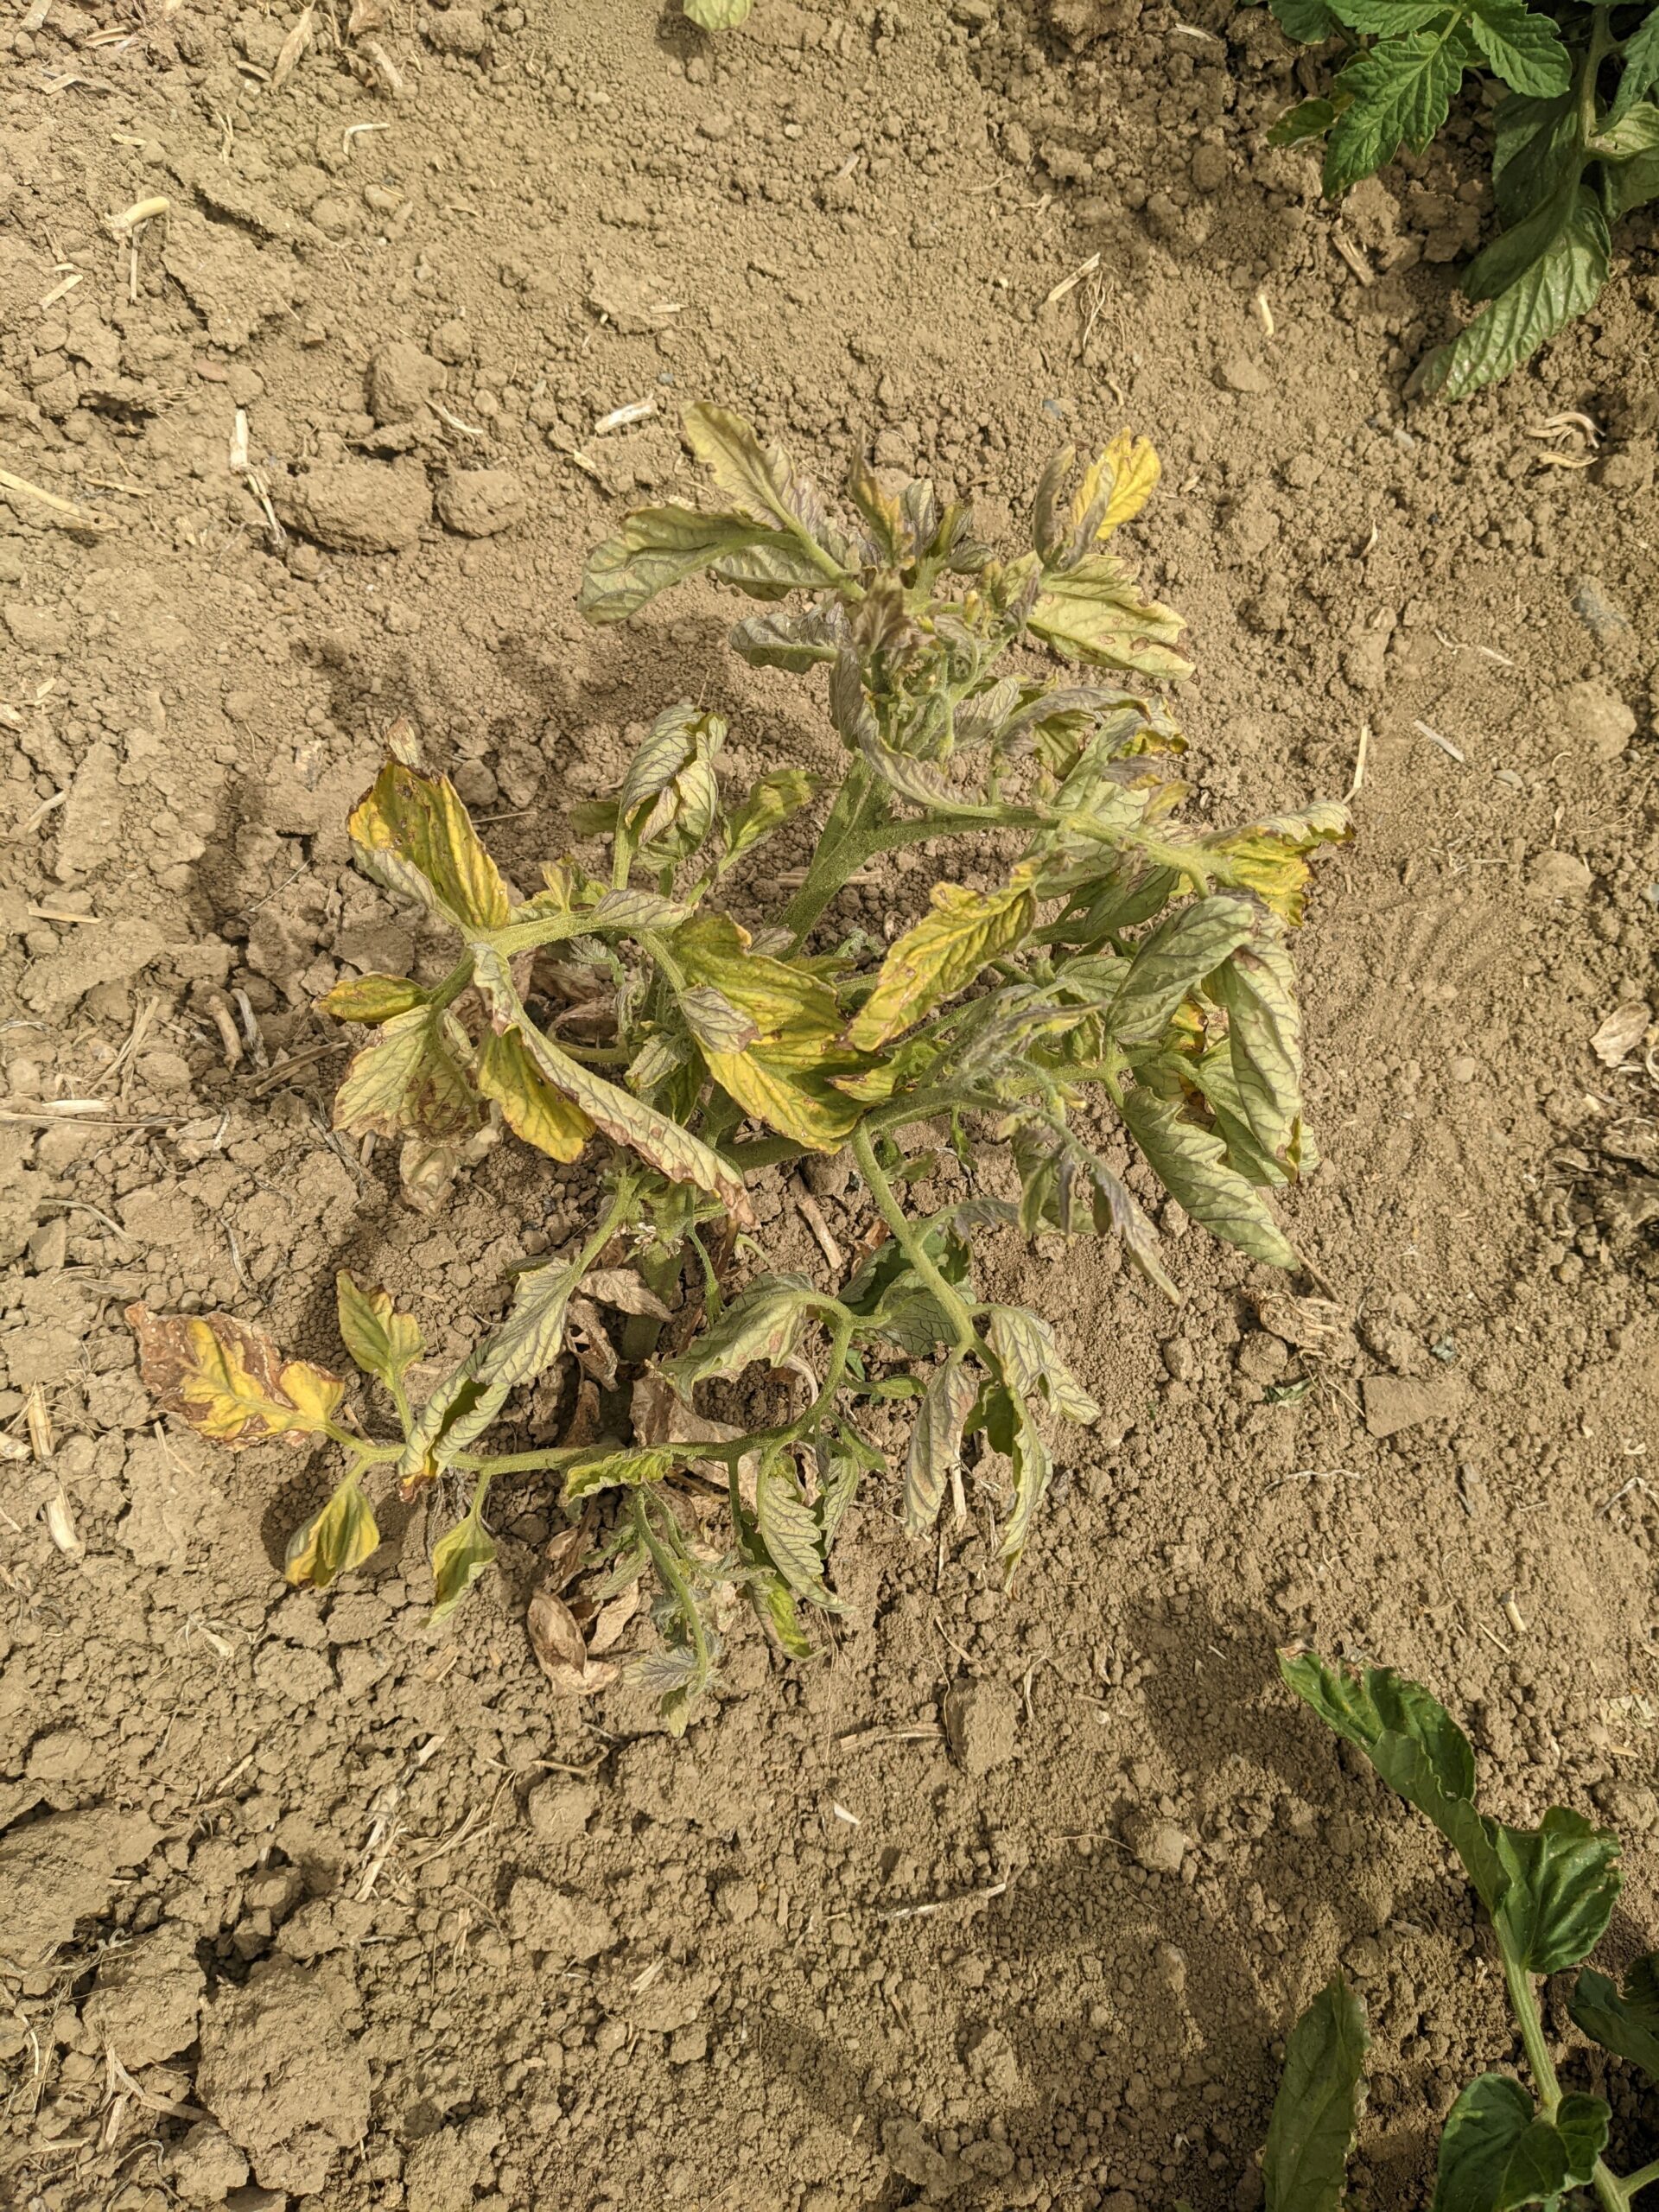
An unusual strain of beet curly top virus (BCTV) has been confirmed in Colusa County this growing season.…
Read Article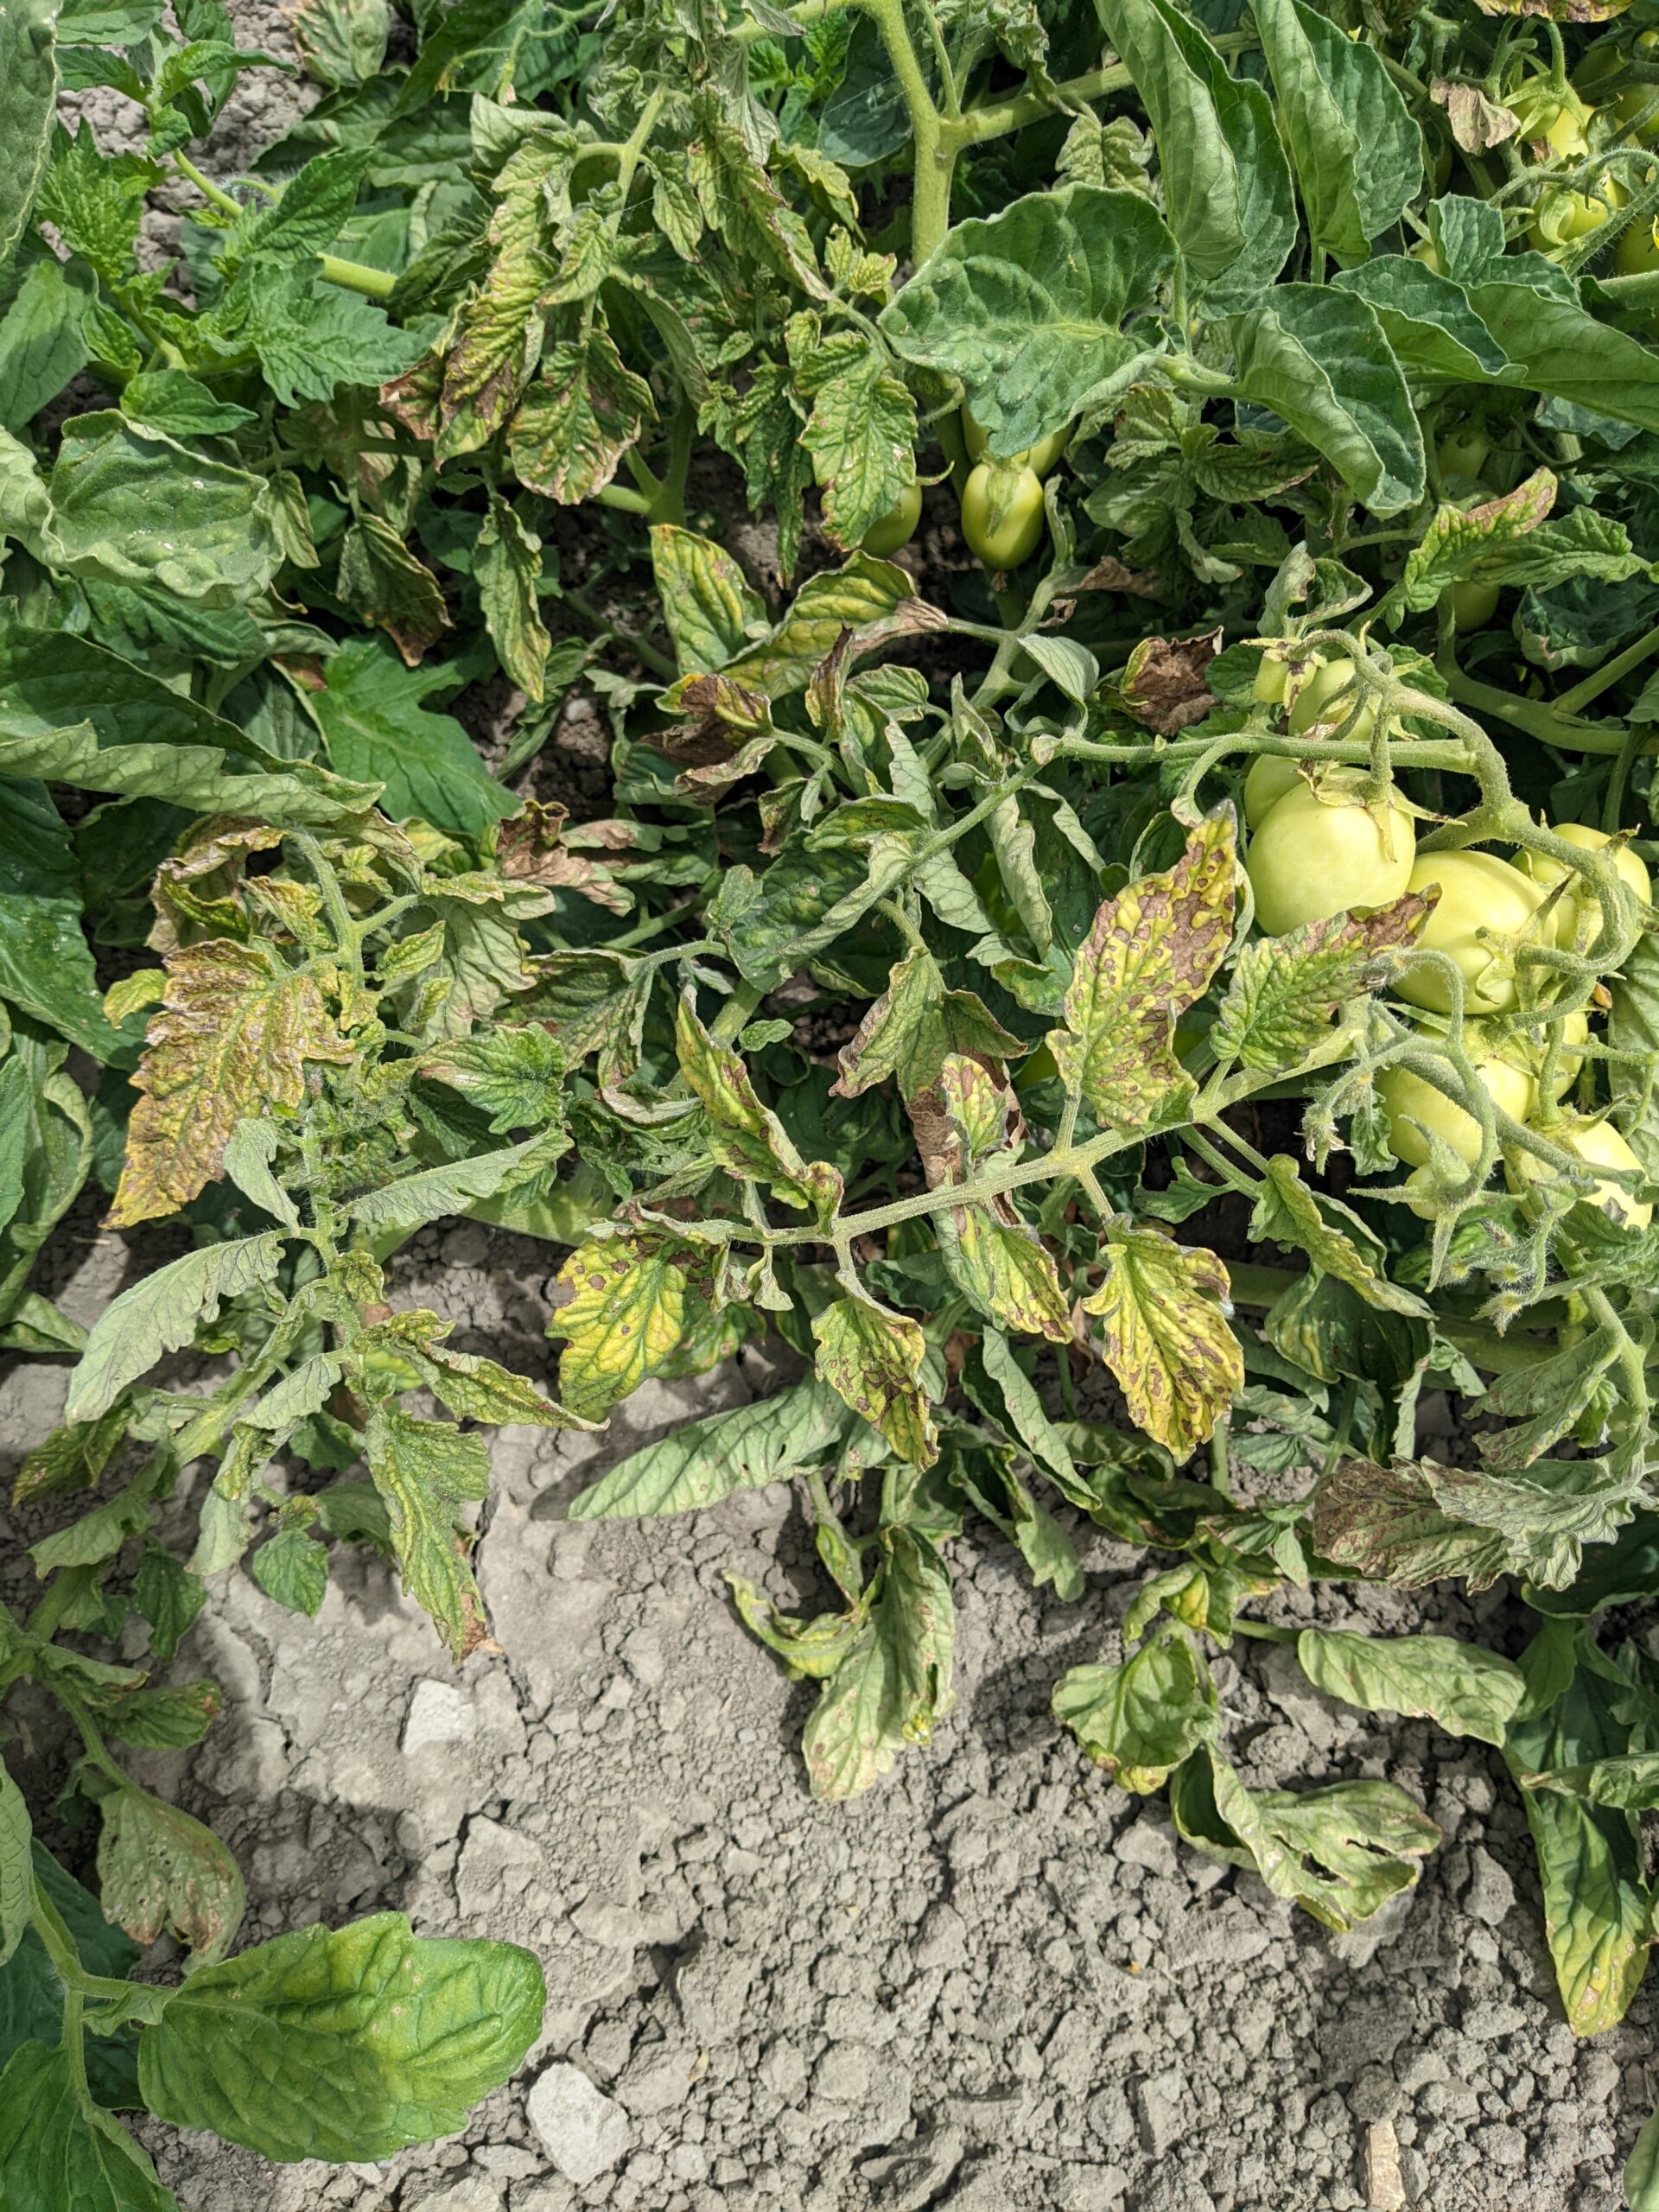
A resistance-breaking strain of tomato spotted wilt virus (TSWV) was detected in May in a northern Sutter County…
Read Article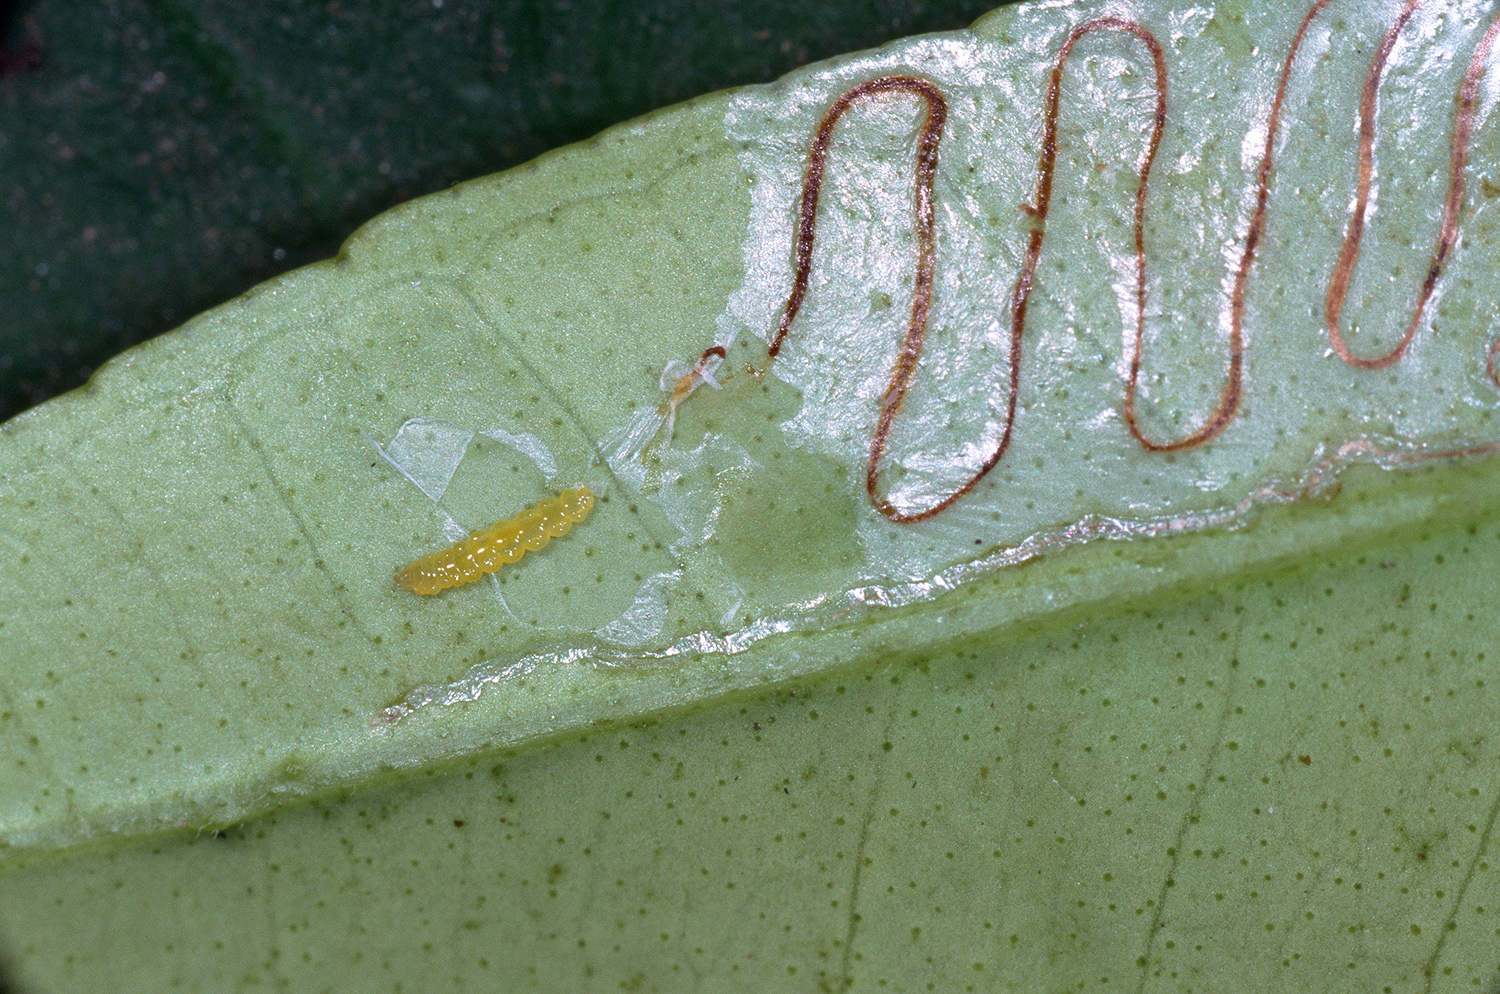
Protection of Tango trees from citrus leafminer for the first three to four years after planting is warranted,…
Read Article
Foliar tissue analysis determines essential or toxic levels of nutrients in plants. The analysis is used to detect…
Read Article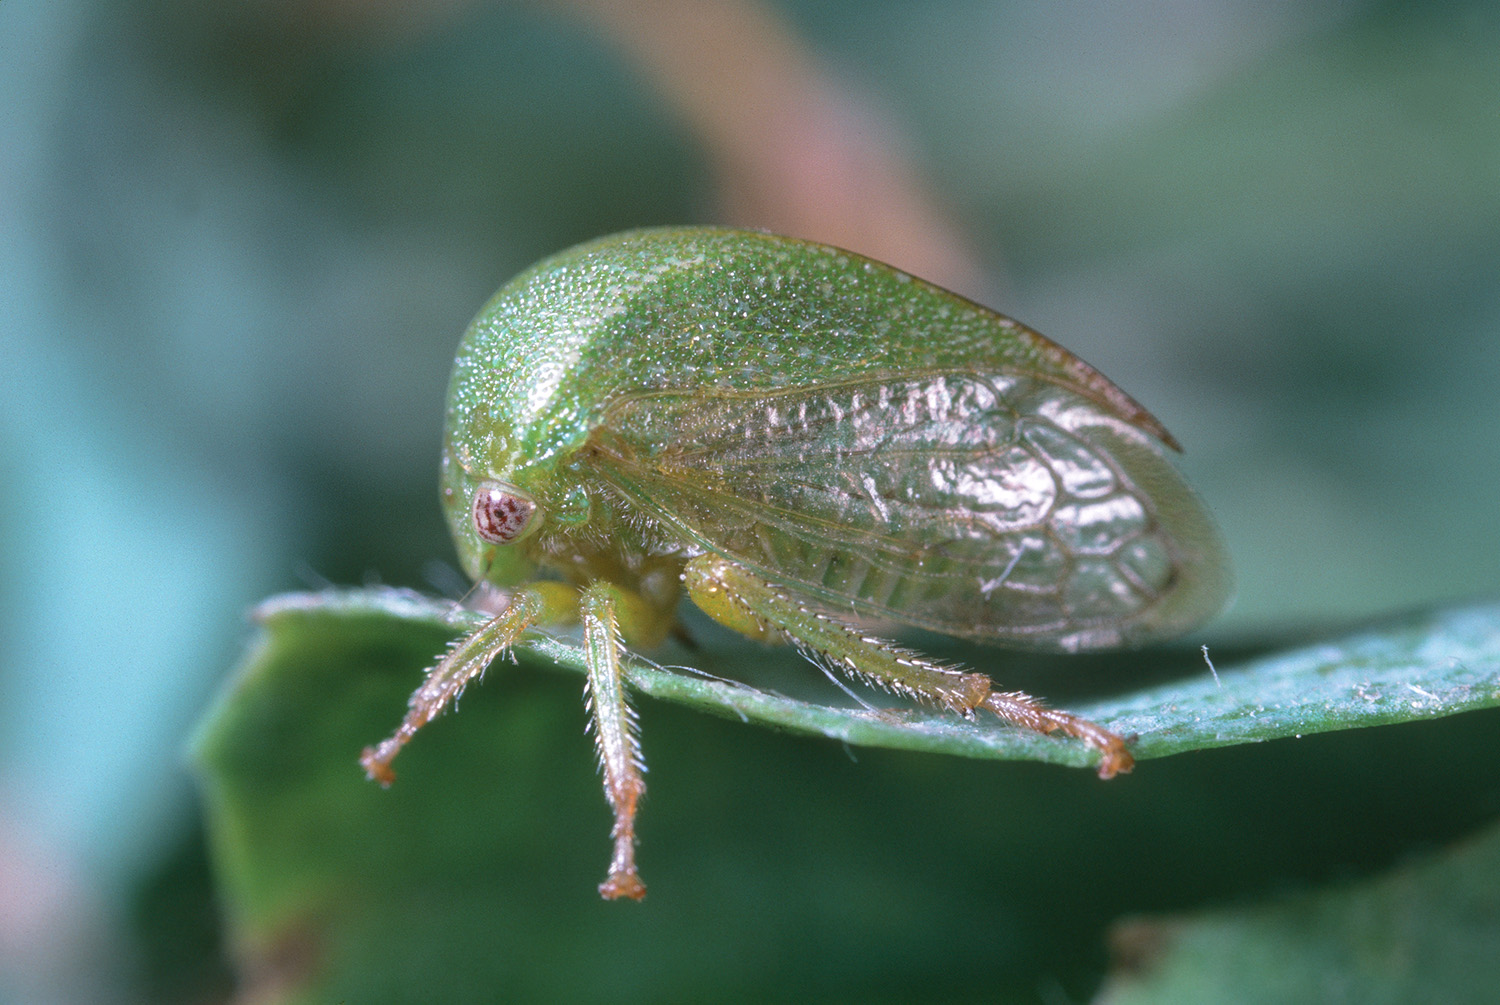
As researchers began to study Grapevine red blotch virus in grape vineyards and what causes this virus to spread,…
Read Article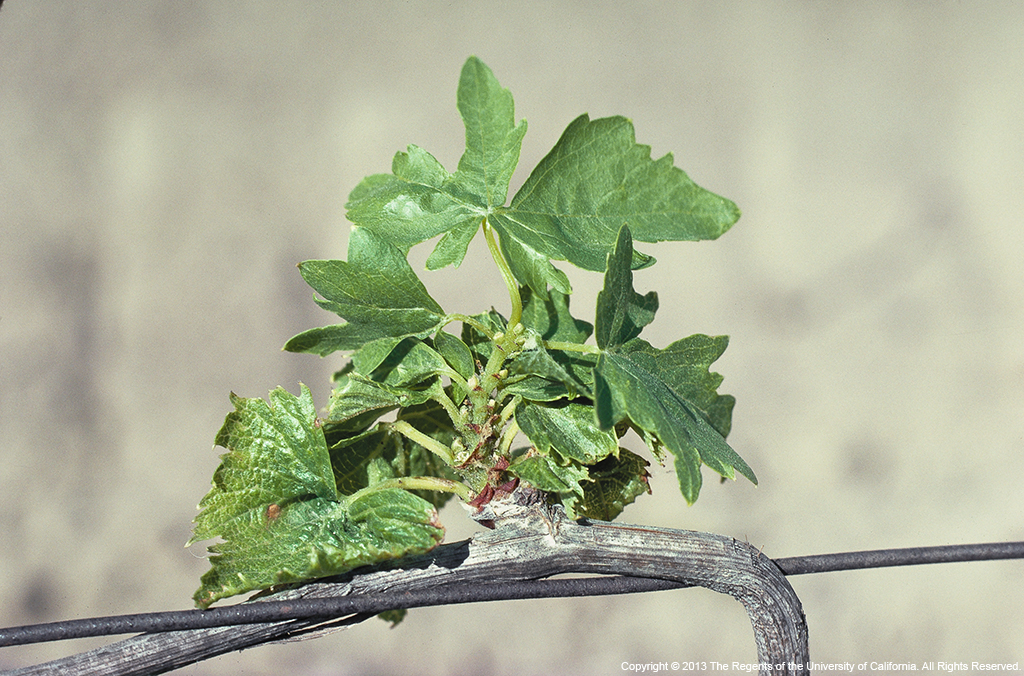
The San Joaquin Valley (SJV) is in the midst of an ongoing drought. Total precipitation in Fresno from…
Read Article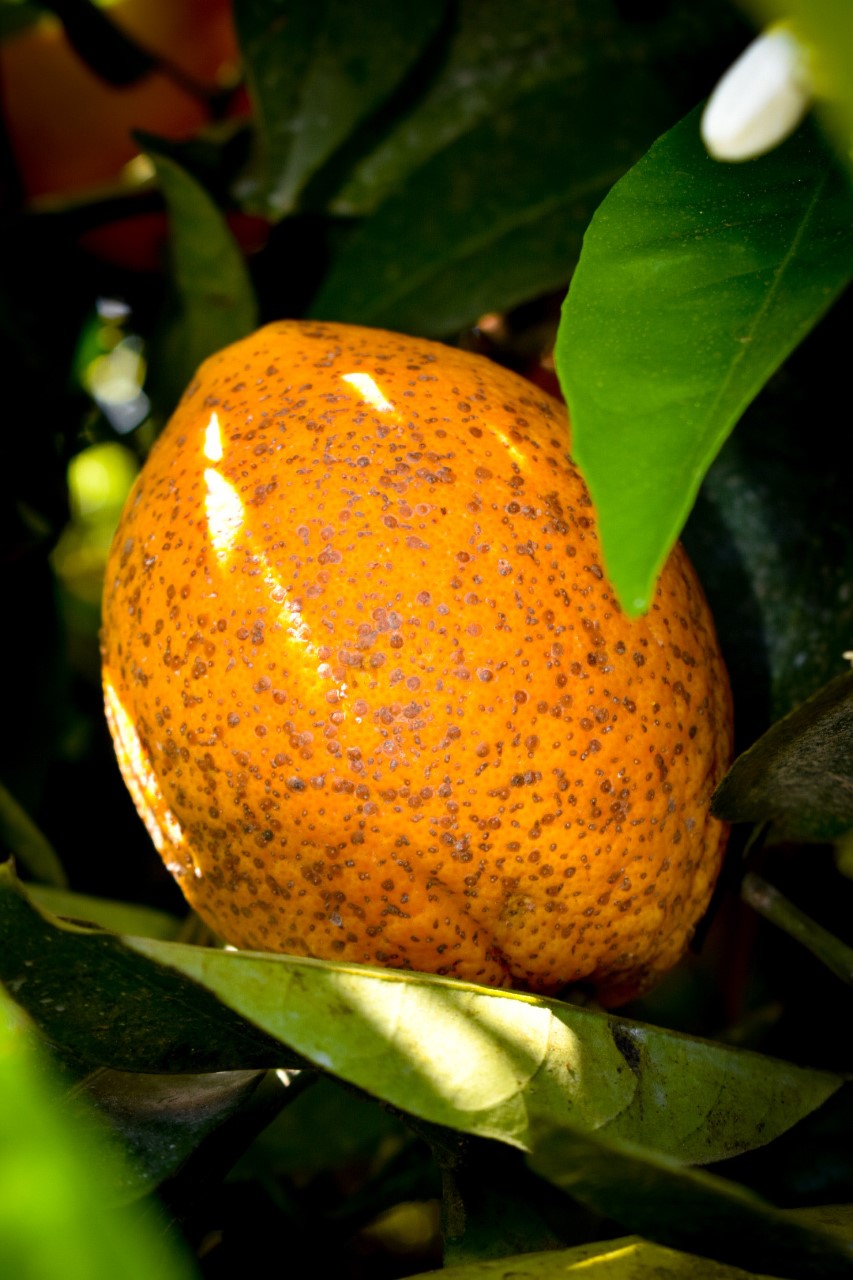
California red scale, Aonidiella aurantii, is one of the primary insect pests of citrus crops in California and…
Read Article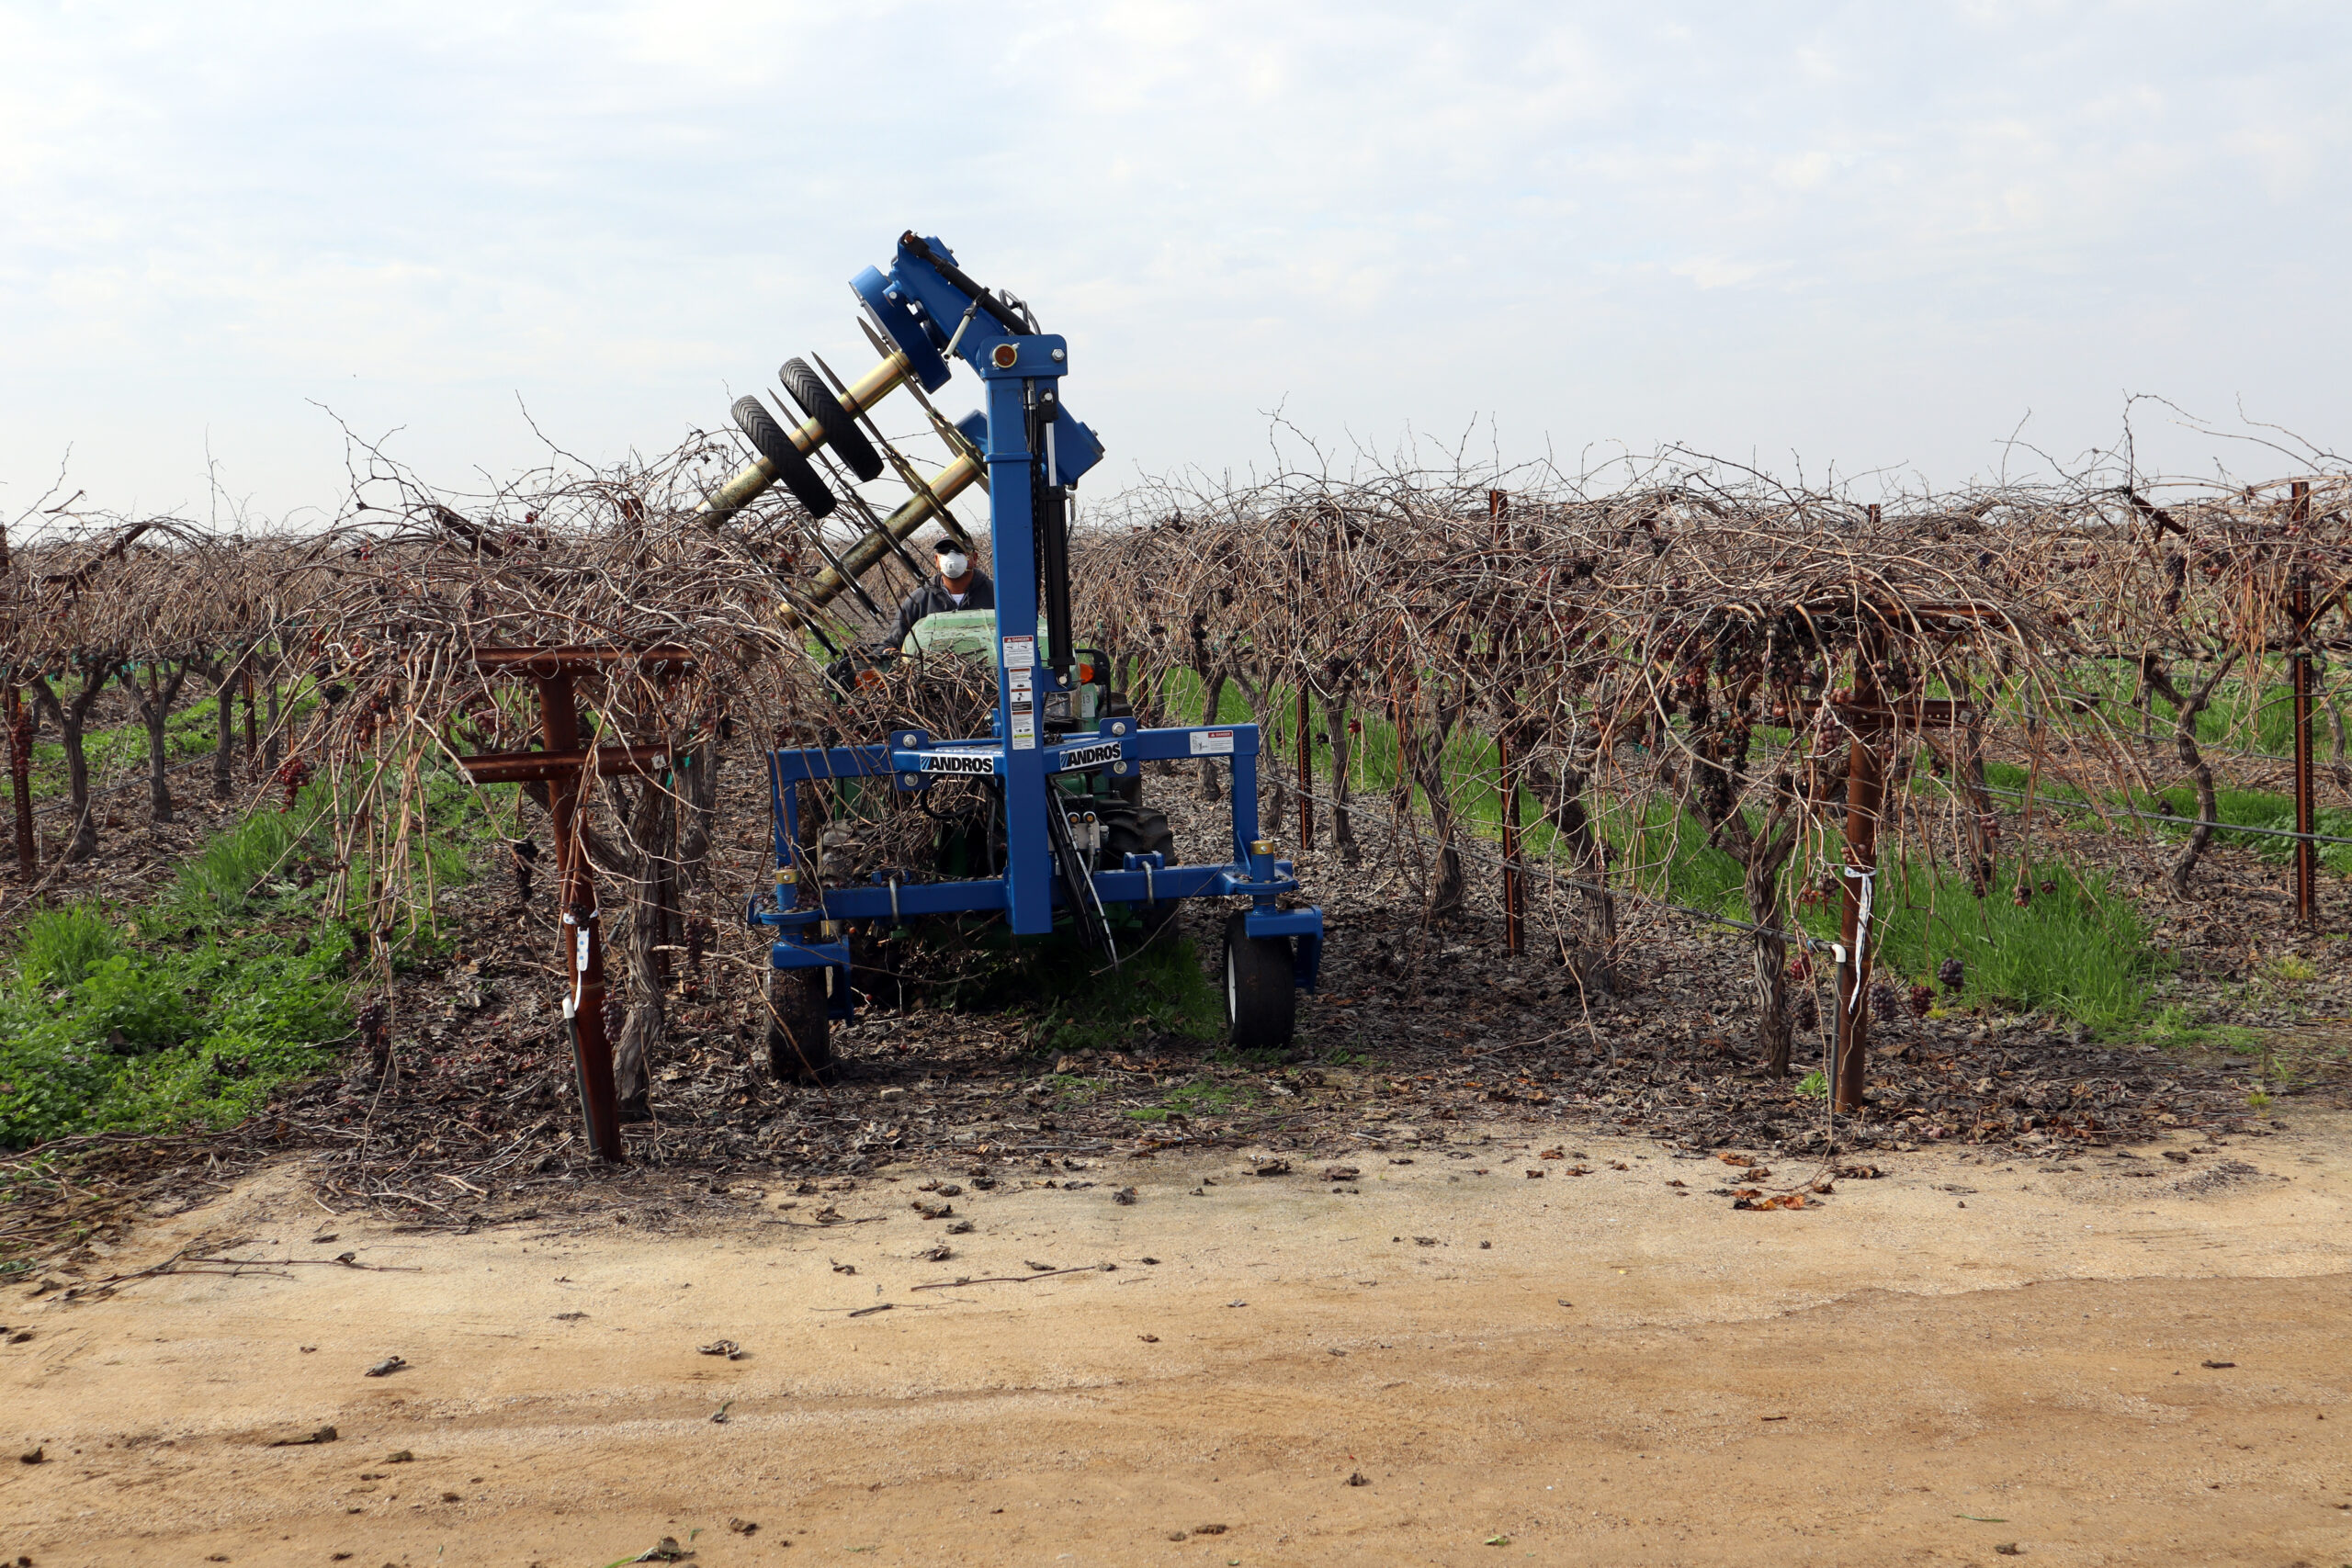
Mechanization is clearly one of the best solutions to reduce labor requirements for vineyard management and lower production…
Read Article
Aflatoxins are a category of mycotoxins, which are toxic compounds produced by fungi (Myco= µύκης, which means fungus…
Read Article