There is no denying now the fact humic and fulvic acids are not snake oils, but rather an important pillar to all crop nutrition and protection programs. It is important to fully understand how the two products differ and how each has a valuable place in the field, no matter the crop. To make sense of this, we must ask a few important questions about humic and fulvic acids to have a better fundamental understanding of them and how crop advisers and growers look at the use of these products in a matter that makes sense agronomically. With current budget constraints, when do humic and fulvic products make the most sense? What constitutes the right choice of product? All very important questions to ask of the humic and fulvic acids of final choice.
Humic and fulvic acid comprise the ‘organic acid’ category of plant biostimulant products, with both being used to enhance plant uptake of nutrients and other foliar chemicals.
Humic Acid
There is both a dry and a liquid option when it comes to humic acid products. This leaves a perfect flexibility in options to meet needs of growers in nearly all situations. Humic acid chains can vary in size and length depending on quality. So inherently they have a certain place where they fit.
Dry humic acid, commonly known as Leonardite, is a black to brown soft and soluble product that can be spread alone or blended with most fertilizers to improve soil conditions and nutrient availability. Adding dry blended Leonardite to dry phosphate fertilizers is a great way to improve availability of phosphates upfront, but it’s also a great tool in remediation of sodic ground.
Liquid humic acid should be rich in color. No matter the quality, humic acid can be littered with solids and particulates to plug screens and nozzles. This can leave a grower or advisor feeling frustrated, whether from plugging or what’s left in the product container. Find a high-percentage humic that has been refined in some matter. These products exist and are made in a variety of ways to be clean and particulate-free. You should have a humic acid product you can confidently be able to spray or run through a drip system with no issue. While I do struggle professionally with using humic acid as a sprayable product, it is widely used in ‘high-value’ foliar sprays, and I feel the value there comes from the fulvic acid content in that humic product to provide the efficacy sought in the addition to the spray tank. Additionally, humic alone can play a role in buffering the tank components, leading to more successful sprays.
Fulvic Acid
Fulvic chains are small, much smaller than that of humic acids. That molecule size allows for it to pass through the leaf with ease while acting as a chelating agent to allow the tank mix partner into the leaf. So, fulvic has a definite use with foliar nutrients, translaminar and systemic insecticides, fungicides and, most importantly, herbicides. As a crop adviser, the last four to five seasons I have written into most herbicide recommendations a fulvic acid to aid in efficacy. It took me some time to get on board, but I have seen a significant increase in efficacy in translaminar insecticides and in use with herbicides. This has helped greatly in areas where I question herbicide resistance. The efficacy increase is noticed, and from my preferred source of product, the cost is around $1.25/acre.
Search for humic and fulvic products that meet the intersection of quality and cost. Just because a product is expensive does not always make it better. Being at a lower price point does not make it inferior. A clean and quality product is the key, more so for your humic acid choice over the fulvic product choices, which are normally refined, clean and pure. Challenge your provider to show the tests and testing methods used to establish quality.
Phosphites are more readily available to plants in comparison to phosphates.
Phosphite has been a controversial topic for years. Its use and benefits are argued in hundreds of research papers across the world’s scientific communities. Is it a fertilizer, a biostimulant or a fungicide? These questions are discussed in multiple university research results. I believe if we look carefully, we can conclude phosphite serves all three functions. As with everything we do with chemicals and nutrition, we need to be aware of possible negative effects. We also need to determine how we are using the phosphite materials and the results we are seeking.
Phosphite (PO33-; Phi), a reduced form of phosphate (PO43-; Pi), is widely marketed as either a fungicide or fertilizer or sometimes as a biostimulant. Because crop consultants, growers and distributors see the product marketed in all three ways, it can cause confusion. Each designated use will most likely be tied to the phenology (growth stage) of each treated crop. Timing is critical to determine which effect we are seeking. We have addressed phosphite in a nutrition role in Part One of this article series. Part Two spoke of Phi in terms of a biostimulant. In this article, we broach the controversial topic of Phi as a fungicide.
Phosphite can serve as a fertilizer, biostimulant or fungicide depending on the growth stage of the crop it’s applied to.
Usage
Phi salts can be used as a biodegradable fungicide to protect plants against Phytophthora dieback. It is usually applied as potassium phosphite, derived from phosphorus acid neutralized with potassium hydroxide. Calcium and magnesium phosphite may also be used. One way Phi works is by boosting the plant’s own natural defenses and thereby allowing susceptible plants to survive within Phytophthora dieback infested sites. It is important to note there is no treatment that will eradicate Phytophthora dieback.
Phi can enhance plant health directly through control of selected fungi on cultivated or native plants. In general, Phi acts as a priming agent of several plant defense responses. Excellent reviews on the use of Phi to control or reduce the severity of selected plant diseases have been published. Phi-based fungicides often are labeled as fertilizers because of significantly less complex and costly regulatory approval processes required for fertilizers compared to fungicides. Use of Phi as a fungicide is primarily targeted to control of oomycete pathogens like those of Phytophthora but has been shown to control many others. In studies, growth of a Phi-sensitive strain was inhibited regardless of phosphorus supply, whereas resistant strains were inhibited by Phi only under low Pi levels. Phi is effective in controlling root and crown rot caused by Phytophthora, and researchers reported a linear reduction in the severity of downy mildew and a significant improvement in soybean with an increase. Significant Phi control of Phytophthora disease in citrus may be achieved through both soil and foliar applications. Soil-applied Phi was more effective in controlling citrus root rot. In addition, some nematode control has been documented.
The concentration of Phi at the infection site is key.
Phosphite can act as a fungicide by triggering antifungal metabolism and/or inhibiting fungal growth.
At lower levels of concentration, antifungal metabolism can be triggered, and at higher concentration, Phi can inhibit fungal growth. Ink disease in walnuts was significantly reduced through some treatment methods. Foliar-applied Phi has been successful in controlling pecan scab. Phi has also shown it can be effective in crown rot on peppers. Fungicides containing Phi can suppress foliar and soilborne diseases. With foliar diseases, repeated applications are frequently needed as Phi should be present at the time infection occurs. In contrast to non-systemic fungicides (e.g., mancozeb) labeled for oomycetes, Phi is readily translocated throughout the plant, which is especially advantageous for disease control in potato tubers and other underground plant tissue in potatoes. Phi has been foliar applied during the growing season or sprayed on potatoes after harvest both with excellent fungal disease control.
Interestingly, phosphite has been shown effective against summer decline in creeping bent grass by pythium. Root and shoot growth improvements have been observed in turf management along with good control on dollar spot. Additionally, positive control of pythium in bluegrass was observed. Pythium blight suppression due to Phi treatments on perennial ryegrass and creeping bent grass and anthracnose basal rot on an annual bluegrass were reported.
Phosphites are more readily available to plants in comparison to phosphates.
Disease Control Spans Wide
The benefits of Phi in the control of numerous diseases have been researched for years. The number of research reports is too numerous to go into in a short review. I encourage PCAs to research this effective tool on their own and find the fit in the crops they manage. We need every tool at our disposal, and Phi is proven to be effective through research. I caution to use Phi products correctly and beware as all are not created equal. Without special stabilization, they do not mix well with metal micronutrients or metal-containing fungicides and pesticides. There is currently technology that allows you to mix phosphites safely and effectively. Go to the following website to learn more about the special patented technology that can stabilize your phosphite and allow safe tank mixing and complete efficacy of applied products: vlsci.com/products/nutri-phite/.
Controls that have been reported:
Apple Mouldy core, Alternaria alternate
Avacado Dieback, Phytophthora cinnamomi
Banksia Dieback, Phytophthora cinnamomi
Bentgrass Summer decline, Pythium
Cabbage Clubroot, Plasmodiophora brassicae
Chestnut Ink disease, Phytophthora cambivora
Cucumber Damping-off, Pythium ultimum
Grape Downy mildew, Plasmopara viticola
Lupin Dieback, Phytophthora cinnamomi
Maize Downy mildew, Peronosclerospora sorghi
Orange Brown rot, Phytophthora citrophthora
Papaya Fruit rot, Phytophthora palmivora
Pecan Scab, Fusicladium effusum
Pepper Crown and root rot, Phytophthora capsici
Potato Late blight, Phytophthora infestans
Potato Pink rot, Phytophthora erythroseptica
Potato Bacterial soft rot, Erwinia carotovora
Soybean Downey mildew, Peronospora manshurica
Strawberry Leather rot, Phytophthora cactorum
Tangelo Brown spot, Alternaria alternata
Tobacco Black shank, Phytophthora nicotiana
Three-dimensional chemical structures of phosphate (H2PO4−; Pi) and phosphite (H2PO3−; Phi) forming tetrahedral structures.
References
Understanding the Phosphonate Products – Penn State Extension
extension.psu.edu
Jan 1, 2023 … Phosphonate fungicides and fertilizers are absorbed by plants and incorporated into cells as phosphite ions (H2PO3-). The fact that this ion …
Phosphites Fungicide Products for Golf Courses
www.golfventures.com
Phosphite treatments works by boosting the turf grasses own natural defenses and thereby allowing susceptible plants to survive infections. Most turfgrass …
Review of Phosphite as a Plant Nutrient and Fungicide – MDPI
www.mdpi.com
Aug 30, 2021 … Phosphite (Phi)-containing products are marketed for their antifungal and nutritional value. Substantial evidence of the anti-fungal …
Phosphite (Phosphonate) fungicide treatment – Chemjet
www.chemjet.co.uk
Phosphite salts can be used as a biodegradable fungicide to protect plants against Phytophthora dieback. It is usually applied as potassium phosphite, …
Study 1: Phosphite fungicides and fertilizers and contact fungicides
www.gcmonline.com
Not applicable phosphite standard phosphorous acid potassium phosphite. 70.5 grams/liter. 30.9 fluid ounces. 0.17. Acros Organics. Not applicable.
Understanding the Phosphonate Products – Penn State Plant
d2j31icv6dlhz6.cloudfront.net group of turfgrass products known as phosphonates (potassium phosphite, phosphorous … Phosphonate fungicides and fertilizers are absorbed by plants and …
Clarification on Phosphite Materials | UGA Pecan Extension
site.extension.uga.edu
Mar 23, 2020 … Dr. Tim Brenneman first began testing phosphite materials on pecan primarily … should be tank mixed with another fungicide for nut scab.
Association phosphite x fungicide: protection against powdery …
link.springer.com
Mar 22, 2022 … Phosphite-based formulations are used as fungicides, biostimulants, and fertilizers (Gómez-Merino and Trejo-Téllezb 2015). Phosphites can act …
Phosphite (phosphorous acid): Fungicide, fertilizer or bio-stimulator?
www.tandfonline.com
Phosphite (Phi), a reduced form of phosphate (Pi), is widely marketed as either a fungicide or fertilizer or sometimes as a biostimulant. This is …
Phosphites For Lawns – Fertilizer Or Fungicide? – YouTube
www.youtube.com
Jul 15, 2021 … Phosphites garner wide acclaim in the professional turfgrass world; however, with their appearance in lawn care – a series of questions …
Aboveground and belowground, cover crop biomass builds soil organic matter, which can improve nutrient cycling and retention, water holding capacity, water penetration and infiltration (all photos courtesy Shulamit Schroder, UCCE.)
Soil health is defined as the continued capacity of soil to function as a vital living ecosystem that sustains plants, animals and humans, according to USDA. This includes providing space for root growth and respiration; moving water rapidly and allowing water to infiltrate in the soil profile; storing water for future crop use; and providing habitat for soil organisms including soil microbes. When we build soil health, we are increasing the capacity of our soil to do the jobs we need it to do, which can improve crop production.
Cover crops are plant species selected and grown for their protective and beneficial contributions to soil health. They help meet three of the soil health principles: maintaining a living root, increasing plant diversity in the rotation and maintaining soil coverage. Cover crops help keep ground productive in the long term by physically protecting the soil from erosion, maintaining soil structure and building soil tilth and fertility. Aboveground and belowground, cover crop biomass builds soil organic matter, which can improve nutrient cycling and retention, water holding capacity, water penetration and infiltration. Both cover crop residue and roots provide essential sources of food for soil macrofauna and microbial life. Soil microbial communities contribute toward disease suppression and nutrient cycling, especially nitrogen. Soil organisms are also essential for building and maintaining soil structure including aggregate stability and soil porosity. Improved soil structure in the form of better soil water holding capacity may reduce irrigation applications in future years.
A 2022 UCCE Cost Study estimates the cost of producing a cover crop in the lower Sacramento Valley to be $156/acre. Cash and labor costs associated with seed, legume inoculum, planting and termination activities dictate the useability of this study in different regions or operations.
Cost to Produce
All these potential benefits come with a cost to produce; a 2022 UCCE Cost Study estimates that to be $156/acre. This cost study models the planting and management of a winter cover crop in a summer crop rotation planted in the lower Sacramento Valley of California. The rotation may include processing tomatoes, corn, sunflower, safflower, sorghum and/or dry beans as well as other summer annual crops. This study models a field following harvest of processing tomatoes in the fall and a planned rotation into a spring-planted field crop. Despite the benefits, cover cropping is not realistic for all operations. From timing and logistics to equipment, there are numerous reasons why a farm cannot adopt this practice. Farmers and researchers are exploring more ways to cover crop than the scenario in this study.
The useability of this study in different regions or operations lies in understanding the costs accounted for in the $156/acre. The costs include cash and labor costs associated with seed, legume inoculum, planting and termination activities (mowing and discing two times). Because cover crops are part of a rotation between cash crops, some soil preparation practices were not charged to the cover crop. Preplant practices, including ripping the furrows, disking and rolling two times and landplaning, are considered preparatory practices for the cash crop, not the cover crop. Historically, cover crops are exclusively rainfed. However, variation in annual winter rainfall amount and timing is increasingly common. Therefore, two irrigation events are included in one out of every three years. Make note that the cost of water varies widely across regions and operations and may differ considerably from $5.42 per acre inch used in the study. This study includes a sprinkler irrigation system but assumes the equipment was not purchased for cover crop production. Thus, only labor and water costs are attributed. Each table has a “Your Costs” column in which users can add any additional costs for their operations. For example, renting sprinkler irrigation equipment will have higher irrigation costs than those listed.
Despite the multiple benefits from cover crops, nitrogen is the only economic return included in the study. We estimate 100 pounds of nitrogen are fixed per acre by the mixed legume-cereal cover crop, and 30% of this nitrogen mineralizes and becomes plant-available to the following crop in the first season. Thus, 30 lb/acre of nitrogen are attributed as a return from the cover crop at a rate of $1.20/lb ($36 return). Both the amount of plant-available nitrogen and value of nitrogen are conservative estimates. Few studies document the other benefits in dollars. Cover crops can increase soil workability, reducing labor and fuel costs for field work. Planted in rotation or in otherwise fallow fields, cover crops can suppress winter weeds. Weed suppression can reduce the need for herbicide sprays used to maintain a winter fallow. This can save up to $65/acre, including materials, fuel and labor. Cover crops can capture residual soil nitrogen to reduce nutrient runoff and leaching. This may ultimately contribute to the maintenance and protection of downstream water quality while simultaneously returning nitrogen to the subsequent crop post-cover-crop-incorporation. Recruitment of beneficial insects and pollinators is another benefit with potential economic returns among others.
Maintaining the viability of our California farmland is critical for our food supply and protecting our agricultural economy. Cover crops can play a pivotal role in building and maintaining soil health and ensuring land remains farmable for the long term. The true cost of cover crops is complicated given the hard-to-measure benefits that dominate the decision to grow cover crops. Nonetheless, accessing these benefits through a cover crop comes at an estimated cost of $156/acre. For some, that may be a screaming deal. For others, this practice may not be logistically possible or economically feasible.
Whole-orchard recycling encourages growers to use end-of-life orchards to improve organic matter and soil quality, water productivity and crop yield potential (photo courtesy Heliae Agriculture.)
Whether you’re harvesting nuts or fruit, all orchards have one thing in common at the end of their productive life cycles: Growers need to have a plan for tree removal.
Burning trees or selling wood chips to fuel-burning power plants is becoming a less viable option. Many power plants have gone out of business, and air regulations encourage or force growers to seek alternative disposal options.
Market shifts and policy changes have resulted in a relatively new concept: whole-orchard recycling (WOR). This regenerative agriculture practice encourages growers to use end-of-life orchards to improve organic matter and soil quality, water productivity and crop yield potential.
Yet, any grower who’s new to WOR will ask, “How much will this cost me?”, because the bottom line matters.
While more expensive than burning, there are many funding opportunities for growers who choose WOR. Plus, the long-term return on investment for this regenerative agriculture practice is well worth the outlay.
The Process: Recycle Your Orchard
Whole-orchard recycling turns low-yielding and unproductive trees into organic matter to support the next orchard. The process is relatively simple and straightforward.
Excavate the trees from the ground. Try to remove as much of the roots and the crown as possible from these aging and low-yielding trees.
Grind wood chips into either 2-inch or 4-inch screen size. 2-inch screen sizes are less likely to interfere with orchard floor management activities and less likely to harbor pathogens. They’ll also be easier to spread and incorporate into the soil.
Load wood chips into a modified manure spreader. This is the easiest way to disperse chips evenly across the orchard floor. Growers may consider 1-foot-deep dispersion of chips near piles, and 1-inch-thick dispersion in the far corners of the orchard.
Deep rip soil. A 5- to 6-foot-deep rip can break up compaction layers and pull out any remaining roots.
Smooth out ruts created by the ripper and incorporate chips. Growers can use a stubble disk, plow or rototiller to smooth out orchard floors and mix chips with soil.
Fumigate for extra protection. Experts suggest fumigating between 18 and 24 inches deep.
Almond Board of California, a leader in the WOR space, encourage growers to take a year off before replanting. Ripping, mulching, spreading, incorporating, fumigating and irrigating can take many months to complete.
By feeding your soil microbes a carbon product, you can make the most of the cost of WOR and support long-term soil health and your goals for your next orchard.
Ways to Pay for the Upfront Cost of Whole-Orchard Recycling
The process is relatively simple, yet WOR is more expensive than traditional end-of-life management for orchards. Researchers at UC Davis estimated WOR can cost $125 to $810 more per acre than burning; yet, you don’t have to pay the bill on your own. There are many organizations that provide funding for this regenerative ag practice.
Here’s how to offset the up-front cost of WOR: For Growers in the San Joaquin Valley: The Open Burning Incentive Program Growers in the San Joaquin Valley have a unique opportunity to apply for funding when opting to recycle their orchards. $220 million has been set aside for growers choosing WOR.
The funding grants $600 per acre to orchards and $1,300 per acre for vineyards.
For California Growers: California Department of Food and Agriculture Funding The California Department of Food and Agriculture’s Healthy Soil Initiative gave many growers funding for their no-till practices in their orchards and vineyards starting in 2021.
Keep an eye on their site for when applications open for 2024 funding.
For California Growers: Check with Your Local USDA-NRCS for Incentives Your local U.S. Department of Agriculture Natural Resource Conservation Service may provide incentives for WOR through the Conservation Stewardship Program.
For California Growers: Environmental Quality Incentive Program (EQIP)
Another program hosted by the USDA-NRCS, EQIP was created to provide financial and technical support to those using regenerative agriculture practices with direct ties to environmental benefits. WOR improves air quality and soil quality, so orchard owners qualify for funding.
Long-Term Return on Investment of Whole-Orchard Recycling
When you sort out the financing to recycle your orchard, you can look forward to the long-term benefits and return on investment. Here’s a short list of the perks WOR offers your future orchards.
Improves Soil Health and Structure by Adding Organic Matter to Soil
Burning releases carbon stored in woody debris. When this happens, carbon is lost forever and can’t support your future trees. Long-term and short-term studies suggest recycling trees can add carbon, soil nitrogen and organic matter. 22 to 40 tons of organic C is returned to the soil per acre when recycling trees.
This makes your unproductive trees a short-term and long-term carbon provider. Up to 30% of carbon can be released as CO2 in the first year after recycling. The rest slowly degrades, providing a continuous nutrient source for new orchards. Plus, when you incorporate wood chips into the soil, it enhances the soil structure and texture, improving tree root growth. Healthier soils have been found to dramatically improve the odds for a healthier orchard and higher yields.
Provides Better Carbon Sequestration As mentioned, burning trees releases carbon, but chipping and incorporating trees into your soil stores carbon. This can improve your community’s air quality and reduce greenhouse gas emissions.
Strengthens Water Productivity Since WOR is great for your soil, it’s also great for your water productivity. When trees are chipped and incorporated in the soil, it increases water use efficiency, infiltration, aggregation and water holding capacity.
While drought conditions have improved in California this year, growers would be smart to make the most of their water regardless of precipitation given that great water management can improve tree resilience.
Increases Cumulative Yield With healthy soil and improved water use, the health and productivity of an orchard increases, and the crop yield potential increases, too. One study at UC Davis found a second-generation almond orchard had a 20% increase in yield when WOR was coupled with regular nitrogen (N) and irrigation regime.
Pro Tip: Maximize Your Crop Yield Potential with a Carbon-rich Microbial Food Want to help your new trees access nutrients from your wood chips sooner? Maximize your WOR investment with a carbon-rich microbial food.
Start by conducting a test with a trusted crop adviser after tilling to find out the diversity and activity of your soil microbes. In most farm soils, 75% of soil microbes are inactive.
An active, healthy soil microbiome can:
Improve soil texture and structure
Improve water holding capacity by up to 10%
Optimize fertilizer applications
Optimize manure and compost applications
Mitigate abiotic stress throughout the season
Fight soilborne diseases
Boost crop yield performance and ROI
Feeding microbes stimulates microbe activity and accelerates breakdown of wood chips to free nutrients tied up in the wood chips.
By feeding your soil microbes a carbon product, you can make the most of the cost of WOR and support long-term soil health and your goals for your next orchard.
Community Benefits of Whole-Orchard Recycling
WOR is currently supported by air regulators and regenerative agriculture specialists, especially in areas of California like the San Joaquin Valley. There will be an 80% to 90% reduction in San Joaquin Valley orchard burning, according to CARB’s Chief of Air Quality Planning and Science Michael Benjamin.
Last year, nut orchards with more than 500 total acres were unable to burn.
This year, operations with more than 200 can no longer burn.
By 2025, all ag burning will be banned except for special situations, like disease- or pest-ridden fields.
This is to support better air quality for the Valley. With over 9 million acres of farmland in California, burning will likely become less encouraged throughout the state year after year.
The times are changing, and those who find a way to make WOR work for them will reap the benefits in their crop yields to come. California growers will likely be on the forefront of this shift, continuing to produce tree crops that feed the U.S. By using the financial support available for WOR, growers can make the most of their aging orchards and support their future trees.
Figure 1. Visual symptoms of Grapevine Red Blotch Virus showing in older leaves of an infected vine. Notice healthy vines on either side showing yellowing leaves as the vines prepare to drop the leaves (all photos by J. Tanner, courtesy University of California.)
Grapevine Red Blotch associated Virus (GRBaV) is the causal viral agent responsible for Grapevine Red Blotch Disease. This pathogen negatively impacts grape production by reducing fruit quality and yield. It can cause several physiological changes in vines, including changes in leaf color, reduced ripening speed and decreased fruit quality from reduced sugar and anthocyanin accumulation in the grapes. This reduction in fruit quality can lead to reduced market value, affecting the profitability of an impacted vineyard. The degree to which GRBaV will impact fruit quality and yield can vary from year to year within a vineyard but increases with the percent of infected vines contributing to the harvest. The exact mechanism by which Red Blotch reduces sugar accumulation in grape berries is still unclear; however, the available evidence suggests the virus affects the expression of genes involved in sugar transport and metabolism as well as in hormone signaling pathways that regulate sugar accumulation in grape berries.
Red Blotch disease was first discovered in Napa Valley, Calif. in 2008 when it was realized to be a new disease separate from leafroll which also causes similar red leaf symptoms as well as a reduction in fruit quality and yield. The similarities between the effects of Red Blotch and leafroll viruses likely played a role at masking the presence of Red Blotch virus until efficient virus screening techniques for GRBaV were commonly employed. At the point of its discovery, Red Blotch disease was not a newly emerged viral disease but rather a viral disease new to our recognition as a viral disease. Due to the misidentification of GRBaV in symptomatic grapevines, the virus may have been widely spread across California by the time a screening procedure was developed to identify its presence in plant tissues. To this point, Red Blotch virus was detected in herbarium samples collected several decades before the formal recognition of the virus. Red Blotch virus is the only member of the genus Grablovirus within the family Geminiviridae and has been separated into at least two clades of distinct strains of the virus. While originally recognized in California, it has since been found in several grape-growing regions worldwide. Grapevine Leafroll-Associated Disease, on the other hand, is caused by one of six viruses from the family Closteroviridae.
Grapevine Leafroll-associated Virus (GLRaV) is one of the most important viral diseases affecting grape production worldwide. Of the six viruses associated with leafroll disease, GRLaV-3 in the genus Ampelovirus is the most predominant; GLRaV-2 has also been noted as impacting large numbers of California’s vineyards.
Figure 1. Visual symptoms of Grapevine Red Blotch Virus showing in older leaves of an infected vine. Notice healthy vines on either side showing yellowing leaves as the vines prepare to drop the leaves (all photos by J. Tanner, courtesy University of California.)
Leaf Symptoms
Often described as beautiful fall color by visitors to the vineyard around harvest time, the development of red leaves in red grape varieties is a sign the vines are not healthy. The most prominent visual symptoms of Red Blotch are reddish-pink blotches or patches that appear on the leaves of infected red grape varieties. These blotches usually appear later in the growing season, usually after véraison, first appearing on older leaves near the bottoms of shoots and later developing on leaves higher up the shoot. These blotches are irregular in shape and often have a mosaic pattern. Foliar symptoms of GRBaV and GLRaV are visually similar, and both result in red- or yellow-toned tissue of the leaf blade depending on the grape cultivar. With Red Blotch, the leaf veins also turn red which is in contrast with leafroll in which the veins remain green. Another subtle difference is that Red Blotch does not distort the shape of the leaf causing the leaf blade to remain flat while Leafroll-associated viruses can cause some leaf blades to roll down along the margins, resulting in a downward curl. When a vine has Grapevine Red Botch Virus and a Grapevine Leafroll-associated Virus, leaf symptoms usually present as typically expected for Grapevine Leafroll associated Viruses with leaves showing green veins and some degree of leaf rolling. Towards the end of the season, symptomatic leaves from either virus may turn completely red, complicating visual diagnosis. In white varieties of grape, both viruses are much less conspicuous as the leaves do not turn red but may present in a subtle, yellow-chlorotic, patchy pattern.
Virus Spread Through Infected Material
Both viruses can be transmitted through propagation of infected planting material. The use of CDFA-certified virus-tested vines is an important initial step in excluding viruses in your vineyard. As there is currently no cure for vines once infected with Red Blotch or Leafroll, the use virus-free planting materials and the removal of infected vines is the first line of defense in virus management. Scouting and monitoring vineyards for red leaf symptoms in the fall is essential for early detection. PCR testing can be used to confirm viral presence in visually identified symptomatic vines if there is any doubt about the symptoms and is especially useful for confirming virus status of white grape cultivars. Once identified, infected vines should be rogued from the vineyard to reduce pathogenic inoculum and prevent them from serving as a source of virus that could inflect healthy vines. Vines identified in the late part of the growing season should be removed before the start of the next season to minimize the spread of the virus by insect vectors.
PCR-based testing methods are the standard for determining virus status of individual vines with a high degree of accuracy but becomes cost-prohibitive at commercial scales. New approaches to virus identification are being developed to allow for screening of vines rapidly and accurately within a whole vineyard. The use of drone-based hyperspectral imaging has been demonstrated to be more accurate at identifying vines infected with Red Blotch or Leafroll compared to visual scouting by experts when coupled with machine learning methods. Another approach in development involves the use of dogs trained to detect virus in vines. Other methods in development include non-destructive wavelength transmission and reflection to identify foreign organisms within the vine without damaging the plant.
Figure 2. Red leaf virus symptoms on Cabernet Sauvignon. Grapevine Red Blotch Virus (left) showing mosaic pattern of red patches with red leaf veins, Grapevine Leafroll-associated Virus (right) showing red patches and green veins.
Virus Spread by Insect Vectors
The three-cornered alfalfa hopper (Spissistilus festinus, TCAH) is currently the only confirmed vector of Red Blotch virus. It is an insect that can feed on many plant species including grapevines and is widely distributed throughout the U.S. Plants such as alfalfa and other legumes serve as the preferred hosts for TCAH; however, as these plants dry up over the season, TCAH will migrate onto less preferred hosts such as grapevine. This pattern of micro-migration may be particularly problematic in vineyards where annual cover crop decline occurs near the beginning of vegetative growth for grapevines. TCAH can acquire GRBaV from feeding on infected plants and subsequently spread the virus to healthy vines. However, studies investigating the vector-capacity of TCAH have found they are not good at spreading the virus. TCAH is a circulative and non-propagative host where the virus does not replicate within the insect but is transferred into the salivary glands. TCAH requires an extended acquisition period of about 10 days to uptake the virus while feeding on infected vines followed by an extended inoculation access period of about four days of feeding on healthy vines to spread the virus. As grapevines are not the preferred host, TCAH populations usually remain low within vineyards and are mainly driven by the presence of legumes in cover crops. Timely management of cover crops by tillage before TCAH reaches adulthood may help reduce population sizes and limit virus spread by the alfalfa hopper. Additionally, removing unmanaged grapevines from the perimeter of vineyard areas is helpful as these vines can act as virus reservoirs and are particularly at risk of infection in riparian areas where insect populations may be higher. The work of identifying and confirming insect vectors of Red Blotch is ongoing, and there are many other insects identified as potential vectors currently under investigation.
Figure 3. Signs of three-cornered alfalfa hopper feeding damage causing leaf girdling (highlighted with arrows.) This sign does not indicate virus infection. Notice the red color of the girdled leaf compared to other leaves on the shoot.
Due to the feeding nature of TCAH, alternative plant hosts of GRBaV should be identified in California and managed to reduce potential inoculum sources near vineyards. To date, few endemic plant species within California have been tested to see if they can harbor GRBaV. However, researchers tested 13 species of woody, herbaceous plants from riparian areas which tested positive for GRBaV and identified two positive hosts: Himalayan Blackberry and a wild grapevine hybrid (V. californica x V. vinifera). In certain regions of California, a higher number of inoculum sources and alternative hosts for GRBaV may lead to higher pathogen pressure in vineyards with Red Blotch symptoms. With the potential for other insect vectors being able to transmit GRBaV, it is important to understand which plants in vineyard-adjacent ecosystems can increase risk of Red Blotch transmission into grapevines.
For Leafroll, several species of mealybugs (family Pseudococcidae) and scale insects (family Coccoidea) have been shown to be competent vectors. However, the most important vector of GLRaV is the vine mealybug (Planococcus ficus), an invasive species first detected in California in the mid-1990s which can have up to seven generations in a single growing season. The vine mealybug requires a period of as little as 15 minutes of feeding on an infected vine to acquire Leafroll. Because of the efficiency of virus uptake by the vine mealybug and the rapid nature of its reproductive strategy, in areas where vine mealybug is present, Leafroll has the potential for rapid spread. The most effective management strategy for vine mealybugs involves an integrated approach which includes the use of biological, cultural and chemical control methods as well as managing ants which protect mealybugs from their natural enemies. The parasitoid wasp Anagryus pseudococci and other beneficial species have been shown to successfully reduce vine mealybug infestations to manageable levels. A detailed guide to this approach is available at ipm.ucanr.edu/agriculture/grape/vine-mealybug/.
Figure 4. Vine mealybugs on the trunk of a grapevine revealed after removal of loose bark. Notice how the mealybugs are surrounded by ants.
In summary, both Red Blotch and Leafroll viruses can cause significant impacts to fruit quality and yield. Both viruses will cause symptoms of red leaves in red grape cultivars; however, slight differences between these symptoms can be visually identified and useful in distinguishing between the two. Once symptomatic vines are identified, PCR testing can confirm virus status. While both viruses can be vectored through the propagation of infected material, there’s great differences in the efficiency of virus spread by insect vectors. For Red Blotch, the three-cornered alfalfa hopper, requires an unusually long acquisition time of about 10 days of feeding on infected vines before it can spread the virus compared to the alarmingly quick uptake of Leafroll by the vine mealybug in around 15 minutes. Other potential insect vectors of Red Blotch have been identified and are currently under investigation. Additionally, the three-cornered alfalfa hopper usually doesn’t reach high populations within vineyards as the grapevine is not it’s preferred host plant; while the vine mealybug, on the other hand, due to its prolific reproductive strategy has the potential to reach very high numbers if left untreated in the vineyard. Once infected with Red Blotch or leafroll, there is no cure, and removal of the vine is the only sure way to prevent future spread to neighboring vines. Monitoring GRBaV symptomatic grapevines and removing them from the vineyard quickly may be the best approach to limiting the spread of Red Blotch at the moment. With research ongoing and without a clear understanding of how the virus can rapidly spread, reducing inoculum sources is a proven, preventative strategy.
Figure 1. Photographs of Pinot noir from the foliar Mg trial showing the canopies of the untreated control (left) and the high rate of Mg foliar treatment (right) taken in close proximity in one of the replicate plots on 9/30/22 (photos by P. Schreiner.)
Applying fertilizers or plant nutrients to foliage has a long history, and there is an extensive number of papers published on the subject. However, it may surprise some to learn that we still do not fully understand how nutrients applied to the foliage cross the leaf cuticle and enter the cytoplasm of plant cells where they can be used in metabolism. The cuticle is the main barrier to absorption of foliar applied nutrients.
Many Factors at Play
All aerial plant parts, including leaves and berries, are covered by a complex structure (a little like our own skin) known as the cuticle. The plant cuticle limits or regulates the transport of water and other substances between the plant and the environment, in addition to protecting plant cells from UV light and discouraging or sensing pests or pathogens. The cuticle is a hydrophobic layer formed just outside the cellulose cell wall that is composed mainly of the cutin polymer (a polyester) with waxes both embedded in it and covering its surface. However, numerous other chemical constituents beyond the scope of this discussion are also present in the cuticle and alter its properties with respect to the transport of any compound across this barrier. While there is still much debate about how different compounds (including plant nutrients) cross the cuticle, two major pathways of transport are known: the non-polar pathway or waxy pathway, and the polar pathway or aqueous pathway.
Table 1. Hydrated radius of different foliar nutrients that may be applied to plants.
Compounds that are soluble in oil or an organic solvent, such as some herbicides or even smoke-related phenols, cross the cuticle easily through the waxy pathway because they are basically soluble in it. However, most plant nutrients are polar compounds or ions that are water-soluble, and transport of these substances relies on the aqueous pathway. This aqueous pathway exists because of ‘aqueous pores’ that occur within the waxy cuticle. While these pores are known to exist based on indirect evidence, they have yet to be seen. Aqueous pores in the cuticle become more open or connected as the relative humidity in the air increases. Therefore, transport of foliar-applied nutrient ions is much greater at higher humidity, and spraying foliar nutrients early in the day when humidity is still high is more effective than at midday or in the afternoon when humidity drops. Higher humidity also translates to a longer time that the spray droplets remain wet, thus keeping ions in solution longer, which also facilitates greater transport across the cuticle. Humidity also affects what is known as the point of deliquescence (POD) for different ions, which is the level of humidity needed for a given ion to attract water vapor and remain in solution on a given surface. POD varies for different nutrients, but higher humidity levels increase the chance that POD will be exceeded.
Another property of nutrients or ions related to aqueous pores and transport through them is known as the hydrated ion radius, which is the molecular size of the given ion and those water molecules tightly adhered to it when dissolved in water (Table 1). Many macronutrient ions have a larger hydrated radius when compared to micronutrient ions. A smaller hydrated radius allows for greater transport through aqueous pores estimated from various studies to have a diameter of about 0.3 to 2.0 nanometers. This is one reason that foliar application of micronutrients is more effective than foliar application of macronutrients. However, one must also consider that micronutrients are needed in much, much lower quantities to be in a healthy range. Indeed, it would be difficult, if not impossible, to supply enough nutrients for most macronutrients like N through the foliage alone.
Table 1 shows that the hydrated radius for boric acid is actually on par with the macronutrients. Yet, we know that boric acid and other sources of boron (e.g., Solubor) are used very effectively to alleviate B deficiency in grapevines. This is because uncharged molecules cross the cuticle far easier than charged ions. While it is still not entirely clear, some foliar nutrition experts think that relatively small molecules that are uncharged, such as boric acid and urea, cross the cuticle via the waxy pathway. Indeed, water molecules appear to be transported to some extent via the waxy pathway, allowing some plants to take up significant water directly through their leaves.
Cuticles on the upper surface of leaves (known as the adaxial surface) are generally thicker than the corresponding cuticle on the leaf bottom surface (abaxial surface). When nutrients were applied separately to upper versus lower leaf surfaces, more transport occurred across the bottom side of the leaf, up to four times more. Another practical consideration to increase nutrient absorption is to ensure that sprays are well deposited on the underside of leaves by having good airflow during spraying. This could mean increasing fan speed.
Another consideration important for nutrient transfer is the contact angle of the spray droplets that land on plant surfaces. This property is mostly dictated by cuticle properties, particularly the waxes on the outer surface, and by the physio-chemical properties of the spray solution. Different plant species, different tissues (leaves vs fruits) and even different ages of the tissues along with the prevailing environmental conditions affect cuticle properties that alter contact angles. Spray adjuvants or surfactants can also reduce the contact angle (i.e., help spread out the droplets) and increase transport across the cuticle. Numerous studies using isolated cuticles have shown the importance of spray adjuvants to increase foliar absorption of nutrients. In addition, adjuvants can delay the drying time of droplets and keep the nutrient in solution longer, allowing for greater uptake. It should be noted that there are also cases where the naked nutrients alone (without spray adjuvants) were absorbed just as effectively as when applied with an adjuvant.
What about chelates? This area gets a lot of marketing attention, but due to the proprietary nature of many chelates sold, it is often difficult to untangle advertising from evidence that specific chelates actually improve foliar uptake. While there are cases where chelates have proven more effective than nutrient ions alone, there are also cases where they have not.
Finally, another factor still unresolved regarding foliar uptake of nutrients is the role of stomates and other structures on the external surface of leaves, such as trichomes (leaf hairs) and specialized cells above veins.
Recent findings show that stomates can play a clear role in facilitating uptake of nutrients. For example, in a series of experiments with bean leaves where stomates were manipulated to be open or closed, uptake of nitrogen from urea, ammonium or nitrate was two times higher when the stomates were open. It should be noted that uptake via stomates does not just flow through the open stomatal pore; it is still a diffusion process along the edges of the stomatal guard cells that is more apparent when the pore is open. Additionally, recent studies using some new-age microscopic imaging methods showed that the base of trichomes was a key area for the uptake of foliar zinc in sunflower leaves, and other specific cell types directly above major veins was the primary uptake site of foliar phosphorus in barley leaves.
It is worth noting that much of what we know regarding cuticular transport of plant nutrients was derived from studies using isolated plant cuticles (enzymatically isolated from leaves.) Such a model system has its drawbacks, and artifacts can occur. For example, some studies comparing isolated cuticles to intact leaves did not yield consistent results for transport. This is why real-world studies with natural plant canopies under production conditions are needed to provide practical data on efficacy of foliar fertilizers. Numerous other factors not discussed here can also influence the success of foliar fertilization, which makes generalized recommendations difficult.
Foliar Nutrient Trials in Oregon Vineyards
My lab has conducted a number of foliar nutrient trials, and I will briefly share some of our findings. We have conducted three different trials using foliar urea-N for the specific purpose of boosting fruit or must YAN levels. Two experiments were conducted in Pinot noir and one in Chardonnay. These trials have shown that foliar urea is an effective tool to boost YAN (Table 2), and it has the advantage over soil-applied N in that canopy growth is not increased (a clear benefit for improving YAN in high-vigor sites.)
Table 2. Summary of foliar urea trials conducted in western Oregon vineyards.
We also conducted a P trial years ago at two Pinot noir vineyards in the Willamette Valley. P was applied in three foliar sprays at a moderate dose, and leaf blade and petiole P status was improved at only one of the two sites. The increase in leaf blade P concentration at one site at veraison was only about 12%, and I concluded there was little benefit to spraying vines with foliar P (data not shown).
Currently, as part of the High-Resolution Vineyard Nutrition Management (highresvineyardnutrition.com/project), we are testing a foliar potassium treatment along with two rates of soil-applied K to correct a low K Pinot noir vineyard, and we are assessing two rates of foliar magnesium to correct a low Mg Pinot noir vineyard.
In the K trial, we are comparing a foliar K product (K-Metalosate, Albion Labs, Layton, Utah) at the highest label rate using three sprays per year (total = 3.3 pounds K/acre) with fairly high doses of soil K (K2SO4) at either 188 or 369 pounds K/acre applied in spring. Results from year 1 of this trial showed no increase in leaf or petiole K status at bloom or veraison, nor any impacts of K on growth or yield as well as must sugars, pH or TA. However, K levels in dormant-season canes (pruning wood samples) were slightly improved by all three K treatments compared to the no-K control. In year 2, leaf and petiole K status at bloom was increased in the soil K treatments, more so by the high rate, but not in the foliar K vines. Veraison leaf and petiole nutrients and pruning wood nutrients have yet to be analyzed for year 2, but similar to last year, no effects on growth or yield as well as must sugars, pH or TA were apparent due to K treatments (data not shown).
In the Mg trial, we are testing foliar sprays using MgSO4 (Epsom salt) because an earlier trial my lab conducted in the Willamette Valley with soil-applied MgSO4 at a high rate was unsuccessful. We are comparing foliar sprays of MgSO4 at 10 or 20 pounds/acre using three sprays (supplying a total of 3 or 6 pounds Mg/acre). The high rate of Mg increased leaf blade Mg levels at veraison in year 1 but did not alter petiole Mg levels as we found before. Both the low and high rates of foliar Mg reduced the number of leaves with Mg deficiency symptoms by more than 75% around harvest time in both years (Figure 1). However, Mg applications did not affect growth or yield as well as must sugars, pH or TA thus far.
In conclusion, foliar feeding of plant nutrients has its place in vineyard management, and certain foliar nutrients are effective in improving nutritional health of grapevines. This is especially true for micronutrients, notably B and zinc. Of the macronutrients, both Mg and urea-N have been effective in alleviating Mg deficiency or in boosting must YAN levels. Foliar applications of P and K have proven less effective so far. Caution is warranted when considering the myriad of foliar products that are being marketed to you as grape growers, and this is because we still have much to learn about how and when foliar-applied nutrients will be effective. A key question you should ask yourself when considering foliar nutrition is whether you have a deficiency or other problem that needs to be fixed. This is where money spent on tissue sampling for nutrients and tracking vine nutrient status over years will pay for itself in the long run. Prophylactic use of foliar fertilizers, except perhaps for B, is generally not a good idea.
Figure 1. Schematic of nitrogen cycling including ammonia volatilization in the soil/plant/atmosphere environment.
There is no doubt that almond producers have had to navigate numerous challenges over the past several years. Drought conditions, declining nut prices and regional frost events have forced growers to implement a renewed focus on input management as it relates to agronomic efficiency. Agronomic efficiency can be improved through the implementation of the 4R’s of Nutrient Stewardship, which include Right Source, Right Rate, Right Time and Right Place. Improved grower understanding of various nutrient cycles and soil nutrient loss mechanisms are allowing growers to incorporate a sophisticated layer of nutrient management that has evolved over recent years. By understanding and leveraging both the nitrogen cycle and the 4R’s, almond producers can make informed fertility decisions that maximize nitrogen use efficiency (NUE), allowing them to successfully navigate both economic and environmental headwinds.
Factors Impacting the Nitrogen Cycle
Nitrogen management is important, not only due to product cost but also because of the many loss mechanisms associated with less-than-ideal soil conditions. Almonds require a large amount of annual nitrogen to produce a commercial yield. CDFA suggests that on average, 68 lbs N are removed per 1,000 pounds of kernels with another 30+ lbs needed to maintain adequate growth (depending on tree age.) Almonds rely on large amounts of N to build both amino acids and proteins as well as for the formation of chlorophyll. To adequately supply the appropriate amount of N in an efficient manner, growers will need to understand how environmental factors impact the nitrogen cycle (Figure 1) and ensure that applications are available during periods of peak uptake and demand.
Figure 2. Nitrogen allocation in various tissues. Almond trees are quite good at remobilizing N resources from perennial plant parts to annual tissues during the bloom period through fruit set.
Almond trees are quite good at remobilizing N resources from perennial plant parts to annual tissues during the bloom period through fruit set. Figure 2 depicts this remobilization concept with total N remaining constant through March 12, accumulating in annual tissues while decreasing in perennial tissues. The graphic suggests that there is little uptake from applied N during this period but does not necessarily mean growers should avoid applications at this timing. Depending on soil and other environmental conditions, application timing can vary greatly during this period.
Table 1. Seasonal nitrogen allocations can be a valuable guide to timing applications but lack some of the nuance needed to understand the right rate as well as the right source to consider.
Proper application timing not only requires understanding crop uptake demand, but also how soil conditions impact nutrient form. Because common N fertilizers used by almond producers contain different combinations of urea, ammonium and/or nitrate, different considerations related to application timing are needed. The majority of almond N uptake is in the nitrate form. This requires N applied in either the ammonium or urea form to largely be converted to nitrate, making it more available for uptake. The conversion reactions such as nitrification (conversion of ammonium to nitrate) are governed by soil moisture and soil temperature. Growers should also consider rain forecasts when making early N applications because spring rain events can possibly leach nitrate out of the rootzone, resulting in not only an environmental impact but an economic impact as well.
Figure 3. Relationship between nitrification rates and soil temperature. The speed at which ammonium is converted to nitrate can be dramatically different depending on soil temperature.
Figure 3 illustrates the relationship between nitrification rates and soil temperature. The speed at which ammonium is converted to nitrate can be dramatically different depending on soil temperature. Figure 4 is a graph generated from Wilbur Ellis’ Probe Schedule depicting soil temperatures of a mid-textured loam soil at different depths from mid-February through mid-March. Shallow soil temperatures during this period were approaching and at times exceeding 60 degrees F. When we use this information with the nitrification table, we see that it can take up to three weeks for 50% of our applied ammonium to be converted to nitrate. Heavier, cooler soils experience much slower nitrification than coarser textured soils, meaning growers should take their soil conditions, weather forecasts and N source into consideration when timing applications.
Reconciling Data into Nitrogen Application Decisions
A general rule of thumb for managing N throughout the almond growing season involves allocating large portions of the N budget to applications during four major timings. Table 1 outlines seasonal nitrogen allocations, which can be a valuable guide to timing applications but lack some of the nuance needed to understand the right rate as well as the right source to consider.
Figure 4. Soil temperatures of a mid-textured loam soil at different depths from mid-February through mid-March. Shallow soil temperatures during this period were approaching and at times exceeding 60 degrees F.
Many growers and consultants sample almond leaves throughout various time periods of the season to understand the status of various nutrients including N. It is not uncommon for leaf tissue samples to be evaluated for N status monthly starting in April through mid-July. July leaf tissue samples can be an excellent tool for growers to adjust or implement postharvest fertility applications to address any nutrient shortages prior to the remobilization of these nutrient resources to storage organs. If leaf N levels during the mid-July period are inadequate, then almond trees may not be able store enough N for next year’s bloom period. This means growers and consultants alike should consider 2022’s July tissue levels as an important data point when developing the spring fertility plan for 2023.
Another important consideration when developing the spring fertility plan is the overall yield of the previous year’s crop. When I discuss postharvest fertility with growers, I describe it as the final opportunity of the season to reconcile fertility inputs with crop exports. For most of the season, growers making most fertility decisions are guided via certain assumptions about crop load. Growers can make a pretty good assessment of crop load by late spring and into early summer, adjust their fertility accordingly and then monitor via leaf tissue analysis and/or field observations throughout the remainder of the season. Once crop starts to get harvested and loads are delivered to the processor, a clearer picture of final yield develops. If the postharvest fertility program was shorted/omitted or if yield was dramatically reduced via frost or some other phenomenon, spring fertility may need to be adjusted accordingly. Growers in the Sacramento Valley that experienced extreme crop loss from freezing temperatures in 2022 will likely need to work with their advisors and adjust spring fertility to feed what is likely to be a large crop in 2023.
Almond growers have the difficult task of reconciling an enormous amount of data to make fertility decisions for their operation. These data points include lag measures such as previous year’s July nutrition levels and/or yield to lead measures like current year’s estimated N usage based on yield goals. Growers are likely to experience economic pressure through elevated input costs and weak nut prices as well as regulatory pressure from state and environmental agencies. N management will continue to be a focus throughout California, and growers who can effectively leverage their understanding of the nitrogen cycle as well as the 4R’s will be better positioned for the coming 2023 season.
Table 1. Beneficial effects of phosphite (Phi) as a biostimulator in vegetable crops.
Phosphite has been a controversial topic for years. Its use and benefits are argued in hundreds of research papers across the world’s scientific communities. Is it a fertilizer, a biostimulant or a fungicide? These questions are discussed in multiple university research results. I believe that if we look carefully, we can conclude phosphite serves all three functions. As with everything we do with chemicals and nutrition, we need to be aware of possible negative effects. We also need to determine how we are using the phosphite materials and the results we are seeking.
Phosphite (PO33-; Phi), a reduced form of phosphate (PO43-; Pi), is widely marketed as either a fungicide or fertilizer or sometimes as a biostimulant. Because CCAs, growers and distributors see the product marketed in all three ways, this can cause confusion. Each designated use will most likely be tied to the phenology (growth stage) of each treated crop. Timing is critical to determine which effect we are seeking. In this article, we broach the controversial topic of Phi as a biostimulant.
In Research
Many researchers believe that Phi does not attribute to the growth and health of the plant. They believe that the positive response to Phi is attributable to the disease suppression by Phi. Lovatt and Mikkelsen (2006) emphasized Phi, if used at appropriate rates, can provide stimulation to plants that may not occur with Pi. They suggested Phi is more than just a fungicide; for example, it increases floral intensity, yield, fruit size and total soluble solids. In addition, combinations of Phi and Pi ions are believed to be more effective than either Pi or Phi alone in plant assimilation (Foster et al. 1998; Young 2004).
With all my studies and visits with research teams, I believe Pi is becoming accepted by agriculture as a biostimulator. Even without a consensus on its physiological function across agriculture and horticulture, too many positive effects are evident. As long as there is sufficient Pi present, Phi continues to have a positive effect on plant metabolism. Today, Phi is emerging as a potential inductor of beneficial metabolic responses in plants as it has demonstrated its effectiveness against different stress factors and has improved crop yield and quality. Important progress has been made in the field of Phi uptake, transport and subcellular localization, and there is still a more in-depth understanding of the fundamental processes behind the effects of Phi on plant metabolism needed.
Moor et al. (2009) found the application of Phi does not affect strawberry growth or yield compared to traditional Pi fertilization, although it does increase fruit quality by activating the synthesis of ascorbic acid and anthocyanins. Similarly, Estrada-Ortiz et al. (2013) found beneficial effects of Phi on strawberry fruit quality and induction of plant defense mechanisms (Estrada-Ortiz et al., 2011, Estrada-Ortiz et al., 2012), which has also been reported by Rickard (2000) in several crop species and cultivars. Likewise, Glinicki et al. (2010) reported beneficial effects of Phi on the growth parameters of three strawberry cultivars.
Table 2. Beneficial effects of phosphite (Phi) as a biostimulator in fruit crops.
As a Certified Crop Consultant and Certified Professional Agronomist, based on research studies and trials, I believe that phosphites are biostimulants. Couple that with the ability of phosphite to enter and translocate within a plant and you have a formidable tool. The following statement and sited research results confirms this:
“Phosphite has been found to display systemic effects and high chemical stability in plant tissues, though it also shows great mobility throughout the whole plant. This mobility facilitates the penetration and transport of the foliar-applied Phi to the rest of the plant, including the roots.” – Smillie et al. 1989, Brunings et al. 2015
By definition, “A plant biostimulant is any substance or microorganism applied to plants with the aim to enhance nutrition efficiency, abiotic stress tolerance and/or crop quality traits, regardless of its nutrient content.” By extension, plant biostimulants also designate commercial products containing mixtures of such substances and/or microorganisms. Research projects and results are too numerous to quote them all.
Aqua-ammonia being applied to a rice field. General findings from research show that aqua or urea applied to a dry soil before flooding resulted in the highest yields at harvest (all photos courtesy B. Linquist.)
Most rice in California is established and grown in what is referred to as a water-seeded system. In this system, after the field is tilled and leveled, most (70% to 100%) of the nitrogen (N) is applied as aqua-ammonia (aqua) injected 3 to 4 inches below the soil surface. After this, the field is flooded and then aerial seeded by airplane. The field stays flooded, resulting in anaerobic (low oxygen) soil conditions. The deep placement of fertilizer and the anaerobic soil conditions protect the fertilizer N from gaseous losses due to ammonia volatilization or nitrification/denitrification. Very little of this preplant N fertilizer is taken up by the crop during the first month, so it needs to be well protected by the flood layer. Using this practice, fertilizer N is used very efficiently. In addition to this preplant aqua-N, some starter N (containing P, K and other nutrients) are applied early in the season, and a top-dress N may be applied mid-season.
What if Aqua is Not Available?
While this strategy has proven to be efficient and effective, there are situations where it may not be possible to apply aqua. For example, in recent years, supply chain issues have limited the availability of aqua. Also, heavy rain following seedbed preparation (but before fertilizer application) makes it difficult and inefficient to apply aqua. It is not advisable to apply aqua into a moist soil. Not only is it difficult for the equipment on wet clayey soils, but the aqua will start to nitrify (convert from NH4 to NO3) in moist soils, resulting in nitrate accumulation which will denitrify (NO3 lost as N2 gas to atmosphere) when the field is flooded.
So, what is a grower to do if aqua is not available? We evaluated six products applied at different times (19 treatments) at two locations in 2020 and 2021. The products included aqua, urea, ammonium sulfate and three enhanced efficiency N (EENF) fertilizers (Super U, Agrotain or Agrocote). We applied the products at a single dose at various times including preflood, one day, one week and two weeks after flooding. We also had a split application where the N rate was split and applied at four different times during the season.
Some general findings were that aqua or urea applied to a dry soil before flooding resulted in the highest yields at harvest. This confirms other earlier findings we have made. Ideally, if urea is used, it should be worked into the soil with a harrow before flooding, although if urea is applied to a cloddy soil, the urea granules tend to fall deeper into the soil via gaps between clods. It is important that urea is applied to dry soil so that the N fertilizer does not start to nitrify before field is flooded and to avoid ammonium volatilization.
Our second major finding was if a preflood application to a dry soil is not possible, the next best scenario is to split the N rate. The total N rate split at 15%, 35%, 35% and 15% at three, four, five and six weeks, respectively, after planting will likely give the best results. The idea behind split applications is that the fertilizer is being applied when the crop needs it most. This results in rapid fertilizer N uptake and lowers the chances for significant N losses. However, the fertilizer N is being broadcast into the flood water, and this may result in some volatilization and denitrification losses. At one of our sites, the data suggested if one were to split the N, the total N rate may need to be increased compared to aqua or urea applied before flooding.
Third, using the EENFs, such as Super U, Agrotain or Agrocote, had no benefit over applying urea alone. They did not improve yields, and in some cases, yields were reduced. These are expensive fertilizers, and we found no additional benefit to their use.
Finally, using ammonium sulfate did not affect yields compared to using urea. In our studies, we applied sulfate fertilizer to make sure S was not limiting. In soils deficient in S, applications of ammonium sulfate may be of benefit.
Testing the Green Seeker in the field. This instrument measures the Normalized Difference Vegetation Index of the canopy and can help decide whether a top-dress N application is needed if N deficiency is observed or expected.
Decide if Top-Dress N is Necessary
We recommend applying the full rate of N at the beginning of the season in the aqua and starter fertilizer application. Regardless of the basal strategy, including those just discussed, top-dress N applications are needed if the plant is N deficient or you suspect it will become so. At PI (45 to 55 days after planting), the crop should be accessed to determine if a top-dress of N fertilizer is necessary. A good assessment is important because not applying N when needed can lead to a reduction in yield; however, applying N fertilizer when it is not needed can lead to lodging, delayed maturity, increased incidence of disease and reduced yields. The GreenSeeker (or similar instrument), which measures the NDVI (Normalized Difference Vegetation Index) of the canopy, is a tool we have tested for this purpose. The best way to do this is to develop a Sufficiency Index (SI). The sufficiency index is calculated using the NDVI reading from the field test area divided by the NDVI from an enriched N strip (representing a crop with unlimited N.) The N-enriched strip is an area where extra N was added to the field (could be done by overlapping an area with an aqua rig or a small area where you intentionally added extra N.) The SI will be a number between 0 and 1. The lower the SI, the more N-deficient. For example, if the N-enriched strip gave an NDVI value of 75 and the field test area gave an NDVI value of 69, the SI would be 0.92 (69/75 = 0.92). Our research has indicated it is cost-effective to apply a top-dress of N fertilizer when the SI is below 0.95, although this depends on the price of rice and cost of applying fertilizer. This could also be done using a drone which would cover a larger area. If using a drone, we recommend using a camera that can measure NDRE (Normalized Difference Red Edge). We have found NDRE to be more precise than NDVI when quantifying the nitrogen status of a crop.
More on this can be found on our website at https://rice.ucanr.edu/.
Figure 1. An ailing tree at the Stanislaus site in 2018 showed signs of deterioration. Although the trunk was somewhat sunken at the soil line and necrosis was forming under the bark (center photo), samples were collected multiple times, but no Phytophthora spp. were isolated/found. This tree happened to be included in the delayed irrigation treatment and during the passing of three years appears to be recovering, specifically showing greater shade under the tree canopy at midday since the beginning of the trial in 2018 (photos by K. Arnold.)
Walnuts are generally regarded as very sensitive to water stress. Severe stress and defoliation can occur when irrigation is reduced in the summer or discontinued entirely for harvest. Since walnuts depend on stored soil moisture during this time, growers were historically advised to start irrigation early in the spring to save deep soil moisture ‘in the bank’ for use later in the season. However, research findings in a Red Bluff, Calif. walnut orchard have seriously challenged this conventional wisdom. In fact, trees that were given an early start of irrigation (late April) showed more water stress at harvest than trees that were given a delayed start of irrigation (late May/early June). Surprisingly, this occurred even though the delayed start trees received substantially less water (about 28 inches throughout the growing season) than the early start trees (about 38 inches). The Red Bluff orchard is on a deep silt-loam/fine sandy-loam soil. However, similar results are being found in one Stanislaus County orchard on heavier clay soil and one orchard in western Tehama County on stratified soils with gravelly subsoils and much lower water holding capacity.
Using the Right Tool
In many commercial orchards, in-season tree water stress is monitored by measuring midday stem water potential (SWP) using a pressure chamber (a.k.a. “pressure bomb,” see sacvalleyorchards.com/manuals). This same tool could be used, specifically, to decide when to start irrigation in the spring with the appropriate information on this subject. As a starting point, there is a reference level of SWP that is expected for a fully irrigated (non-stressed) walnut tree, which is called the “baseline” SWP. For more information about baseline SWP and how to obtain this value for a particular location, day and time, we suggest the following websites:
Baseline and advanced interpretation explained: sacvalleyorchards.com/manuals/stem-water-potential/using-baseline-swp-for-precise-interpretation/
Baseline values calculated for you at: informatics.plantsciences.ucdavis.edu/brooke_jacobs/index.php
Using the Tool to Trigger the Start of Irrigation
We began testing in 2014 in a nine-year-old commercial Chandler/Paradox orchard planted at 18 x 28 feet (86 trees per acre) on a deep, well-drained silt-loam/fine sandy-loam soil near Red Bluff. The test continued through 2019. The design of the experiment was simple: we compared control trees given 100% irrigation (see below) starting about 30 days after leaf-out to trees that were not irrigated until a trigger level of SWP was reached. We tested five trigger levels for the start of irrigation: a grower control (typically starting irrigation while the trees were still near baseline SWP), or 1, 2, 3 or 4 bars drier than baseline SWP.
We divided the field into 4 rows x 11 tree plots and had five individual plots for each trigger level. In total, the test consisted of 12.5 acres. Starting after leaf-out (about the third week of April), we measured the SWP of two middle trees in each plot every three or four days. When the average of those trees reached the trigger on two consecutive dates, we opened the sprinkler control valves to the tree rows in that plot. From then on, the plot was irrigated whenever the control plots and the rest of the orchard were irrigated.
Figure 2. Summary of average orchard water requirement (ET-rain) and applied irrigation for all delayed irrigation tests to date (2014-20). Daily CIMIS values for orchard water requirements were calculated beginning on April 1 based on current walnut crop coefficients, for each site and year, and averaged. Irrigation applied to all delayed treatments for each site and year were averaged for 10-day periods over the same seasons.
Initial Results in 2014
We expected that a 1- or 2-bar trigger might cause mild water stress with minimal effect on the trees, but the 3- or 4-bar triggers would show some detrimental effects. However, we were not sure how long of a delay would result from waiting to start irrigation using any of these trigger levels. We were also unsure if trees with late triggers would always be ‘behind’ in their water needs and experience severe water stress at harvest because we could not apply a ‘catch-up’ irrigation to any of the delayed trees.
In 2014, the 1-bar trigger occurred about the same time as the grower control, but much to our surprise, waiting for the 2-bar trigger gave one to two months of delay (depending on the plot), with the 3- and 4-bar triggers giving slightly longer delays (Table 1). Longer delays also resulted in less irrigation. In 2014, the control trees received 100% of calculated evapotranspiration (ET, see anrcatalog.ucanr.edu/ pdf/8533.pdf), whereas the 1- through 4-bar trees ranged from 89% to 66% of this value, respectively (Table 1).
Table 1. Irrigation start dates, seasonal irrigation applied (in inches and as the equivalent percent of irrigation requirement, calculated from ET minus in-season rainfall) and crop yield for each of the irrigation treatments imposed in the first year of the study (2014).
There were some negative effects on crop yield, with the 4-bar trigger reducing yield by about 10% (Table 1, see page 16), but there were also some positive signs. For instance, at harvest in October, the 2-, 3- and 4-bar triggers had a healthier canopy appearance than the controls. This matched our SWP measurements, which indicated that the delayed trees were less stressed than the controls (Table 2). This was the most surprising result from the first year of the study; during the delay period (May, June), the longer delays were associated with more stressed (more negative) SWP values as expected, with the controls being closest to the baseline. However, by harvest, the opposite was the case, with the controls being furthest from the baseline (Table 2).
Table 2. Average SWP measured in May and June 2014 when irrigation was being delayed in most of the treatments, and average SWP in October around harvest (October 17, 2014). Also shown are the baseline SWP values for the same time periods.
Trial results for 2015-18
Due to the overall improved appearance of trees in the delayed plots at harvest compared to the controls, the grower’s standard (control) irrigation start time in the entire orchard, including our control plots, was gradually delayed each year after 2014. Water applications in the orchard and the control plots became substantially less than 100% of the seasonal irrigation need (Table 3, see page 16). Yields also generally improved across treatments compared to 2014, even though canopy size as measured by midsummer ground shaded area has remained stable at 86%. Even with the changes over time that occurred in the control trees, delays associated with a 1- to 4-bar trigger showed small but consistent improvements in percent edible yield and relative value as well as substantial savings in water (Table 3). There were also indications of small but consistent increases in nut load. However, since nut load is determined by many factors, ongoing research in additional orchards is being conducted to determine if this effect is consistent.
Table 3. Average irrigation start date (and equivalent days after leaf-out), seasonal irrigation applied in inches (and equivalent percent of the seasonal irrigation requirement, as in Table 1), yield, percent edible yield, relative value and crop relative value (and equivalent percent of the control treatment.) Relative value is an index combining the two main economic drivers of walnut value (percent edible yield and kernel color), and crop relative value is Yield x Relative value.
Soil Moisture Storage and Possible Implication for Root Health
The soil in this location is a deep, well-drained silt-loam/fine sandy-loam, and soil moisture measurements have indicated that the trees in this orchard have access to at least 10 feet of stored soil moisture. In most years, rainfall is also sufficient to refill this soil profile. Hence, using the pressure chamber to determine when to start irrigating has enabled the grower to take maximum advantage of this soil moisture resource, potentially improving soil aeration and overall root health. This may be one of the reasons the delayed trees appeared healthier and less stressed around harvest compared to the controls. Answering this question with greater confidence will require more research focused on the root system.
Taking the Practice Beyond Red Bluff
It is also important to test the delayed irrigation approach on different soil types. Because this project was conducted in a relatively high rainfall area in the Sacramento Valley, extending these dramatic results to other areas within the state with differing rainfall and soils should be done with caution. We currently have two different trials underway to further test the merits of delaying the start of irrigation in walnut (a second site in Stanislaus County on heavier clay soil and a third trial in western Tehama County on stratified soils, with gravelly subsoils and much lower water holding capacity.) Both trials are a smaller-scale version of the Red Bluff trial.
In the Stanislaus County orchard consisting of Chandler on Vlach, results after three years suggest that similar benefits of delaying the first irrigation may be possible in this higher-clay-content soil site. Some ailing trees have shown partial recovery in the delay treatment, indicating the possibility of too much water being applied too early (Figure 1,see page 14). Yield at the Stanislaus site was not affected when irrigation was withheld until readings of 2 bars drier than baseline.
After two years, results from the western Tehama County test on soils with lower water holding capacity and soil layers that may restrict root depth suggest there may still be some benefit of delaying irrigation in terms of less tree stress at harvest, reduced water costs, and improved edible kernel. However, because of the lower water holding capacity of the soils, the delay may only be about one to two weeks with water savings of about 4 inches.
A key feature of using SWP to manage irrigation is that it provides growers with an orchard-specific measurement of tree water stress and hence allows them to safely take advantage of the existing soil moisture resource, regardless of soil depth, type and quantity of the stored soil moisture. Using SWP to delay the start of irrigation resulted in healthier-looking, less-water-stressed trees at harvest, challenging the conventional wisdom that an early start to irrigation is beneficial because it allows the saving of deep soil moisture ‘in the bank’ for use later in the season. Quite possibly, keeping this savings account too full in the spring may cause more problems than it solves.
The benefits of waiting to irrigate in spring until trees read 2 to 3 bars drier than the baseline despite the stark differences between these three sites is a powerful testament to the value of using the pressure chamber. Once growers use the pressure chamber to trigger the start of irrigation, they can continue to trigger irrigations throughout the season by waiting for SWP readings of 2 to 3 bars drier than the fully watered baseline.
Baseline and other information for interpreting SWP readings can be found at sacvalleyorchards.com/manuals/stem-water-potential/pressure-chamber-advanced-interpretation-in-walnut/.
These trials are also challenging the conventional wisdom that we must irrigate to keep up with ET to have healthy and high-yielding walnut orchards (Figure 2, see page 14). Stay tuned as these two new trials continue to add to our collection of experiences.


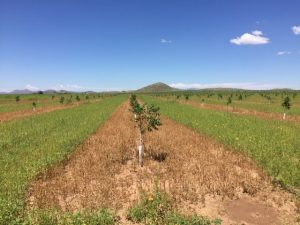

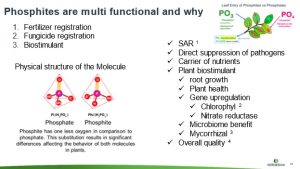

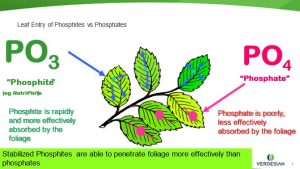
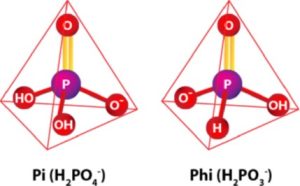

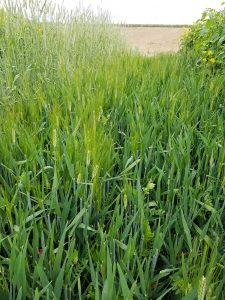

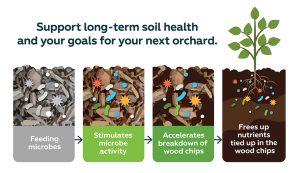

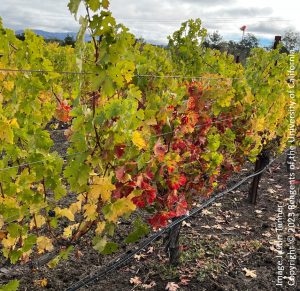
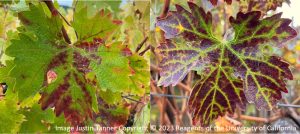
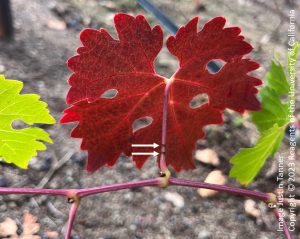
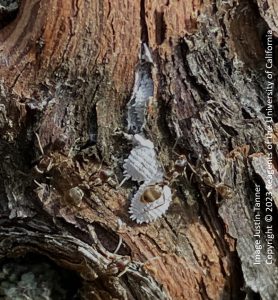
 Untreated Control Vines Sep 30 2023")
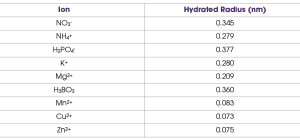
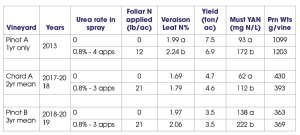

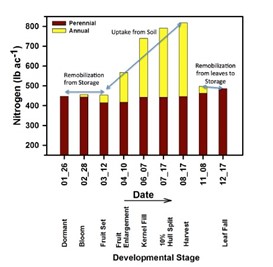
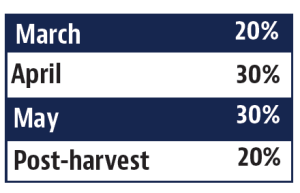
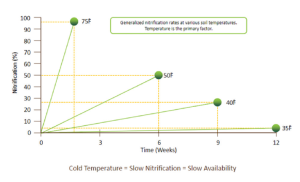
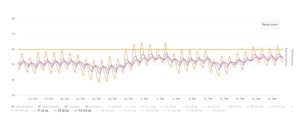
")
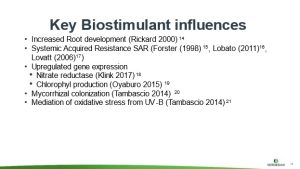
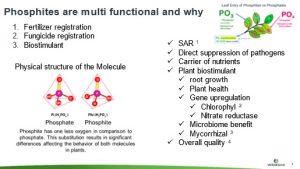
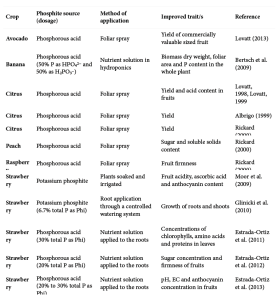

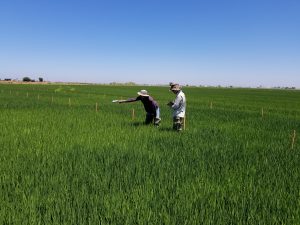

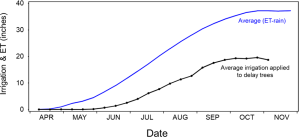
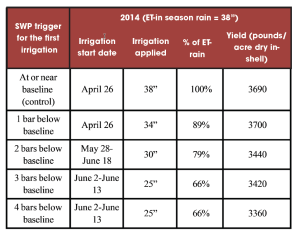
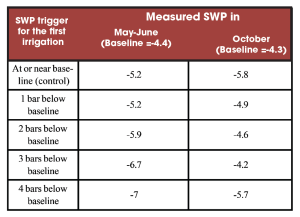
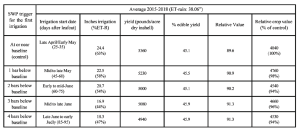


 Invading California")

