


Strawberries are the third most valued crop in California ($2.3 billion) and one of the most sensitive to salinity. Limited information on the tolerance of new varieties to salt and chloride toxicity has led to significant yield losses in recent years. Even a modest yield loss of 5 percent due to soil and water salinity may cost the strawberry industry and California $260 million per year. Despite the importance, commonly used salinity tolerance thresholds for strawberry (Ayers and Westcot, 1985) are based on studies almost a half-century old and may not be applicable to the soils, water quality, climate, and modern cultivars grown in California. California production, which accounts for approximately 85 percent of the strawberries produced in the US, are mostly grown on coastal soils with electrical conductivity (ECe, saturated paste extract method) ranging from 2 to 4 dS/m. Some of these soils have moderate to high concentrations of calcium, bicarbonate and sulfate. Although most of these salts may be precipitated in the form of calcium sulfate (gypsum) and calcium carbonate (lime) and have limited impact on plant growth, the ECe can be considerably increased when a soil sample is saturated with distilled water (used in the saturated paste extract method) due to the dissolution of these salts. That is a common scenario found in arid regions such as in the Southwestern US (e.g. Ventura County), where limited rainfall contributes to the accumulation of certain salts in the topsoil. In the Watsonville area, however, there is much less carbonate and sulfate in the groundwater and therefore in agricultural fields, where sodium and chloride are of major concern. Excessive sodium most often leads to high sodium adsorption ration (SAR), which causes infiltration problems on some soil types. In irrigated agriculture, the irrigation water quality and leaching fraction are usually the main factors driving soil salinity. When appropriate leaching amounts are applied, the salinity of the soil and of the irrigation water reach a steady-state (equilibrium). However, when irrigation amounts do not exceed crop evapotranspiration (ETc), soil salinity can increase considerably due to the accumulation of salts in the rootzone. Infiltration rate and rainfall also affect soil salinity. In an attempt to account for the precipitation effect of certain salts, Rhoades et al. (1992) suggest that plants can tolerate ECe about 2 dS/m higher than published thresholds when grown on gypsiferous soils (soils that contain significant quantities of gypsum, or calcium sulfate). Although this publication provides basic management guidance, strawberry growers and farm managers need more detailed information to determine leaching fractions and to select irrigation water sources and cultivars. Identifying the specific types of anions and cations that make up the salts in soil and irrigation water is important for predicting how different strawberry cultivars will tolerate salinity. For example, a field with soil ECe of 2.5 dS/m, where chloride is approximately 10 meq/L can have significantly greater impacts on strawberry yields than a soil with the same soil ECe where chloride is 2 meq/L and calcium and sulfates are the predominate salts.
Material and Methods
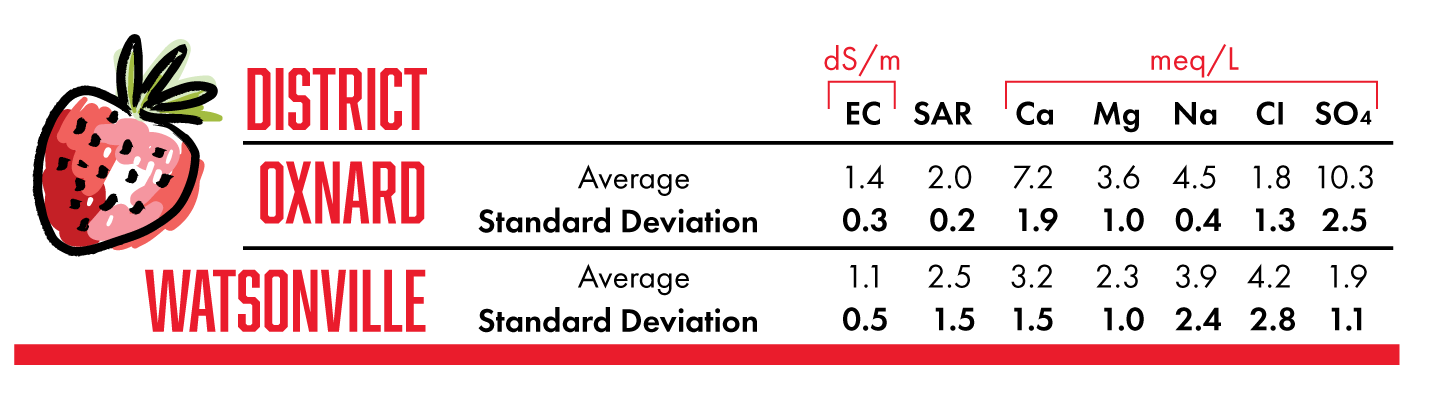
In order to assess how susceptible strawberry cultivars are to irrigation water of different quality, a two-year study was conducted in California between 2016 and 2018. The first year of the study consisted of a survey conducted in 40 strawberry fields located in the Oxnard and Watsonville districts, where irrigation water and soil samples were analyzed for salinity composition. Overall, the irrigation water of the fields located in the Oxnard district had greater electrical conductivity and significantly greater sulfate levels, while chloride levels in the Watsonville fields were twice as great as the Oxnard fields (Table 1). These results were used as the benchmark for determining the treatments of the salinity tolerance experiment conducted the following year.
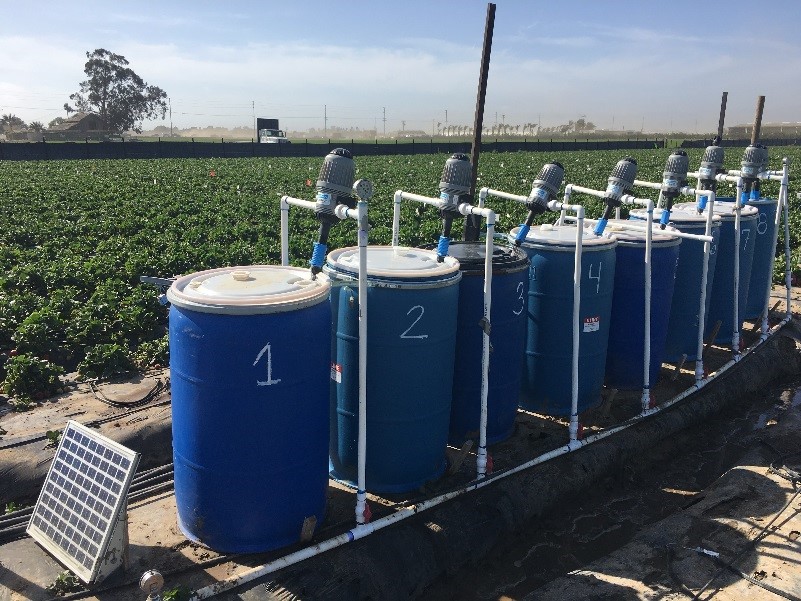
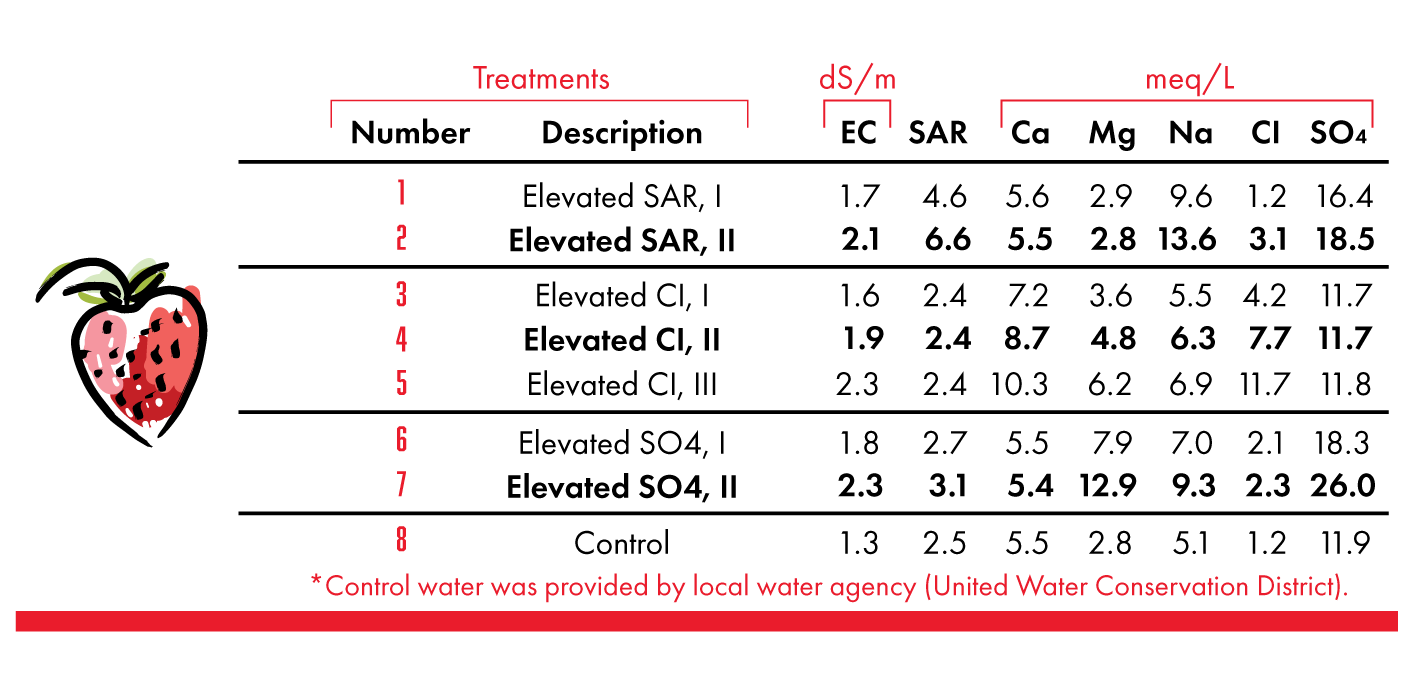
The second year of the study consisted of an experiment conducted in a commercial field located in Oxnard, California during the 2017/2018 production season. Strawberry yield, soil salinity and salts content in leaf blades of the two most popular public cultivars in Oxnard (cv. Fronteras) and in Watsonville (cv. Monterey) were assessed under eight salinity treatments following a randomized complete block design. Each plot was 30 feet long and 1 bed wide (64 inches), with four plant rows, approximately 90 plants/plot, and two high flow drip tapes (0.67 gpm/100ft) placed about 1.5 inch deep between the 1st and 2nd, and between 3rd and 4th plant rows. The experiment was planted on October 2017, and the treatments started approximately a month post-planting in order to promote a good establishment of the crop; during that period, overhead micro-sprinklers was the predominant irrigation method. Drip irrigation amounts and timing were decided based on ETc estimations from the California Irrigation Management Information System (CMIS station # 152) weather station, and matric potential readings from tensiometers, respectively. Water-powered injection pumps (Figure 1) blended the well water with concentrated salt solutions formulated for each treatment at a 1:100 ratio during every drip irrigation event from November 2017 to June 2018 (total of 60 drip irrigations). The treatments consisted of irrigation water with two levels of elevated sodium adsorption ratio (SAR, 4.6 and 6.6), three levels of elevated chloride (4.2, 7.7 and 11.7 meq/L), and two levels of elevated sulfate (18.3 and 26 meq/L of SO4). Table 2 displays a complete description of the salts’ composition of each treatment. Composite soil and leaf blade samples were collected from each plot at early, mid and late production stages and analyzed for pH, ECe, Ca, Mg, Na, Cl, B, HCO3, CO3 and SO4 (soil samples), and N, P, K, S, B, Ca, Mg, Zn, Mn, Fe, Cu, Na and Cl (leaf blade samples). Marketable and unmarketable yield, and berry weight were measured in average twice a week from December 2017 through June 2018, totaling 54 harvesting events. There was a total of 5.8 inches of rainfall throughout the entire growing season, of which 4.8 inches happened in March, between the first and second sampling events.
Results and Discussion
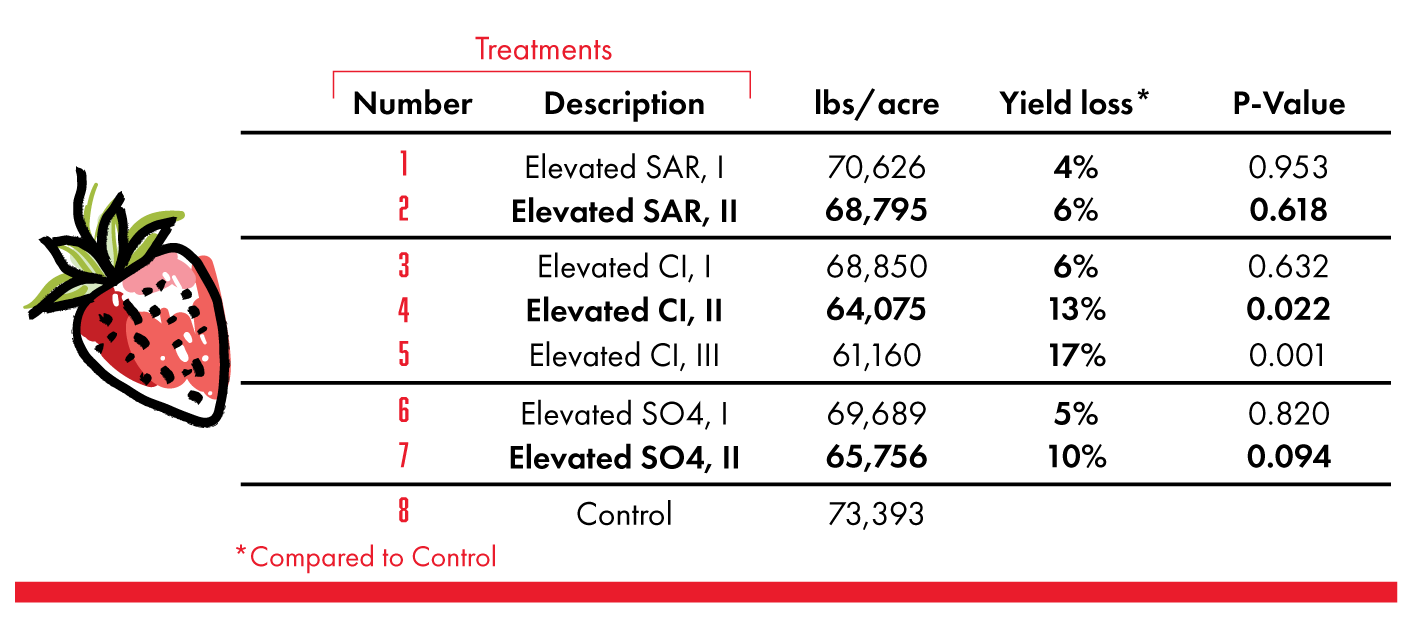
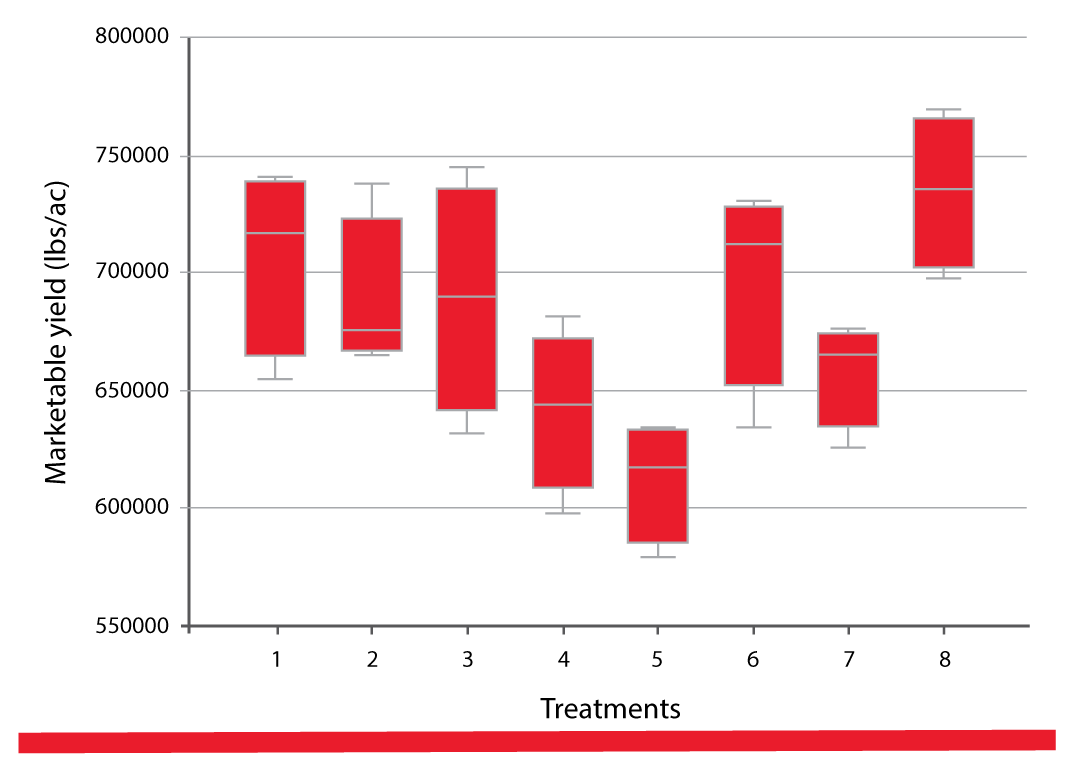
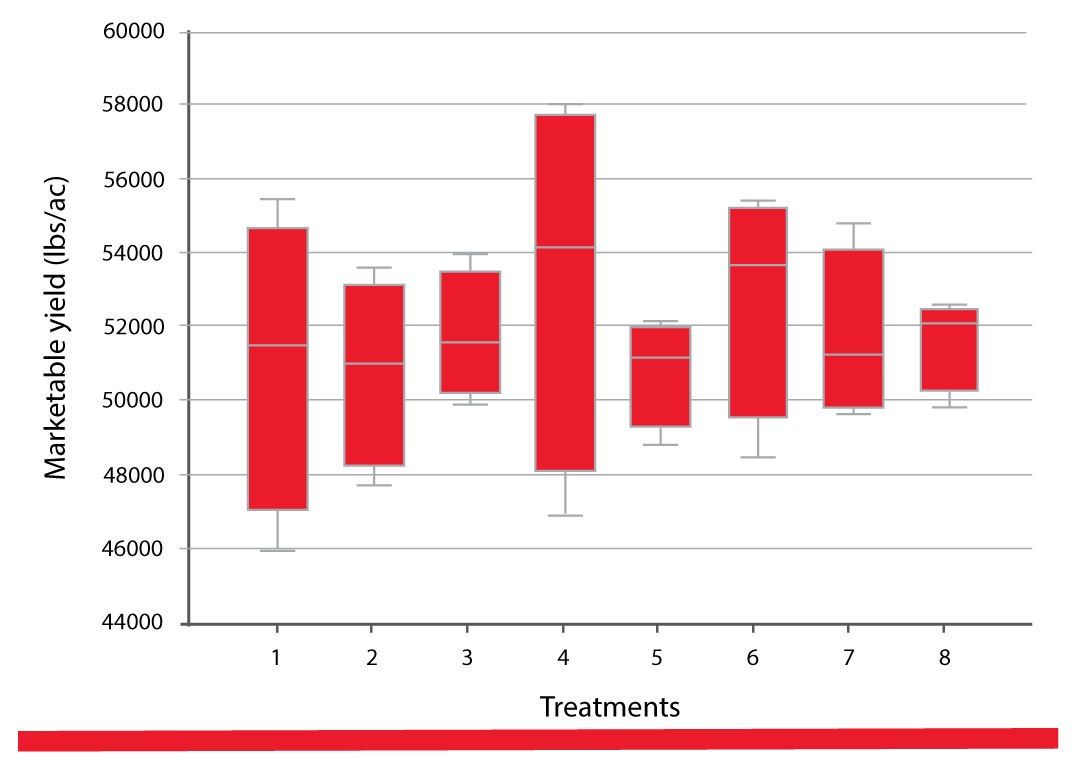
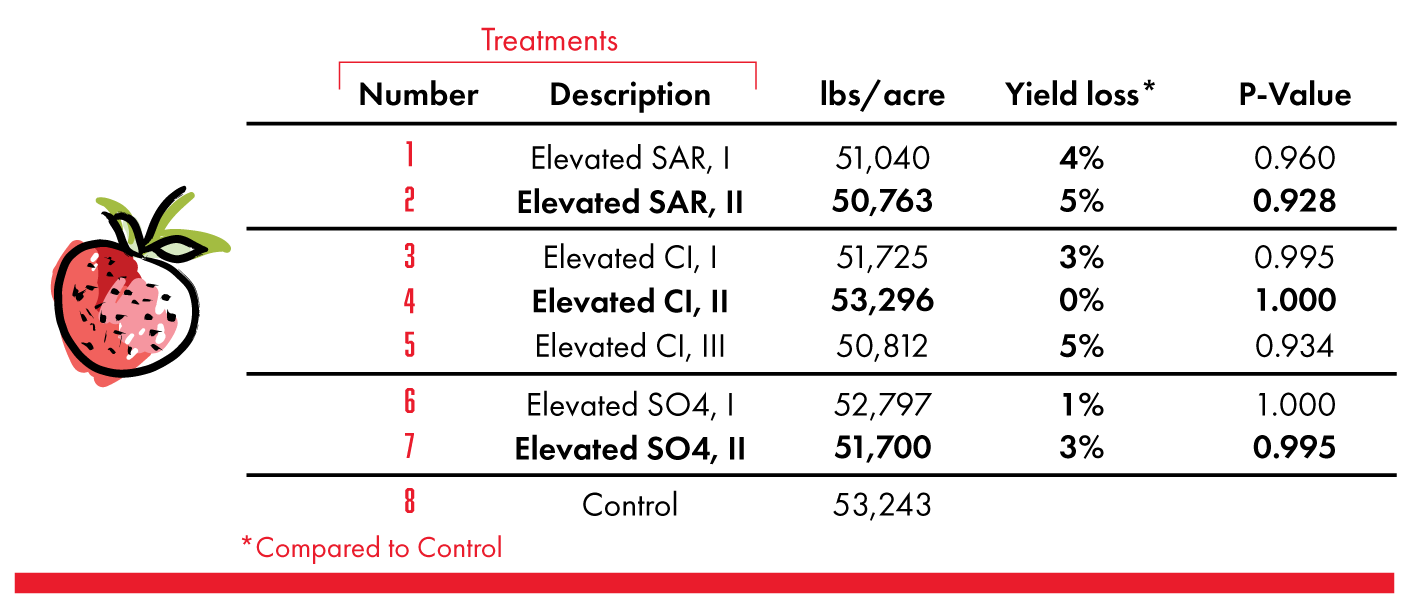
Total marketable yield of Fronteras was significantly (P<0.05) reduced by 13 and 17 percent with increasing chloride levels of 7.7 and 11.7 meq/L, respectively (Table 3). Although yields of all other treatments were lower than the control treatment (Figure 2), those differences were not statistically significant (P>0.05). The high sulfate treatment reduced Fronteras cv. marketable yield by 10 percent, although the differences were not statistically significant (P=0.094). Yield losses due to the elevated salts started before plant symptoms were noticeable in Fronteras. Total marketable yield of the Monterey cultivar was not significantly affected by any salinity treatment (Figure 3 and Table 4). Cull rates of both cultivars were not affected by the salinity treatments. Fronteras berry weight was significantly reduced by 6.3 percent with the highest chloride treatment (11.7 meq/L). Salt concentrations in soil and leaf blade samples consistently increased with the higher salinity treatments for both cultivars (data not shown).
The rainfall events that occurred between the first and second samplings contributed to significant leaching of salts from the root zone (0-12 inch depth), which made overall ECe values from the second sampling date very similar to the values measured during the first date. Hence, yield losses observed in this experiment may have been greater, and occurred sooner if the rainfall during that period had been less. Additionally, plant symptoms of the salinity treatments, which were not observed until mid-May, may have been observable sooner with less intense precipitation. Overall, the most surprising finding of this study is the marked differences in yield response to the salinity treatments between the two cultivars. While Fronteras proved to be highly susceptible to increased irrigation water salinity, especially in regards with chloride, Monterey cv. presented limited and statistically not significant yield declines. Accordingly, other major public and proprietary strawberry cultivars may also exhibit a range of susceptibility to salinity. It is also reasonable to expect greater yield losses of the cultivar Fronteras grown on fields that have been farmed with irrigation water quality equivalent to the treatments of this study for years. In that case, plant establishment can be compromised by the increased water and soil salinity, especially if the irrigation wasn’t managed with the appropriate leaching requirement to the water quality. The fact that the Monterey cultivar did not respond to the salinity treatments included in this study may be related to significantly greater chloride levels found in the irrigation water of the Watsonville area, where the cultivar was selected and tested before being released to commercial production.In summary, the findings of this study conclude that the strawberry cultivar Fronteras is highly susceptible to elevated chloride levels, and that salinity effects on strawberry yield is cultivar dependent. Although this study provides conclusive information of salinity effects on Fronteras and some information about Monterey cultivar, the quest to understanding the impact of salts on the main strawberry cultivars is very challenging and most likely far from being achieved.
References
Ayers, R.S. and D.W. Westcot, 1985. FAO Irrigation and Drainage Paper 29: Water quality for agriculture. In Crop tolerance to salinity.http://www.fao.org/3/T0234E/T0234E03.htm#ch2.4.3
Rhoades, J.D., A. Kandiah and A.M. Mashali. 1992. FAO Irrigation and Drainage Paper 48: The use of saline waters for crop production:http://www.fao.org/3/t0667e/t0667e00.htm


 Invading California")

