
Disease
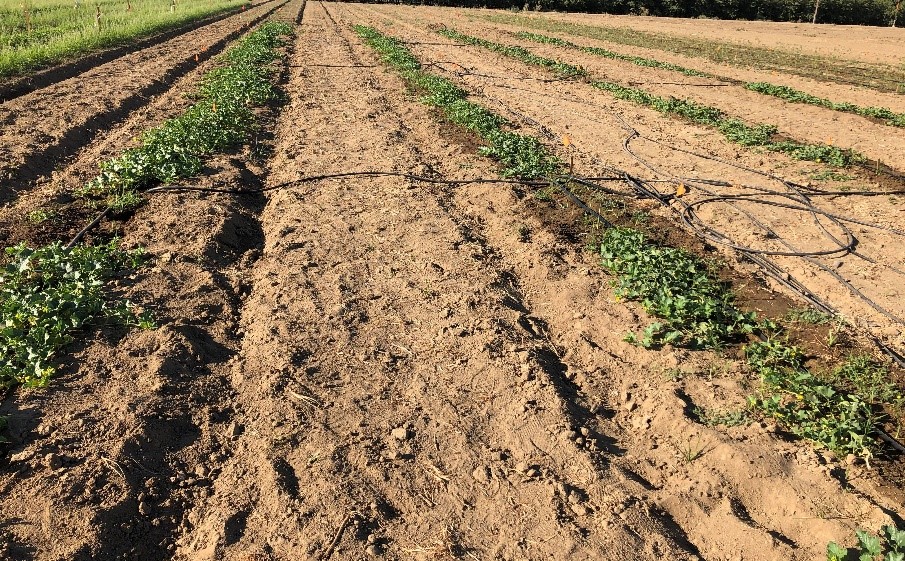
Alternative Nematicides for Root-Knot Nematodes in Melons
California is one the largest producers of melons in the U.S., and melons most commonly grown in California…
Read ArticleArticle Archive
California is one the largest producers of melons in the U.S., and melons most commonly grown in California…
Read Article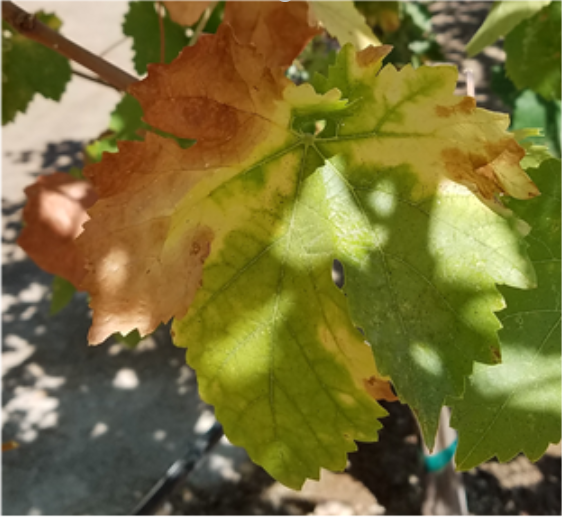
Pierce’s disease is caused by the bacterium Xylella fastidiosa. These bacteria live within xylem, the vascular tissue through…
Read Article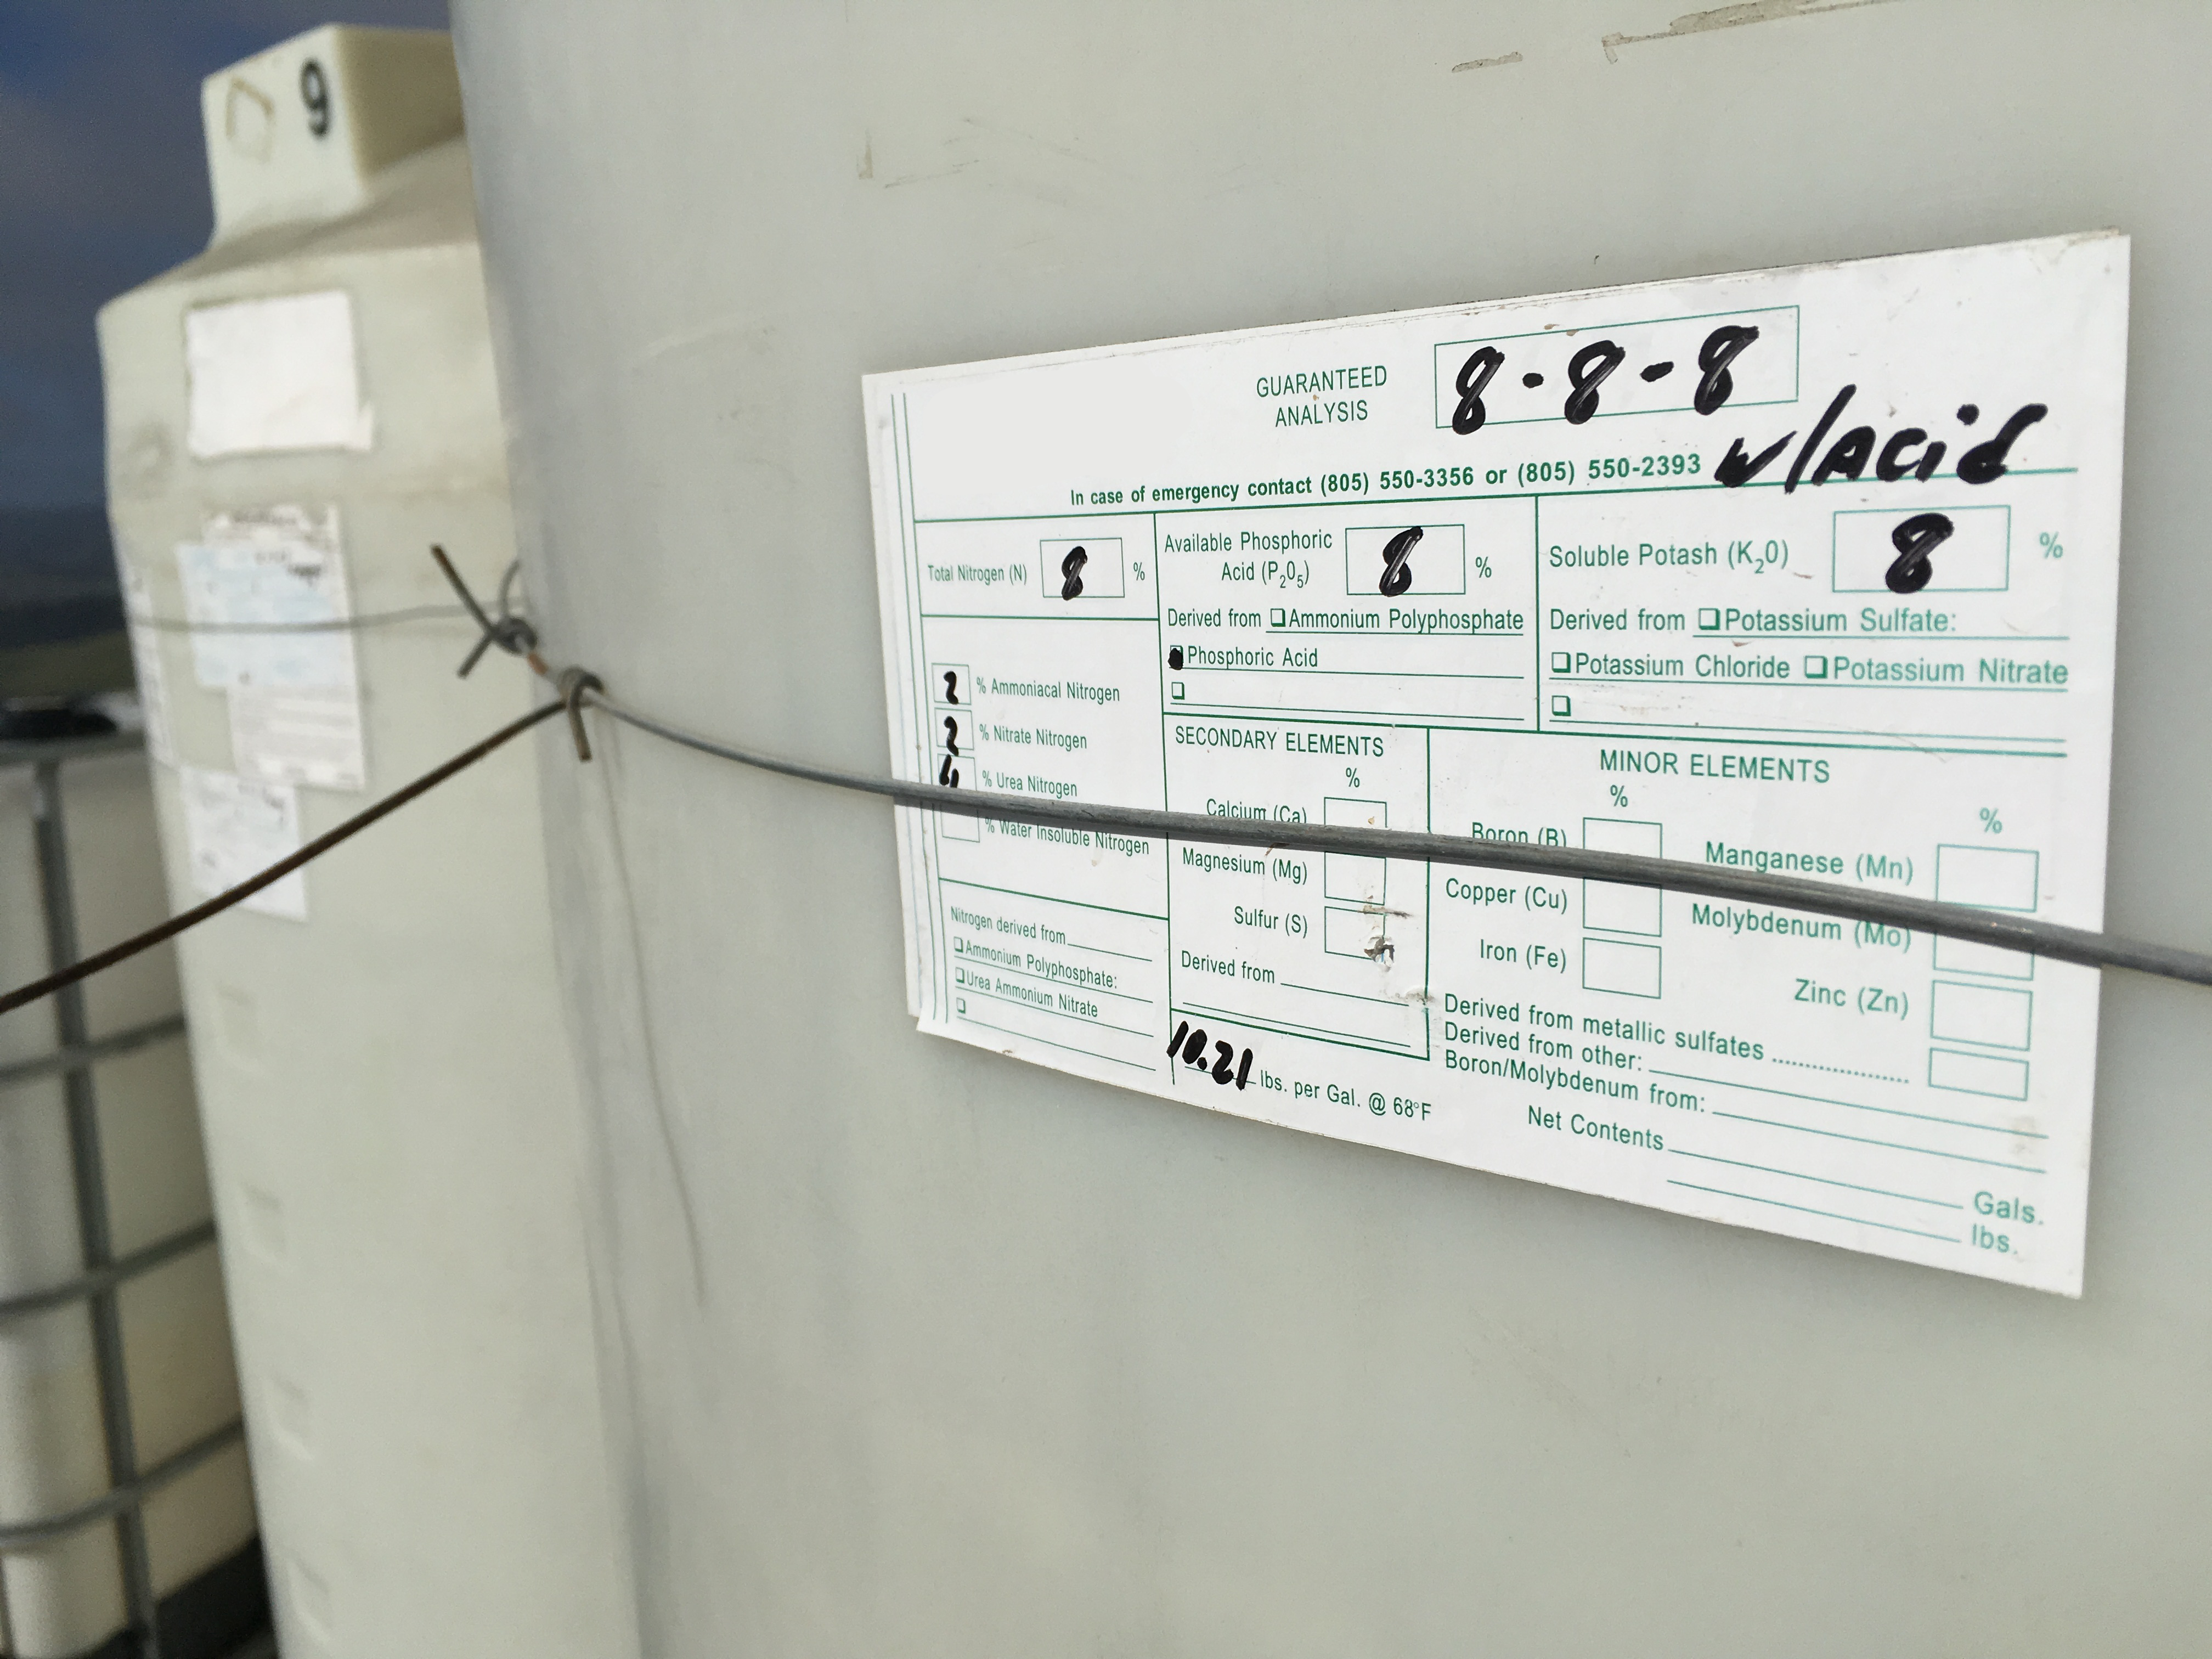
The goal of fertilization for any crop is to ensure the optimum levels of nutrients are available to…
Read Article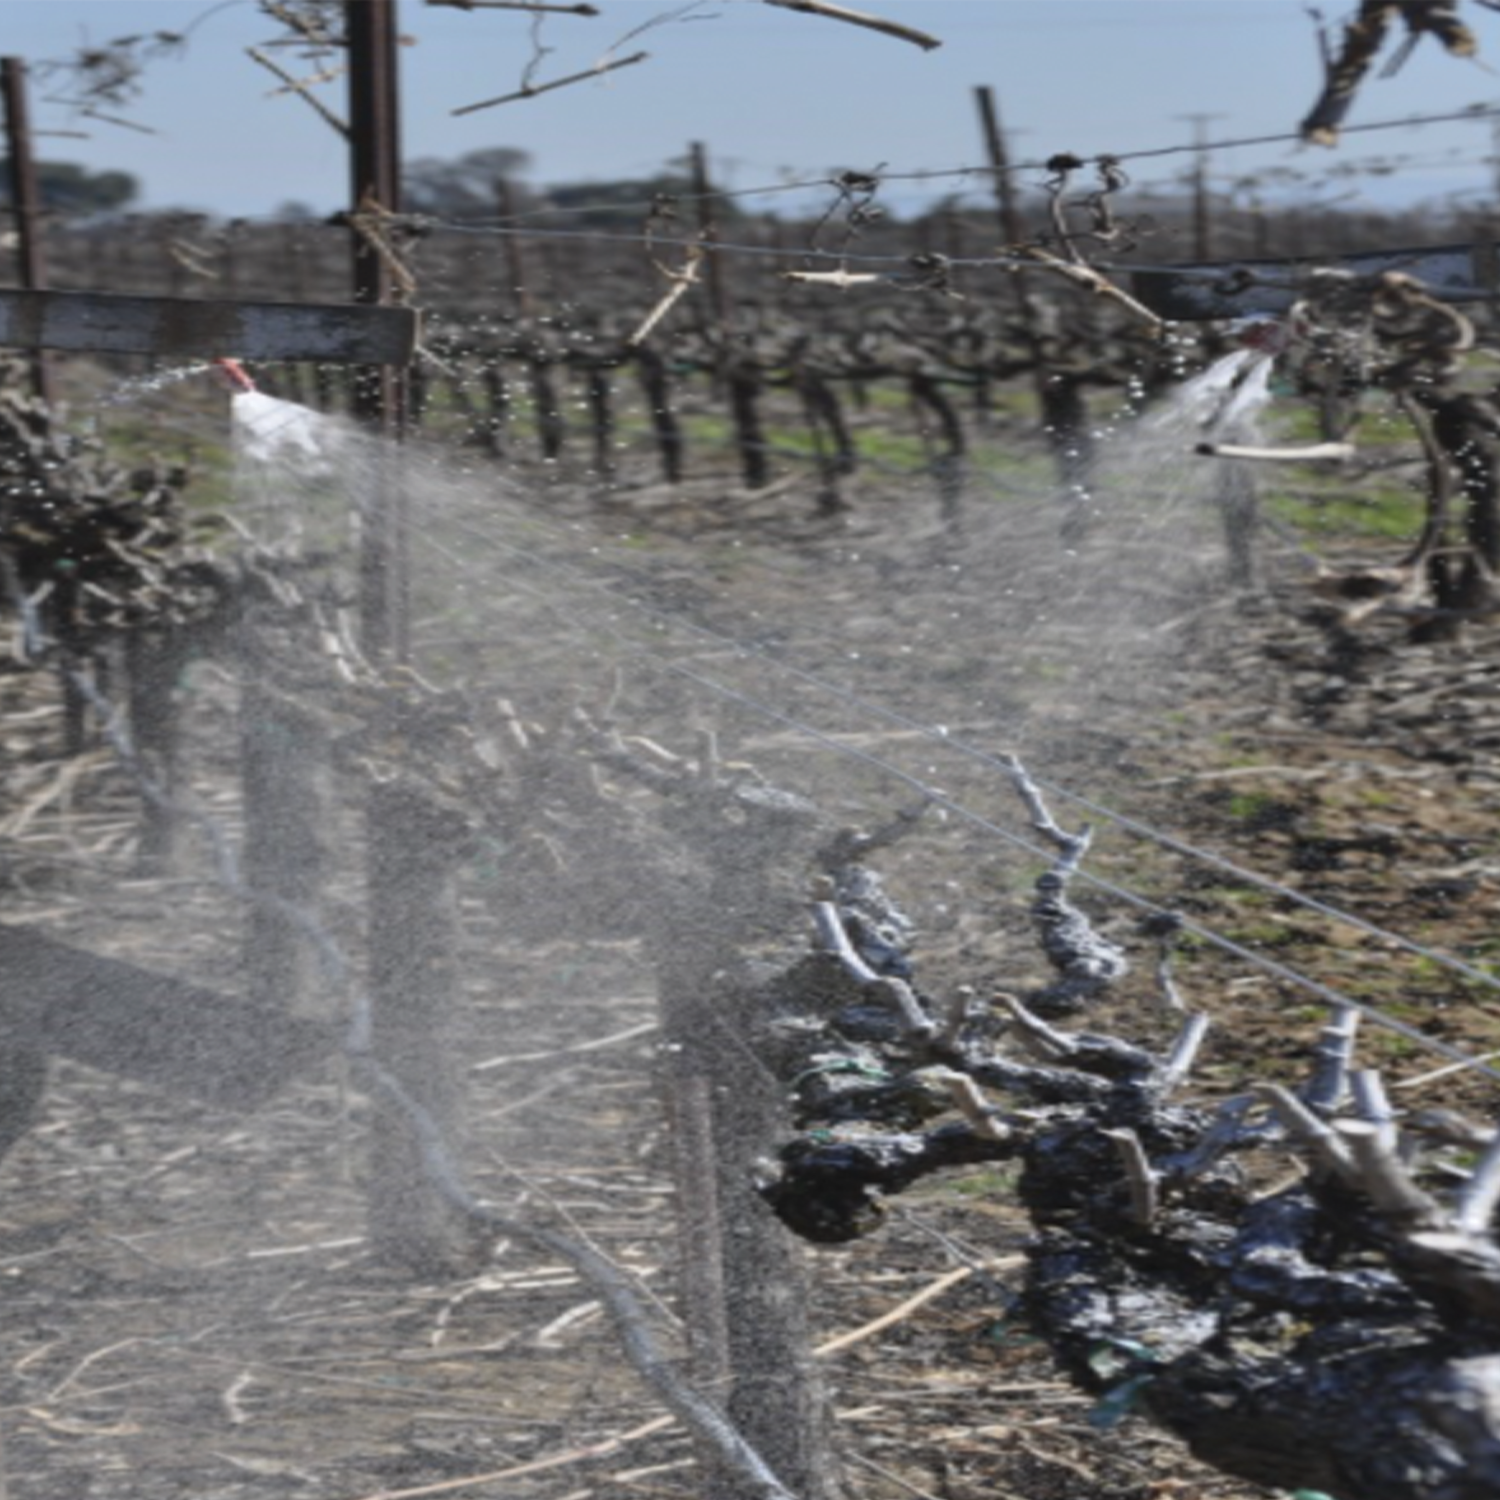
Pruning and disease management are important vineyard practices that need attention in the dormant season. Pruning directly affects…
Read Article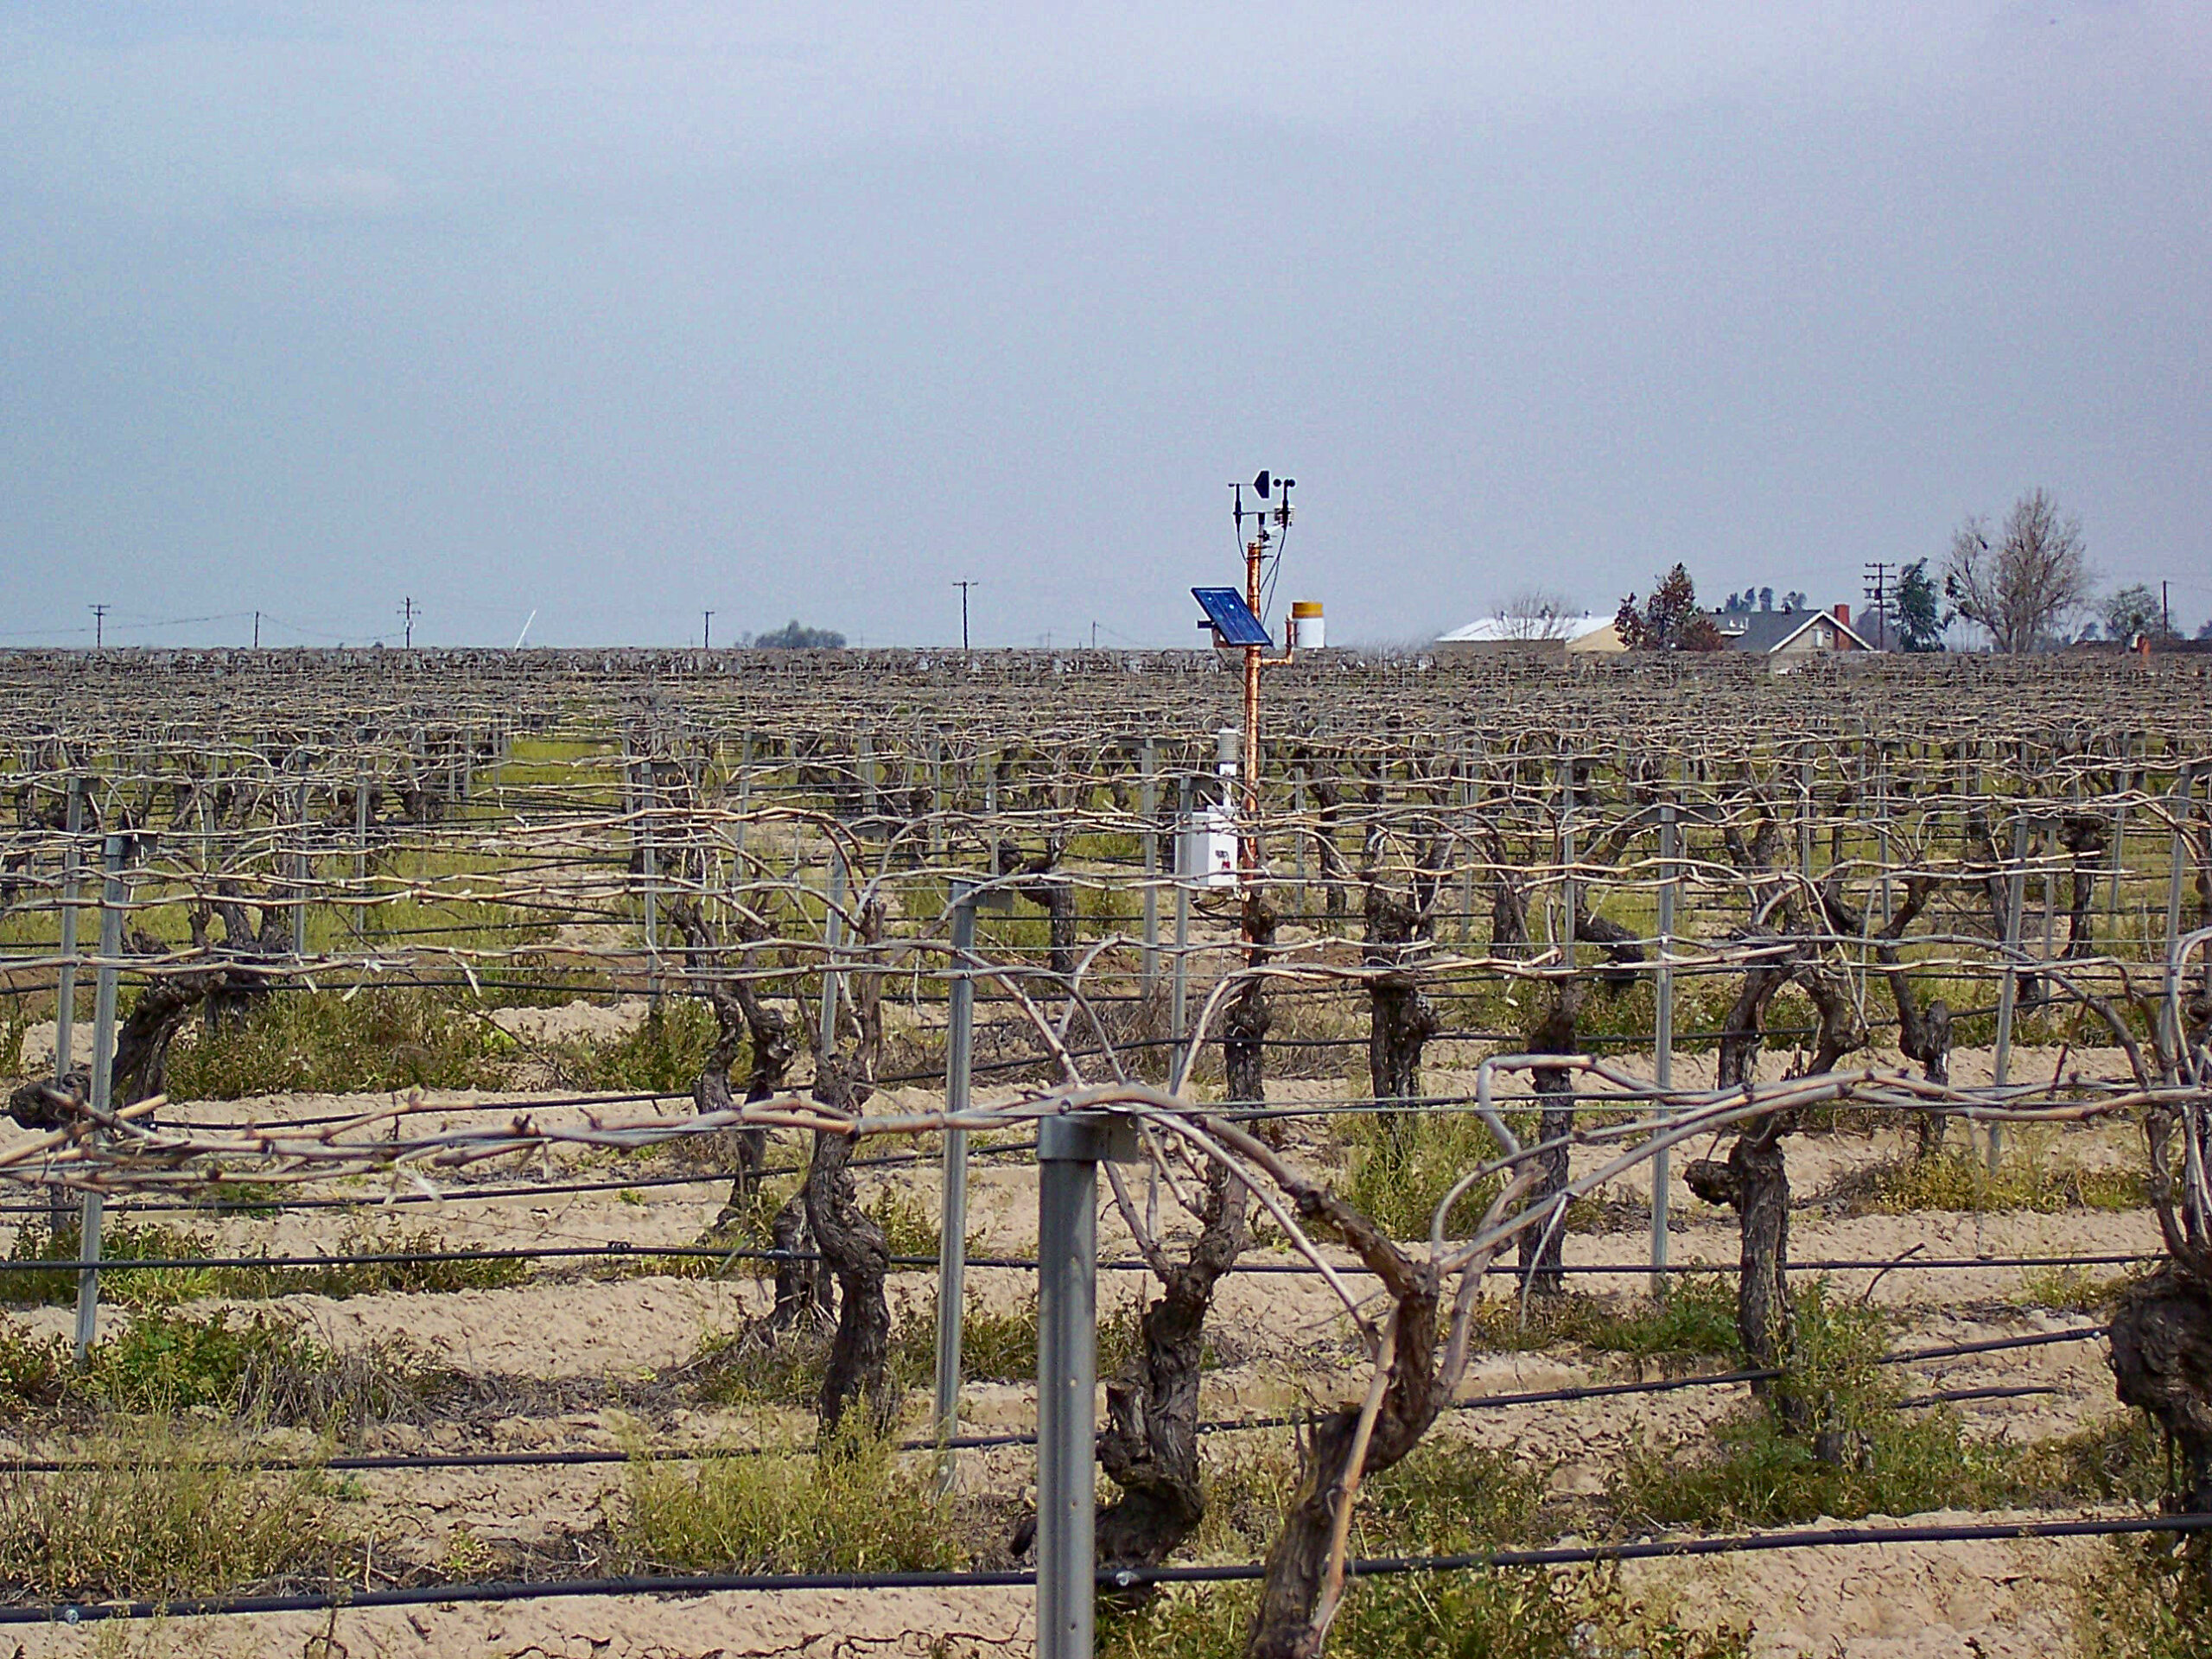
Talk to a farmer; at some point, the discussion will focus on the weather. It is the number-one…
Read Article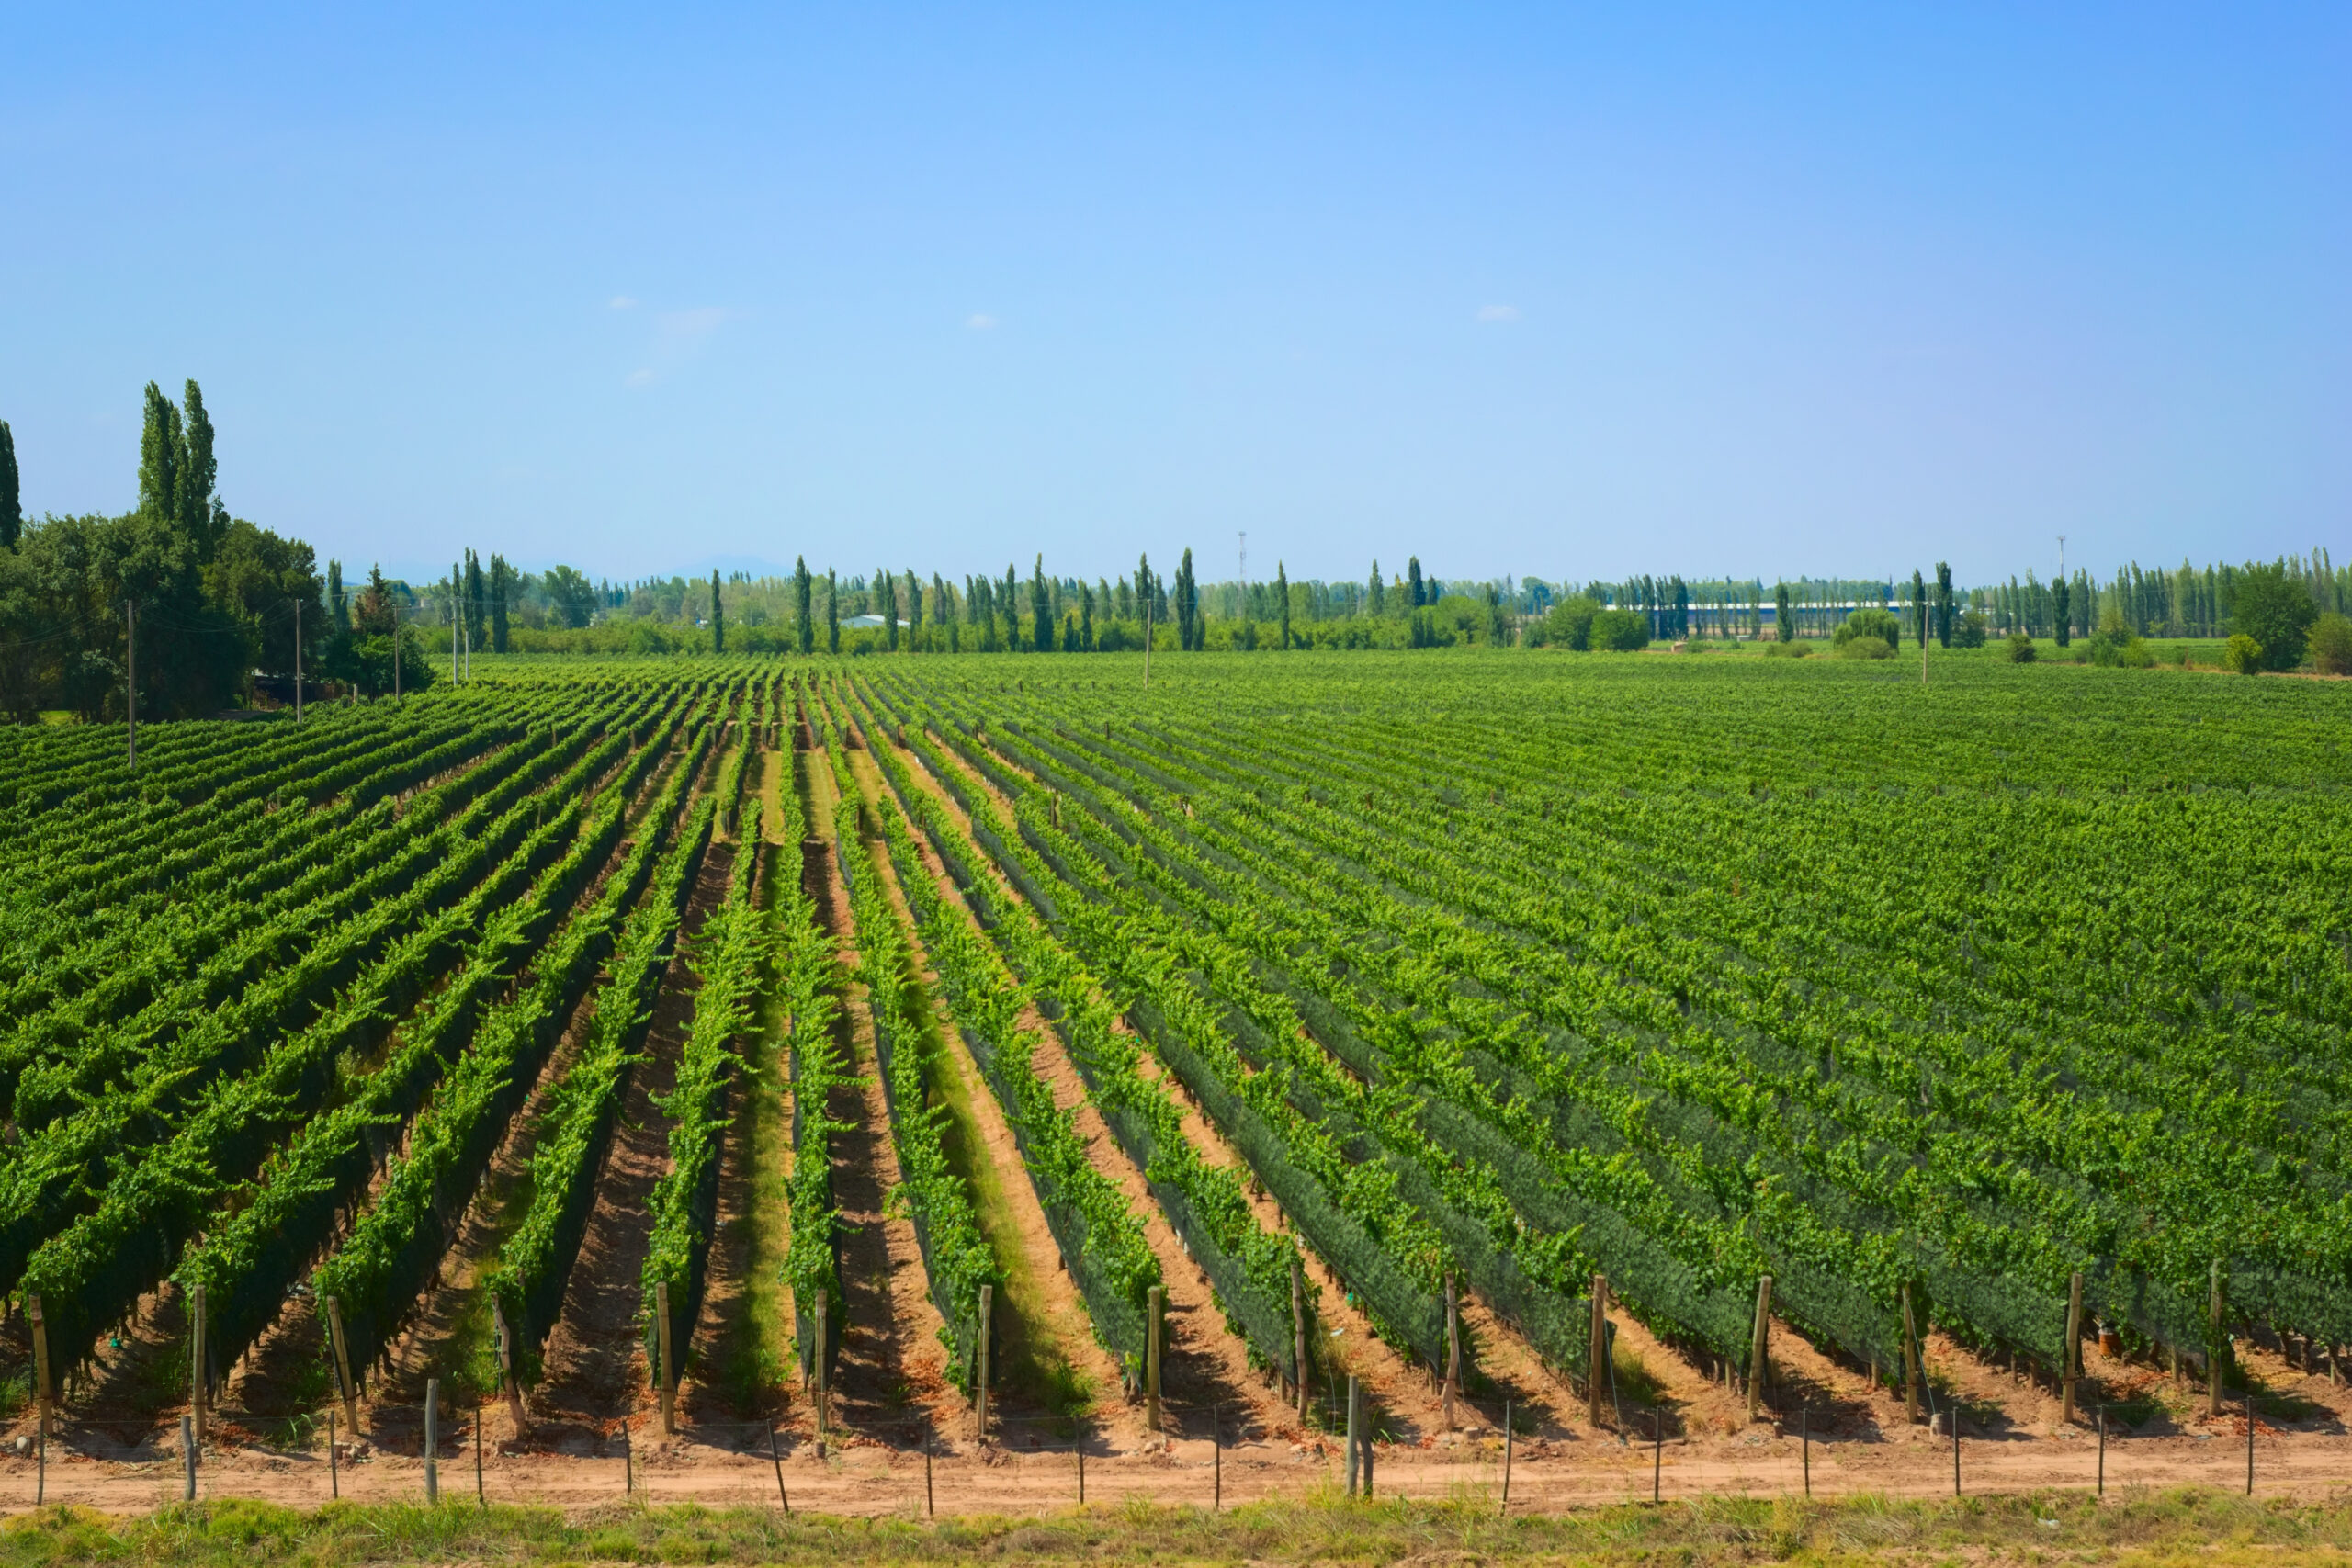
Biostimulant products have become widely used in agricultural production, but there are still unresolved issues around definitions, labels…
Read Article
Grapevines can die for a number of reasons, but increasing incidences of Sudden Vine Collapse across all California…
Read Article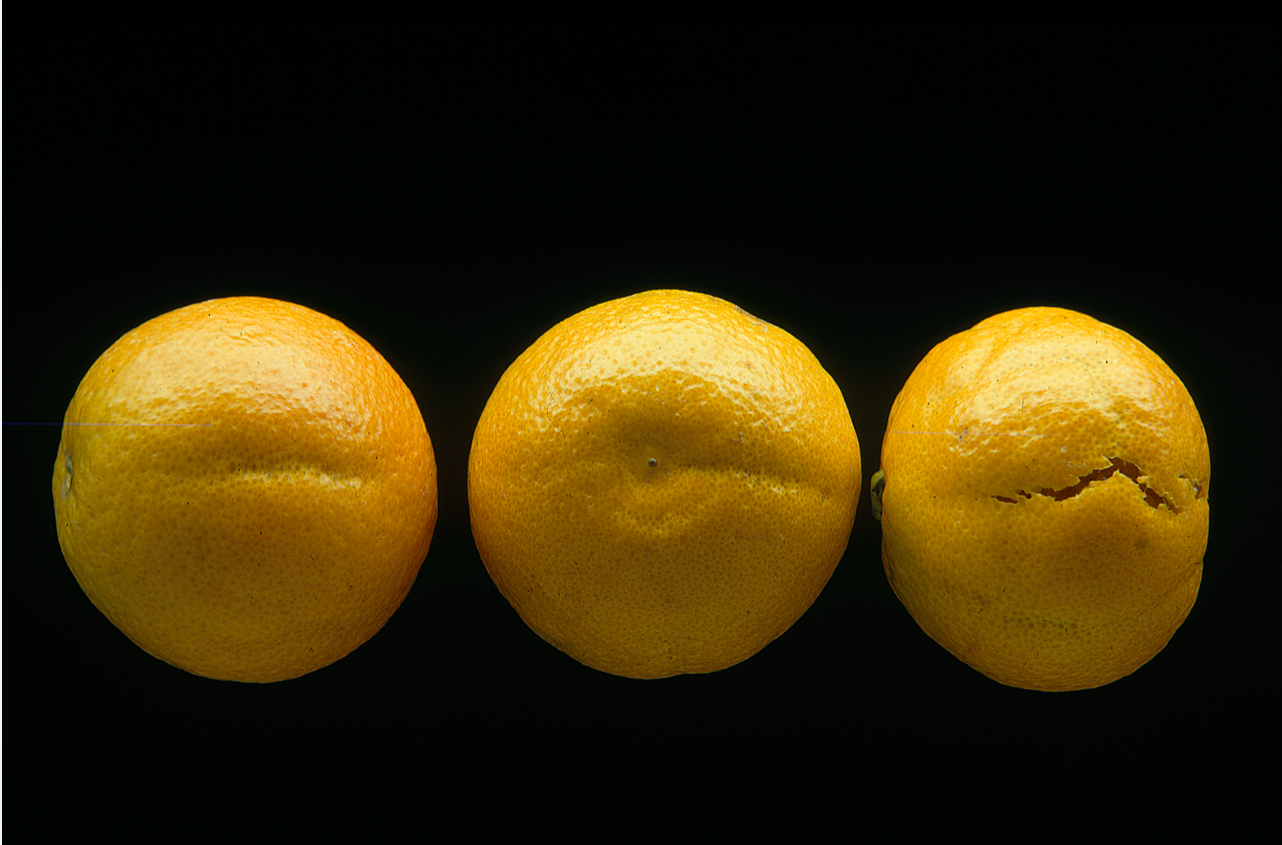
Nutritional status and environmental conditions contribute to puff and crease in citrus. This disorder, seen as an uneven…
Read Article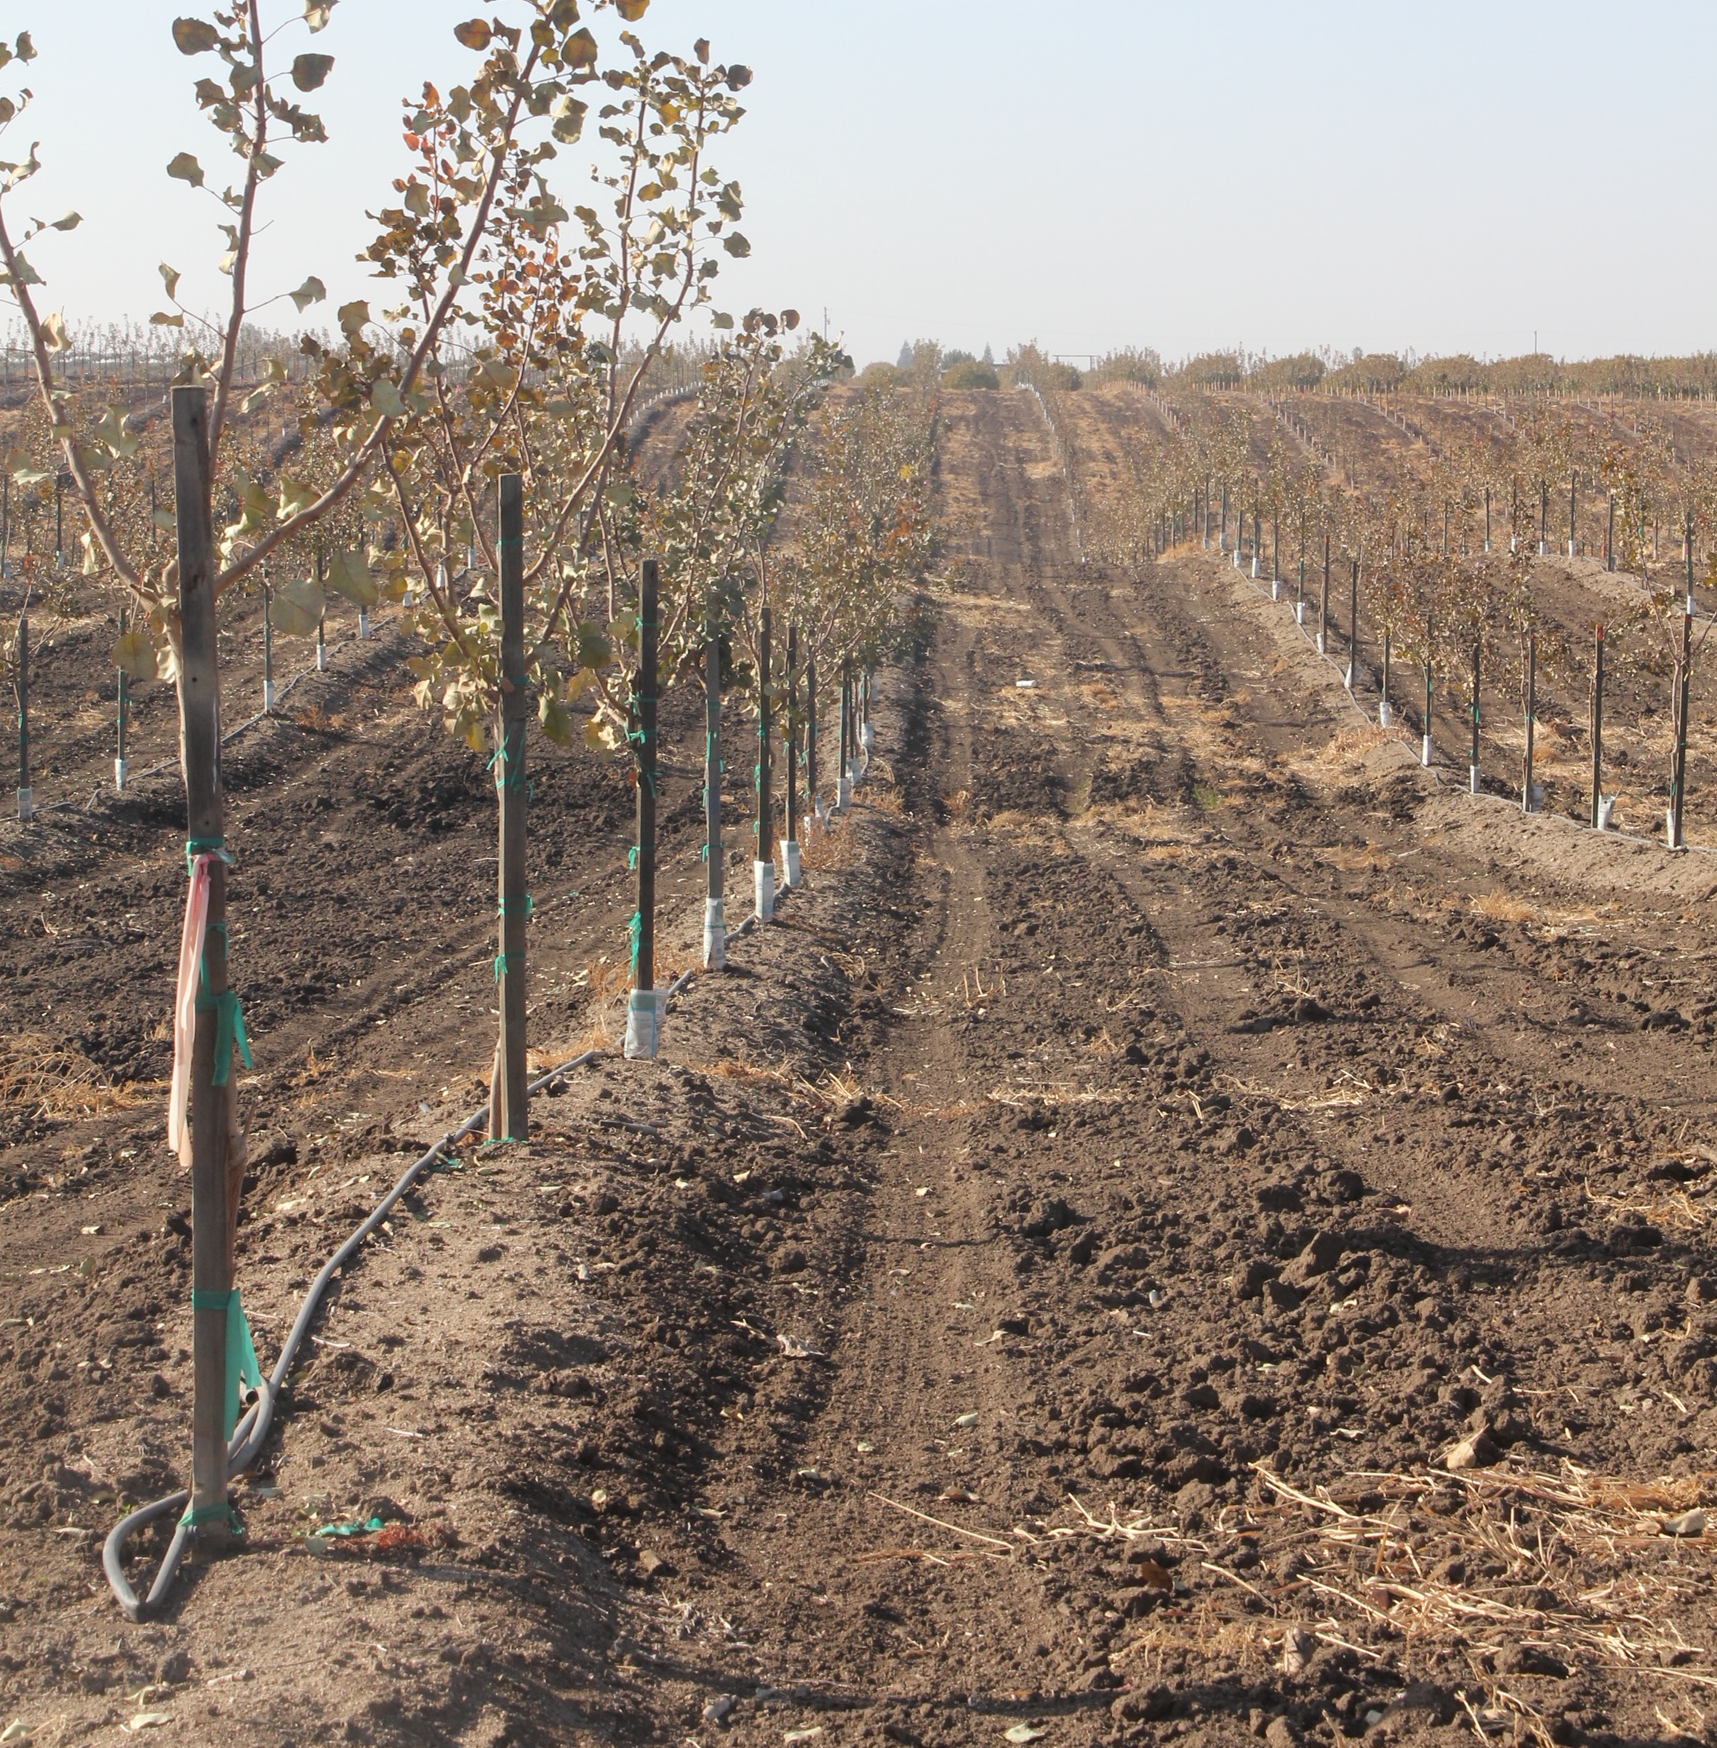
Production potential of a pistachio orchard is maximized with deep, well-drained soils, but this hardy tree nut species…
Read Article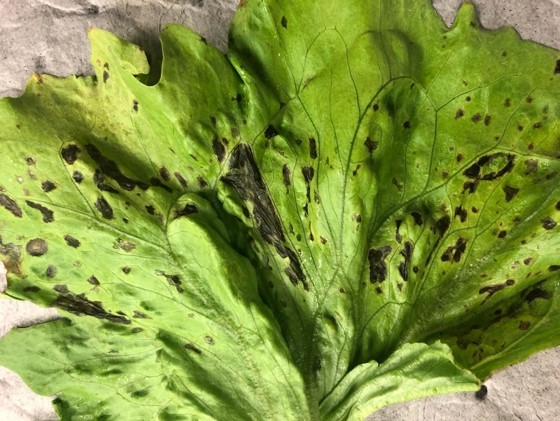
Bacterial Leaf Spot (BLS) of lettuce was first reported in the U.S. in 1918 in South Carolina. The…
Read Article