Home Blog Page 3

Actual Grapevine Water Use and Water Status Are Affected by Vineyard Topography

Figure 1. Aerial photo of the study vineyard blocks with north- and south-facing aspects and locations of the evapotranspiration (ET) measurement stations.

Many California specialty crop production areas often face significant water supply curtailments due to recurring droughts and stringent environmental regulations. In this context, the utilization of field-specific information is crucial to enhance irrigation management practices and pursue profitable and high-quality food production under more pronounced weather vagaries and increasingly variable fresh water supplies.

The rapid adoption of pressure-compensating microirrigation systems during the last 15 years has enabled California winegrape growers to establish vineyards in areas with marginal soils and sloping terrains that otherwise were unsuited to other irrigation methods. While some degree of slope can be beneficial in vineyards for improved drainage of excess water, better airflow through the vines and faster escape of cold air to reduce the risks of springtime frost damages, it can affect microclimatic conditions, radiation interception, vine water use and sometimes influence grapes ripening.

Several researchers documented winegrape quality ties with irrigation management and grapevine water status (Jackson and Lombard 1993; Kennedy et al. 2002; Downey et al. 2004). The amount of irrigation water required to grow quality winegrapes and the frequency of irrigation applications depend on several site-specific factors, such as vine growth stage, vine and row spacing, vine density, size of vine canopy (Williams, 2001), soil texture and terrain characteristics.

Little information is available to growers about water use of vineyards on sloping terrains with different aspects. Such information is necessary as growers seek more resource-efficient production practices and vine water stress monitoring techniques to manage grape yield and quality, and as future water supplies become increasingly variable, uncertain, limited and costly.

Recently, a team of UC researchers measured the actual grapevine evapotranspiration (ETa), its seasonal dynamics and vine water status in two winegrape vineyard blocks grown with microirrigation on sloping terrains with north- and south-facing aspects in El Dorado County during three consecutive seasons (2016, 2017, 2018).  The goal of this field research study was documenting differences in grapevine water consumption (ET) due to slope and aspect for adapting irrigation management based on vineyard topography.

Study Site and Field Data Collection
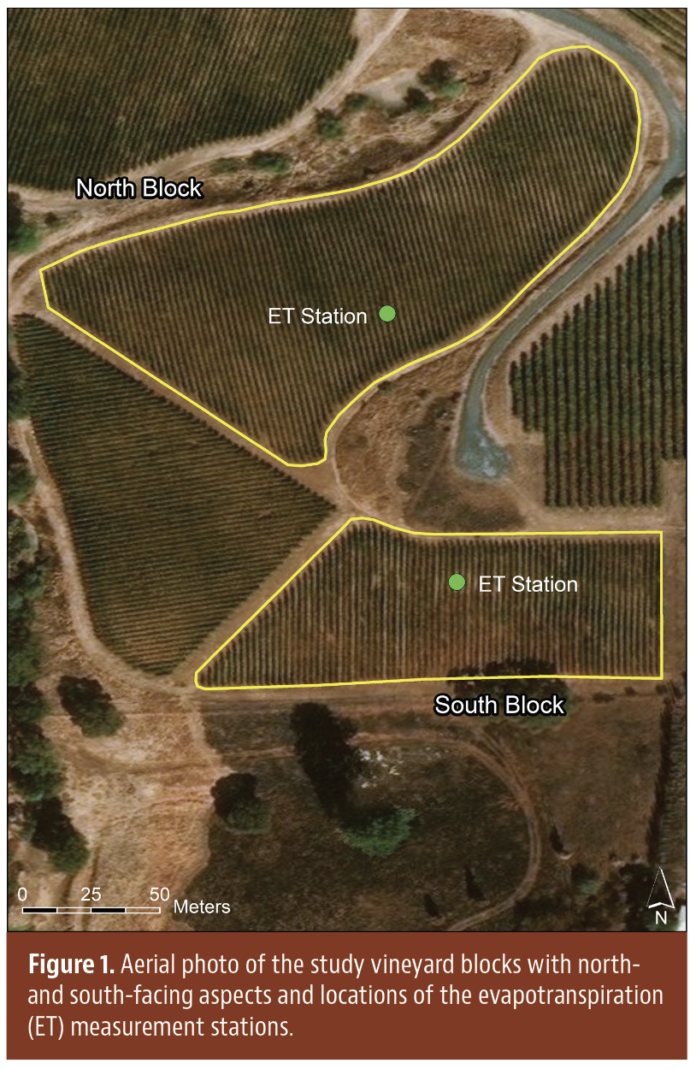
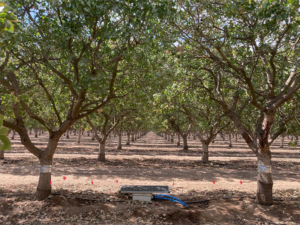
The UC team instrumented two adjacent north- and south-facing commercial vineyard blocks (Fig. 1) located near Pilot Hill in El Dorado County for collecting field data of biophysical parameters. El Dorado County is in the foothills of the Sierra Nevada mountains and is a relatively small but growing California winegrape production region falling within the California grape pricing district 10, where the top three varieties are Zinfandel, Cabernet Sauvignon and Syrah. 

Both the vineyard blocks consisted of vines of Cabernet Sauvignon grafted onto 3309 Couderc rootstock, planted in 2000 at a density of 1,507 vines per acre and trained in a bilateral cordon vertical shoot positioned system with north-south vine row orientation. The vines were irrigated using single driplines with two pressure-compensating online button drippers per vine with nominal flowrate of 0.5 gph.

Both the north and south blocks had Auburn series very rocky loam soil with a typical depth of 2 feet, as mapped by the USDA-National Cooperative Soil Survey (California Soil Resource Lab 2019). The north-facing slope presented a different, shallower soil, with bedrock at 33 inches depth, but with less gravel content in the upper 20 inches and more finely textured clay retaining more moisture than in the south-slope soil. The terrain slopes in the north and south blocks were 24.5% and 25.5%, respectively.

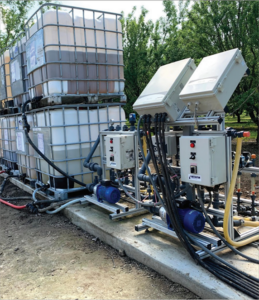
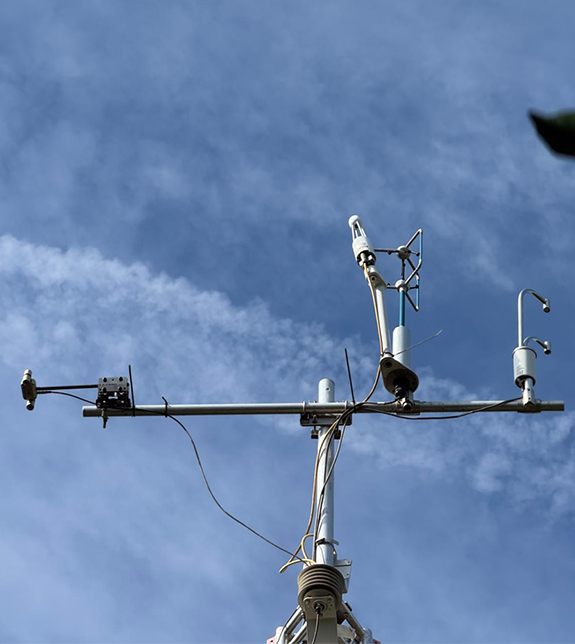
ETa was determined with the residual of energy balance method from micrometeorological measurements of net radiation (Rn), ground heat flux and sensible heat flux obtained from one full-flux ET measurement station at each vineyard block (Fig. 1) consisting of a combination of eddy covariance and surface renewal equipment.

Actual crop coefficient (Ka) values were calculated dividing the measured ETa by atmospheric water demand (ETo) values obtained over the corresponding time-step from the automated weather station #195 (Auburn) of the California Irrigation Management Information System (CIMIS), according to the relation Ka = ETa/ETo.

The UC team assessed the vine water status during the three growing seasons with periodic measurements of the midday stem water potential on clear-sky days (between 11:00 a.m. and 2:00 p.m.) using a Scholander-type pressure chamber on six vines per vineyard block (one fully expanded and shaded leaf per vine), which were randomly selected within the footprint area of each ET station.

Table 1 reports the amounts of irrigation water applied in the north- and south-facing vineyard blocks, recorded with magnetic flowmeters during the three consecutive crop seasons and the monthly rainfall values recorded at the nearby CIMIS station. Differences in applied water were observed between the north and south blocks, which likely resulted from different application rates between the blocks but also from adjustments of irrigation frequency and duration based on visual assessment of vines’ and appearance. In fact, the vineyard manager applied irrigation water with varying frequencies and durations over the different months, the vineyard manager reported that irrigations for the two vineyards blocks were scheduled based on visual observations of the vines. The vineyard manager also considered the available soil moisture from periodic soil probing and existing water supply limitations.

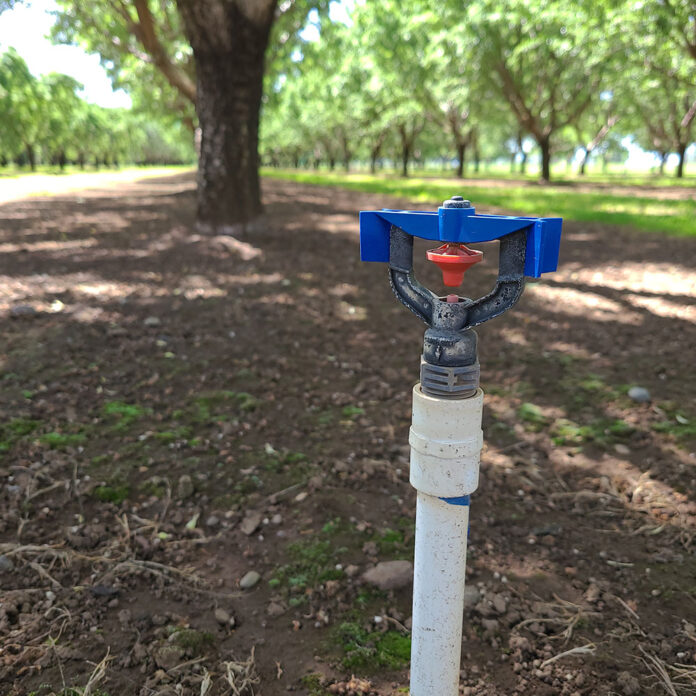
Light interception by the vine canopies was measured during the 2018 growing season using the ‘Paso Panel’ canopy shade meter (Battany 2009), which consists of a solar collector panel, a voltage meter and power switch attached to a portable frame. Holding the Paso Panel underneath the grapevine canopy for a few seconds allowed for measuring the voltage current generated by sunlight passing through the foliage and striking the panel’s surface as illustrated in Figure 2.

Figure 2. Measurement of light interception by vine canopies in a commercial production vineyard on the California Central Coast (left) and the study vineyard in El Dorado County (right) (photos courtesy Mark Battany, UCCE, and D. Zaccaria.)

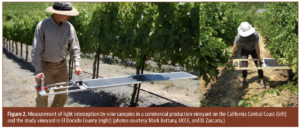
The current readings obtained placing the panel under vine canopies at multiple locations in the vineyards were then divided by current readings taken under full sun outside the vineyards to determine the shaded area by the vine canopy, which is a proxy of the vines’ fractional canopy cover. All the measurements in the north and south vineyard blocks were taken during clear-sky days at solar noon ± one hour and then calibrated against full-sun current readings. The values of shaded area by vines (%) were used to determine comparative differences in vines’ canopy growth and size between the north and south blocks.

Actual Grapevine Water Use for North- and South-Facing Blocks
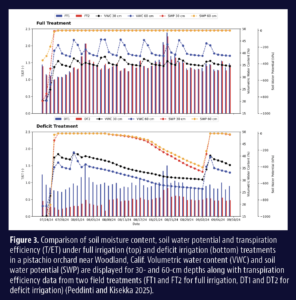
Figure 3 illustrates the ETa for the north and south vineyard blocks in 2016, 2017 and 2018 along with ETo. From the figure, it can be noticed that the north and south blocks had very similar season-long cumulative ETa values, but the time course of ETa differed between the two blocks during the three growing seasons. In the 2016 and 2018 growing seasons, ETa was slightly higher in the south block than the north block from April to early June, then ETa of the north and south blocks matched in late June. Afterward, the north block had slightly higher ETa from late June until late September to early October.

Figure 3. Season-long cumulative actual grapevine evapotranspiration (ETa) measured in the north- and south-facing vineyard blocks and reference grass evapotranspiration (ETo) obtained from the local CIMIS station (Station #195, Auburn, Calif.) for 2016-18 seasons.

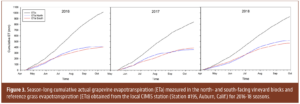
The field dataset of 2017 shows very similar seasonal cumulative ETa values for the north and south blocks, but differences in ETa can only be noticed for the period from late June to early September, with the north block having slightly higher ETa than the south block, which is consistent with the pattern of 2016 and 2018. From mid-September to late October 2017, the south block had slightly higher ETa than the north block, which reveals a contrasting pattern to that of 2016 and 2018. The higher late season ETa in the north block in 2017 was probably due to larger water applications that occurred during irrigation events in late July and August in the area surrounding the ET measurement station of the north vineyard, which likely resulted from a dripline leak going unnoticed for more than a month as reported by the vineyard manager and as revealed by the flowmeter records of 2017 (Table 1).

Table 1. Applied irrigation water in the north (N) and south (S) facing study vineyards blocks obtained from flowmeter records and monthly cumulative rainfall during the 2016-18 crop seasons from CIMIS station #195.

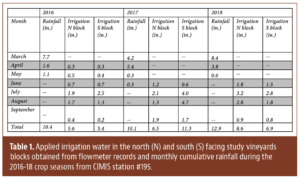
Figure 4 shows the time course of weekly averaged ETa values measured in the north and south vineyard blocks for the three seasons. In this case, slightly higher ETa was observed in the south block early in the season from April to early June in all three years; afterwards, higher ETa occurred in the N block during the central part of the season from early to mid-June through early to mid-August in all three years, whereas slightly higher ETa was observed in the south block relative to the north block in the late part of the season in 2016 and 2017. On the contrary, slightly higher ETa was observed in the north block relative to the south block during the late part of the 2018 season.
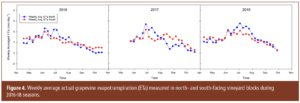
Figure 4. Weekly average actual grapevine evapotranspiration (ETa) measured in north- and south-facing vineyard blocks during
2016-18 seasons.

The data in Figure 4 clearly show vines in the north block expressed higher water use during the central part of the growing season, which is possibly related to higher interception of solar radiation during the period around the summer solstice, when the sun reaches its most northerly excursion relative to the equator. Higher water use in that period may also be related to the north block having relatively larger canopy size or accessing larger soil moisture reserves, thus facing less water limitations during the hottest part of the growing season.

Figure 5 shows the weekly cumulative values of Rn measured in the north and south blocks during the study seasons. The Rn data show higher Rn values were measured in the south block during the early and late parts of the season in all three years, whereas Rn values were similar in both blocks in the central part of the growing season in 2016 and 2018, or slightly higher in the north than the south block in 2017.

Figure 5. Weekly cumulative values of the net radiation (Rn) measured in north- and south-facing vineyard blocks during 2016-18 seasons.

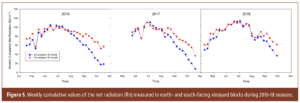
Rn is the main force driving crop evapotranspiration. In detail, when soil moisture is abundant and can support vine water consumption without restrictions, higher Rn leads to higher grapevine ETa, all other factors (vines’ canopy size, light interception, available soil moisture) being similar. In the Mediterranean climate of northern California, these conditions normally occur in the period between March and mid-June, when grapevine growth is supported by abundant soil moisture resulting from late winter and early spring rainfall, thus there is no need to irrigate. Later, Rn still drives ETa, which is however dynamically regulated by the available soil moisture from irrigation and by the amount of radiation intercepted by the vines’ canopy. As such, the ETa pattern may not necessarily follow that of Rn, especially when vines face water stress because of deficit irrigation or because of difference in vines’ canopy size or soil moisture available to roots. In other words, multiple factors regulate the actual vine ETa, including canopy size, row orientation and available soil moisture as well as the angle of incidence of solar radiation, which in turn depends on the position of the sun along the growing season relative to vineyard topography (i.e., slope and aspect).

A good relative indicator of vine water use is the actual crop coefficient (Ka), which reflects the actual ETa rate relative to ETo. Figure 6 shows the weekly averaged grapevine Ka values calculated for the north and south blocks over the course of the three consecutive seasons. Ka integrates the atmospheric water demand with the grapevine’s physiologic processes, regulating the actual vine evapotranspiration alongside the plant-available soil moisture, thus providing synthetic information on actual grapevine water use in the site-specific and plant-specific conditions of the vineyard study blocks.

Figure 6. Weekly averaged values of the actual crop coefficient (Ka) measured in north- and south-facing vineyard blocks during the 2016-18 seasons.

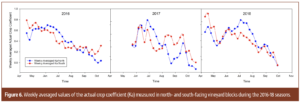
Figure 6 shows Ka was higher in the south block early in the season until mid-May 2016 and 2018, then the north block had higher Ka than the south block from early June to early August in all three seasons. Afterward, Ka was higher in the south block from mid-August to the end of the crop season in 2016 and 2017, whereas it was similar in the north and south blocks from mid-August to the end of the 2018 crop season. The figure also shows in 2016 and 2018 that Ka reached its peak values early in the season between mid-April to early May (whereas in 2017, peak Ka values were observed around late June) and progressively decreased during the course of the growing season, revealing increasing ETa reduction.

Following ETa or Ka could provide relevant information for tailoring irrigation management decisions (i.e., timing and amounts of water applications) based on actual grapevine water consumption, especially during periods of water supply restrictions. However, ET-based irrigation scheduling alone may not allow for targeting water stress levels that are conducive to reductions of grapevine vegetative growth and to specific fruit yield and quality targets.

Some additional considerations can be drawn observing Figure 7, which shows the values of midday stem water potential (ΨSTEM) measured in the north and south blocks over the course of the three crop seasons. In all three years, ΨSTEM values decreased progressively from values between -2 ÷ -4 bars early in the season to values between -12 ÷ -15 bars towards the final part of the season, revealing vines in both the north and south blocks were exposed to increasing water stress. Vines in the south blocks had relatively lower (more negative) ΨSTEM values from April to early or mid-August in 2016, 2017 and 2018. ΨSTEM values were lower in the north block from early August to the end of the season in 2016 and 2017, whereas vines in the north and south blocks had similar ΨSTEM values from mid-August to the end of the season in 2018.

Figure 7. Stem water potential (ΨSTEM) values measured in north- and south-facing vineyard blocks during the 2016-18 seasons.

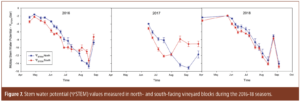
As far as plant water status is concerned, the relatively lower ΨSTEM values of vines in the S block in the first half of the crop season for all three seasons could possibly be due to higher environmental water demand on those vines (i.e., higher Rn). Similarly, the lower ΨSTEM values of north vines during the central part of the season was possibly related to higher environmental water demand in the north block due to similar incidence of solar radiation between the two blocks but higher light interception by the vines (resulting from larger vines’ canopy) in the north block. Alongside, the flow meter records showed larger irrigation water applications in the south block in late July and August 2016 and 2017, which possibly relieved some water stress on the south vines.

Table 2 reports the values of light interception by the vines’ canopy measured during the 2018 season in the north and south blocks, which reveal slightly faster vegetative growth and larger vines’ canopy size in the north than the south during the 2018 crop season.

Table 2. Light interception by vines’ canopy measured in the north (N) and south (S) study vineyard blocks during the 2018 season.

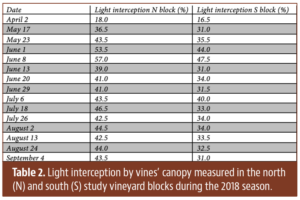
According to Kurtural et al. (2007), faster canopy growth and larger canopy size in north-facing vineyards can be expected in Mediterranean climate as a result of relatively earlier bud-break and relatively lower impact of heat stress on vines relative to south facing slopes. All other factors being equal, in south facing slopes heat can increase during daytime above stress threshold levels, thus causing lower stomata conductance, less carbon assimilation and slower vegetation growth.

Controlling Water Use and Status at a Higher Level
Many winegrapes production regions have hillside vineyards, where the actual water consumption is affected not only by grapevine age and health, vine density, canopy size, row orientation and irrigation management practices, but also by the terrain slope and aspect. Topography affects the amount of solar radiation the vines receive and intercept, which is a major driving force of grapevine evapotranspiration under abundant soil moisture.

Irrigation scheduling for winegrape vineyards must consider multiple factors that regulate actual grapevine water consumption in order to maintain vine water status at specific target levels for limiting vegetative growth while pursuing fruit yield and quality objectives. Among others, vines’ canopy size, row orientation and available soil moisture to vines are major factors. However, the field datasets collected in the UC research study show vineyard topography factors (i.e., slope and aspect) also play a significant role in regulating ETa in hillside vineyards. As such, following an evapotranspiration-based irrigation scheduling with generalized crop coefficients derived from other locations and vineyard conditions may not be appropriate. Instead, following ETa and Ka determined for the site-specific vineyard conditions provides relevant information for irrigation scheduling decisions, but may not enable growers to pursue vine water stress levels that are desirable in specific stages of the growing season for achieving grape yield and fruit composition objectives.

Integrating weather- and plant-based irrigation scheduling approaches allows for higher level of control on grapevine water status that is necessary for grape yield, composition and quality purposes. For example, following ETa and Ka while keeping track of ΨSTEM values can provide more integrative information on actual vines’ evapotranspiration and water status for more precise irrigation management decisions.

In the field, ΨSTEM values can help decide irrigation timings more precisely, while ETa and Ka enable to determine adequate irrigation amounts for maintaining the desired water deficit levels to balance vegetative growth with grape yield and composition goals.

References
Battany, M.C., 2009. Estimating vineyard water use in the estrella-creston area of concern. Url http://cesanluisobispo.ucdavis.edu/files/71055.pdf

California Soil Resource Lab., 2019. Ssurgo (soil survey geographic), url https://casoilresource.lawr.ucdavis.edu/soilweb-apps
Cimis, 2018. California irrigation management information system, url https://cimis.water.ca.gov/

Downey, M.O., Harvey, J.S., Robinson, S.P., 2004. The effect of bunch shading on berry development and flavonoid accumulation in shiraz grapes. Australian journal of grape and wine research, 10(1), 55-73.

Jackson, D.I., Lombard, P.B., 1993. Environmental and management practices affecting grape composition and wine quality-a review. American journal of enology and viticulture, 44(4), 409-430.

Kennedy, j.a., Matthews, m.a., Waterhouse, a.l., 2002. Effect of maturity and vine water status on grape skin and wine flavonoids. American journal of enology and viticulture, 53(4), 268-274.

Kurtural, s.k., Dami, i.e., Taylor, b.h., 2007. Utilizing gis technologies in selection of suitable vineyard sites. International journal of fruit science, 6(3), 87-107.

Williams, l.e., 2001. Irrigation of winegrapes in california. Practical winery & vineyard, 23, 42-55.

New Data on Insecticide Resistance in Alfalfa Weevil

Insecticide resistance threatens current management regimes for alfalfa weevil. Reducing selection pressure through fewer insecticide applications would aid resistance management.

In the Western U.S., alfalfa weevil is one of the key arthropod pests. Left unmanaged, it can defoliate alfalfa stands and cause economic damage through yield and quality loss. Because of this, alfalfa weevils are frequently managed, typically with insecticide applications, given the availability (or lack thereof) of many tools for weevil management.

Insecticide resistance threatens current management regimes for alfalfa weevil. Problematically, alfalfa weevil has displayed a capacity to evolve insecticide resistance during its time as a pest in North America, demonstrating this isn’t a new issue. For instance, treatment failures were reported in Utah in the 1960s for heptachlor, an old insecticide chemistry.
Pyrethroid insecticides have been heavily relied upon for over a decade for alfalfa weevil management. This has included several active ingredients (and products), but lambda-cyhalothrin in particular has seen very heavy use. Pyrethroids have been highly effective for alfalfa weevil and have been cost-effective, which is especially relevant for alfalfa as a field crop with often tight margins. Given the utility of pyrethroids, many fields were sprayed with them yearly. This intense selection pressure has created pockets of resistance in California, most other western states, various midwestern states and Canada. It is also important to remember insecticide resistance occurs when an insect pest can tolerate typically lethal doses of an insecticide. Not all individual insects in a population are equal in their genetics, which means resistance, or “reduced susceptibility,” can be present before a complete control failure in the field is noted. In areas with high degrees of resistance, pyrethroids became completely ineffective.

Currently, indoxacarb (Steward) has been the primary alternative to pyrethroids. In some regions, with the onset of resistance, indoxacarb has become the primary (or only) insecticide used to manage alfalfa weevils. This switch has been rapid at times. Indoxacarb has also seen an uptick in usage because it is not as harsh on natural enemies of aphids as pyrethroids and thus causes fewer aphid issues. Therefore, it has benefits to production outside of providing an alternative should pyrethroids fail. Cost-wise, it is more expensive than pyrethroids, which likely limited its use. In these areas with high pyrethroid resistance, indoxacarb has become the only insecticide used in recent years, with resistant alfalfa weevils forcing growers’ hands in terms of insecticide choice.

Results from the survey of lambda-cyhalothrin resistance in alfalfa weevil populations are displayed using pie charts. Each circle represents an individual county. (adapted from Rodbell et al. 2022)

Research on Pyrethroid Resistance
Our research, led by Montana State and UC Davis with cooperators from UC ANR (advisors) and faculty in other states, documented resistance to pyrethroids (specifically lambda-cyhalothrin) in many western states. This reflected issues known among California growers and PCAs regarding intense resistance. In California, this included areas of Siskiyou, Merced and Riverside counties. We conducted a multi-state assessment of susceptibility to lambda-cyhalothrin, a type II pyrethroid, along with additional assays targeting other type II and type I pyrethroids. In brief, we used laboratory bioassays with alfalfa weevils from multiple populations and exposed them to multiple concentrations of the tested insecticide using a coated glass vial.

The findings indicate resistance to lambda-cyhalothrin is present across the western U.S. Resistance is present in virtually all western states tested, sometimes at very high levels. That said, especially in cases where our sampling did not explicitly target areas where resistance was known to be prevalent due to control failures, susceptibility was still observed in many regions. Importantly, resistance exists on a gradient, with many populations falling along this spectrum, including some in the moderately resistant category or barely within our self-defined “susceptible” category. This means that continued selection could easily push these populations into a more resistant category. Various populations also displayed multiple resistance, with resistance to both lambda-cyhalothrin and other type II pyrethroids, including beta-cyfluthrin, zeta-cypermethrin, alpha-cypermethrin and zeta-cypermethrin. Given that we do not know if populations were only exposed to one type II pyrethroid active ingredient or multiple active ingredients, these resistance patterns could be driven by exposure to a single active ingredient or some mixture over time. However, this means in many cases, multiple pyrethroids would be rendered ineffective simultaneously.
Results from the survey of lambda-cyhalothrin resistance in alfalfa weevil populations are displayed using pie charts. Each circle represents an individual county. Within each county, we tested different numbers of populations, with each population represented by a slice of the pie. Different colors indicate resistance level categories. Additionally, two counties in California with known histories of past high-level resistance issues where we did not obtain usable data or where we did not find high levels of resistance are indicated with colored squares. Importantly, some populations were specifically tested due to known issues with insecticide resistance, especially in states other than Montana and California, while populations in those two states were tested more randomly to better assess the scope of resistance (Rodbell et al. 2022).

Managing Insecticide Resistance
One of the primary methods of avoiding or managing insecticide resistance is rotating modes of action across generations of a pest. For alfalfa weevil, rotation would typically occur across years because alfalfa weevil has one significant peak of activity per year. Unfortunately, alfalfa currently has very limited insecticide options for alfalfa weevil. There are a handful of possible options, but none are effective enough to manage alfalfa weevils in most scenarios. For instance, spinosad provides some level of control but is most relevant in organic production due to its more limited efficacy. Without many options for rotation, pest managers have few choices to create a rotation. Furthermore, the pipeline for new insecticides is fairly empty, and the outlook for new materials is not promising. Any new materials would be welcome tools, but they too would need to be managed from a resistance standpoint.

Reliance on a single insecticide eliminates the resistance-breaking benefits of insecticide rotations. This increases the likelihood that not just one but two modes of action could be lost in a given area due to insecticide resistance. Importantly, through our resistance survey, we identified lambda-cyhalothrin resistance in a population can range from highly susceptible to very resistant. Areas with pyrethroid susceptibility could retain pyrethroids longer by incorporating other modes of action into a rotation, currently involving indoxacarb. In areas with low to moderate resistance, rotation is even more critical. Increased usage of indoxacarb could heighten selection pressure, although rotation could help preserve susceptibility. While resistant populations may take time to re-establish susceptibility to pyrethroids, some regions that have not used pyrethroids for a prolonged period may see a reversion to susceptibility. PCAs and growers frequently ask when they can return to pyrethroids after resistance develops; however, determining susceptibility to pyrethroids is not frequently done rigorously due to logistical constraints. Ensuring there are modes of action to rotate is critical, and pyrethroids can play a role if enough susceptibility exists.

Due to pyrethroid resistance, there is an urgent need for improved resistance management. Determining the scope of insecticide resistance (and susceptibility) is a crucial step to better target resistance management efforts. Our pyrethroid resistance survey provides a snapshot of resistance for lambda-cyhalothrin via lab assays. We conducted limited vial-based bioassays for indoxacarb. Importantly, for the several populations from Siskiyou County tested, susceptibility remained high and was virtually identical across the populations. In Merced County, susceptibility was slightly lower and more variable, potentially due to beginning shifts in susceptibility from multiple years of indoxacarb use. Any changes may not be evident to growers until efficacy drops significantly, as happened with pyrethroids.

Reducing selection pressure through fewer insecticide applications would aid resistance management. Agronomic practices that promote robust stands and vigorous crop growth can help mitigate damage. Additionally, reliance on economic thresholds and rigorous scouting can prevent unnecessary applications.

Proactive resistance management remains possible, and incorporating older but effective materials like pyrethroids when appropriate may promote long-term success in managing alfalfa weevils with insecticides.

The authors would like to thank the late Dr. Kevin Wanner (2024), who lead the associated project for this work on alfalfa and was a dedicated extension entomologist, scientist and mentor.

References
Rodbell, E. A., Hendrick, M. L., Grettenberger, I. M., & Wanner, K. W. (2022). Alfalfa weevil (Coleoptera: Curculionidae) resistance to lambda-cyhalothrin in the western United States. Journal of Economic Entomology, 115(6), 2029-2040.

Rodbell, E. A., Caron, C. G., Rondon, S. I., Masood, M. U., & Wanner, K. W. (2024). Alfalfa weevils (Coleoptera: Curculionidae) in the western United States are resistant to multiple type II pyrethroid insecticides. Journal of Economic Entomology, 117(1), 280-292.

Flowmeters Can Make Fertigation More Precise

Figure 1. Nurse tanks are towed out to fields and used for injecting fertilizer into the irrigation blocks. Markings on the side of the tank are often used for determining the volume of fertilizer to inject (photo by M. Cahn.)

Growers will need to implement practices to protect groundwater from nitrate contamination to comply with the water quality regulations in California. Many growers now use drip irrigation to achieve higher efficiency with water and nitrogen fertilizer applications. Fertigating through drip systems allows nutrients to be applied more frequently than with tractor applications so rates can be adjusted to match the N uptake rate of the crop as well as place nutrients in the root zone.

The right amount of N fertilizer to apply to a crop will depend on the application interval and N uptake rate, which varies at different growth stages. Recently established vegetable crops uptake much less N than maturing crops. Also, crediting for nitrate in irrigation water, soil and tissue testing can further refine fertilizer recommendations.

Once the amount of N has been determined, irrigators must accurately inject the correct volume of fertilizer through the irrigation system. To accomplish this, they need the right equipment and training. Farming operations that produce vegetables and row crops often use fertigation trailers for transporting fertilizer to the field and injecting liquid fertilizer into an irrigation system. A fertigation trailer usually consists of a nurse tank with a capacity of 500 to 1,000 gallons and a small gas or electric pump (Fig. 1). Fertilizer is usually transferred from large storage tanks into the nurse tank using small gas-powered pumps (Fig. 2).

Figure 2. Large tanks are typically used to store fertilizer on farms. Pumping equipment is used to transfer fertilizer to nurse tanks (photo by M. Cahn.)

Few fertigation trailers or large fertilizer tanks include a flowmeter to measure the volume of fertilizer transferred to a nurse tank or metered into the irrigation system. Irrigators often rely on markings on the side of the nurse tank to estimate the volume of fertilizer pumped (Fig. 1). These markings are usually not accurately calibrated nor have fine enough graduations to precisely meter out fertilizer. Furthermore, the markings can be hard to read, especially if the trailer is not positioned on a level surface.

A flowmeter could increase the accuracy of metering fertilizer into a nurse tank or for measuring the volume of fertilizer injected into the irrigation system. A flowmeter would also facilitate tracking the volume of fertilizer applied to each crop. Either an irrigator could manually record the readings, or the meter can be wired to a data logger or control system to automatically register volumes.

Accurately measuring fertilizer volume with a flowmeter can be challenging. Fertilizers can be corrosive to equipment and instrumentation, and they have a range of densities that can affect flow measurements. More than a decade ago, we tested several models of fertilizer flowmeters, which proved to be inaccurate. Since that time, many improvements have been made in flowmeter technology. Hence, it seemed worthwhile to test the accuracy and precision of a new generation of fertilizer flowmeters.

Evaluating Flowmeter Accuracy for Fertilizer Application
We evaluated three flowmeter models designed for metering liquid fertilizer:
• Banjo FM100 meter
• Dura-meter
• Blue White F-1000

Each model relies on a different mechanism to monitor fertilizer volume. The Banjo meter measures flow using a magnetic sensor, the Dura-meter uses a nutating disk and the Blue White meter (Fig. 3) uses a small propeller.

Figure 3. Three flowmeter models that use different mechanisms for measuring flow were evaluated for accuracy in measuring the volume of fertilizer pumped from a tank.

The accuracy of the flowmeters was tested using 25 gallons of either water, ammonium nitrate (AN20, 20% N), or urea-ammonium nitrate (UAN32, 32% N). These liquids have varying densities (water = 8.3 lbs/gal, AN20 = 10.5 lbs/gal, UAN32 = 11.1 lbs/gal). A testing manifold was set up in the UCCE greenhouse in Monterey County that pumped a calibrated volume of each fluid through the flowmeters using an electric diaphragm pump (Fig. 4). Five or more test runs were made for each meter and fluid. The average volume measured and the standard deviation from the mean volume were calculated.

Figure 4. Apparatus for testing the accuracy of fertilizer flowmeters (photo by M. Cahn.)

Comparing Flowmeter Performance and Cost Efficiency
All three flowmeter models accurately measured water and fertilizer volumes (Table 1). Measurement errors were generally less than ±2% of the true volume. The Dura-meter was the most accurate flowmeter of the three models and had an overall average absolute error of -0.2 gallons per 25 gallons measured and a coefficient of variation of ±0.3%. The Blue White meter, which uses a paddle wheel to measure volume, was the least accurate and had an overall absolute error of 1 gallon per 25 gallons measured and a coefficient of variation of ±1.3%. The type of liquid metered affected the accuracy of the Banjo and Blue White meters more than the Dura-meter.

Table 1. Accuracy of flowmeter measurements of water and two types of liquid fertilizers (AN20 and UAN32).

Although the Dura-meter was the most accurate of the three flowmeters, it did require an initial calibration before testing began. The other meters could not be manually calibrated. The nutating disk mechanism in the Dura-meter directly measures liquid volume, which may explain why the meter was not affected by the different densities of the liquids tested. Both the paddle wheel and the magnetic sensor mechanisms used in the Blue White and Banjo meters indirectly estimate flow rate.

Another advantage of the Dura-meter was that it was the cheapest of the three meters when tests were conducted. Another version of the Dura-meter can be used to turn off an injection pump when a specified volume of fertilizer has been injected. This version is available as part of the Auto Batch System (Dura-ABS™).

The Banjo meter is also available in a model (MFM100) that can output an electrical pulse proportional to flow rate so the volume of injected fertilizer can be recorded on a data logger or control system. It could also potentially be wired to cut off the injection pump when a desired volume of fertilizer is metered into the irrigation system.

Best Practices
Any of the tested flowmeters could help irrigators more accurately apply the intended volume of fertilizer to a crop as well as verify and maintain records of the applied fertilizer volumes. Depending on the preferences of the growing operation, it may be more efficient to install the meters on either the fertigation trailer or the main fertilizer tank.

If a fertigation trailer is used for injecting fertilizer at several fields during the day, installing the meter on the trailer would be a logical choice. However, if the nurse tank is filled for fertigating one block at a time, the flowmeter could be installed on the main fertilizer tank. Finally, the flowmeters tested are also helpful for monitoring tractor-sidedress applications of liquid fertilizers.

The Ag Tech Revolution in 2025: Tools and Trends for Crop Consultants

As we kick off 2025, it’s clear agriculture technology is not just a buzzword; it’s the lifeblood of modern farming. Every year, we at Progressive Crop Consultant witness an influx of innovations designed to empower consultants, optimize crop production and meet the challenges of a rapidly changing agricultural landscape. This year is no exception.

For those of you in the field walking orchards, inspecting vineyards or evaluating broad-acre crops, you know firsthand staying informed about ag tech advancements isn’t optional. Your clients depend on you for insights that can boost yields, reduce costs and navigate increasing environmental and regulatory pressures. Let’s explore the most impactful ag tech trends shaping the industry in 2025 and how they can elevate your role as a trusted crop consultant.

Precision Agriculture: The Next Generation
Precision agriculture has been a mainstay in ag tech for years, but in 2025, it’s entering a new era. Today’s tools are faster, smarter and more precise thanks to artificial intelligence (AI), machine learning and next-generation IoT devices.

From drone imaging systems that provide real-time, multispectral field data to IoT-enabled sensors monitoring soil health, these technologies are making your job as a consultant more efficient and accurate. AI platforms now analyze complex datasets instantly, recommending specific actions like targeted fertilization, herbicide applications or irrigation adjustments. These are no longer nice-to-have tools; they’re critical for making data-driven decisions that save clients time and money.

What’s exciting is how accessible these tools have become. Many of your clients may already have access to precision ag hardware or platforms like FieldView or AgLeader. As their consultant, your ability to interpret and act on the outputs of these technologies could be the difference between an average season and a bumper crop.

The Soil Health Renaissance
Soil health has always been a cornerstone of successful farming, but 2025 is taking soil science to a new level. Digital soil mapping and biological inputs are the tools of choice this year.

Today’s digital soil maps provide real-time data on compaction, nutrient availability and microbial activity, giving consultants granular information that would have taken weeks to compile a decade ago. This precision allows you to recommend site-specific practices like micro-dosing nutrients, deep tilling, or even introducing cover crops.

On the biological side, engineered microbial solutions and biostimulants are offering new ways to improve nutrient uptake and resilience. These products are more advanced than ever, often tailored to specific crops, soil types or climate conditions. If you’re not already exploring biological inputs with your clients, now is the time; they’re a game-changer for sustainable and profitable farming.

Automating Pest and Disease Management
Managing pests and diseases is often one of the most time-consuming and costly aspects of farming. Thankfully, automation is stepping up in 2025.

Drones equipped with thermal imaging cameras can now identify hotspots for pests or diseases before they become widespread. Meanwhile, autonomous sprayers can target those areas with precision, reducing chemical use and labor costs.

Even better, AI-based pest ID apps allow you to take a picture in the field and get immediate recommendations for treatment. These tools are invaluable for consultants managing diverse crops or large acreage. When combined with historical pest data and weather patterns, you can offer clients a predictive pest control strategy rather than reactive solutions.

Climate Resilience: Meeting the Moment
Let’s face it: Climate change is no longer a theoretical problem. Droughts, heatwaves and erratic weather are reshaping agriculture. As consultants, your ability to guide clients through these challenges is more important than ever.

Ag tech in 2025 offers a host of climate resilience tools. Smart irrigation systems, for example, use weather forecasts and real-time soil moisture data to optimize water usage. Predictive modeling software can simulate how specific crops will perform under different weather scenarios, helping you recommend the right varieties and planting schedules.

Perhaps most exciting are the advances in heat-tolerant and drought-resistant crop genetics. These breakthroughs provide a lifeline for growers in regions where water scarcity or temperature extremes threaten yields. As their consultant, you’re in the perfect position to guide clients on integrating these new technologies into their operations.

Data Integration and Decision-Making
One of the biggest challenges we hear from consultants is “data overload.” With sensors, drones and apps collecting data from every angle, how do you sort through it all?

Thankfully, farm management platforms are becoming more sophisticated. Tools like Agworld and Granular integrate data from multiple sources (e.g., yield monitors, soil sensors, financial records) into a single dashboard. This makes it easier for consultants to identify patterns and offer actionable recommendations.

For those of you working with clients in premium markets, blockchain technology is also worth exploring. Blockchain ensures traceability, helping growers prove their crops meet organic or sustainable standards. As a consultant, helping clients implement traceability systems can open doors to higher-value markets.

Sustainability as a Profit Driver
We’ve talked about sustainability for years, but in 2025, it’s becoming a revenue generator. From carbon markets to regenerative agriculture, sustainability practices are now being financially incentivized.

Carbon credit programs, for example, reward growers for practices like cover cropping or reduced tillage. Consultants play a key role in helping clients implement these systems and navigate the application process.

Similarly, the growing demand for ecofriendly inputs is creating opportunities for consultants to recommend alternatives that align with market trends. Sustainable farming is no longer just good for the planet; it’s good for the bottom line.

If there’s one thing we’ve learned in 2025, it’s ag tech is here to stay. But while the tools are powerful, they’re only as effective as the people who use them. That’s where crop consultants come in.

You’re not just a service provider; you’re a trusted advisor, a problem solver and now a technology integrator. The role you play in interpreting and implementing these tools is more critical than ever. By staying informed and embracing these innovations, you ensure not only your clients’ success but also the future of agriculture itself.

At Progressive Crop Consultant, we’re committed to keeping you informed about the latest trends, tools and techniques. Together, we can tackle the challenges of 2025 and build a more resilient, profitable future for agriculture.

Let’s make this year one for the record books.

Advanced Crop Nutrition Management by Utilizing Continuous Fertigation

Trees do not require nutritional support in large amounts at discrete periods of time. They are continuously supporting various physiological activities and have been shown to benefit from continuous fertigation crop nutrition management that more closely aligns supply with incremental demand (photo by Taylor Chalstrom.)

Over 90% of all almond acres farmed in California are using fertigation to deliver crop nutrition. How-ever, the statewide average for nitrogen use efficiency is still around 70%. This value of 70% efficiency means we are essentially wasting around 65 lb of nitrogen per acre per year on a 2,200-lb crop. Additionally, there are negative environmental outcomes associated with these losses in the form of ground-water leaching and emissions.

Why does this demand and supply gap still exist using this more efficient management strategy? Well, we still lack a robust and accurate means for yield prediction, but more fundamentally, we’re fertigating ineffectively.

Looking at the newest UC Davis Cost Studies from 2024, the assumption used is that still, UAN-32 is applied monthly from March through May, then one additional postharvest application. This equates to 25% of the N budget being applied in each of four intervals. Let’s put this in context of another living organism. An average adult human being requires roughly a 2000-calorie daily intake or 14,000 calories per week. We could assume negative consequences would arise if that adult consumed all their weekly caloric needs in four sittings. A tree is no different in that it does not require nutritional support in large amounts at discrete periods of time. They are continuously supporting various physiological activities and have been shown to benefit from continuous fertigation crop nutrition management that more closely aligns supply with incremental demand.

What is Continuous Fertigation?
The management of crop nutrition by continuous fertigation is centered around delivering smaller amounts of fertilizer more frequently using irrigation water as a carrier. This usually takes the form of weekly or even sub-weekly fertigation events depending on irrigation system infrastructure and orchard characteristics. The rates at each interval should also align with the perceived demand. Most discussions on continuous fertigation typically pertain to N management due to characteristics of various forms and potential for loss.

Yara North America’s Incubator Farm in Modesto, Calif. has been trialing continuous fertigation in almond for five years.

How Continuous Fertigation is Implemented

At the field site
Although any irrigation/fertigation system can be utilized to perform continuous fertigation, a more sophisticated infrastructure that enables scheduling, monitoring and recording of individual events is typically required to mitigate labor constraints that are associated with physically executing applications. Individual events are most efficiently managed by remote scheduling.

There are many competing manufacturers in this irrigation and fertigation service provider space. When choosing the right equipment, don’t be fooled by all the fancy analytics and visuals. What’s most important is that you have the right combination of hardware and software interface for your needs. It should be adapted to your current system configuration, align with your workflow, reduce labor associated with fertigation operations, provide the right sensors and alarms to keep your system operational and be user-friendly to enable the seamless execution of your desired management strategy. In many cases, we see companies that get either the hardware right or the software interface right. There are only a few that get both.

Though this management style is best suited for well water applications due to control of the availability of water for prescheduling irrigation events, those stations operating by surface water delivery can typically plan with their ditch tenders to set block-by-block irrigation schedules accordingly. Once an irrigation event is planned or scheduled, growers can align the injection event with the irrigation based on soil type, soil conditions and the crop nutrition input source. As a general rule, nitrate and urea N sources move equally with water and thus should be positioned closer to the end of the irrigation event than an ammoniacal input source. It is also important to be aware of the soil type and conditions when deciding how long to flush the system after the fertilizer has been injected. The longer the flush, the greater chance of moving N past the rootzone. Injecting a spray indicator dye and observing coloration at various downstream points after an injection event is one way of determining how long your system should be flushed to ensure all materials are out of the system.

If the size of the field being serviced is over 40 ac, you will want to have the capacity to pump at least 100 gph (200 gph if over 100 ac) volume through your pump system to enable short duration fertigation events early in the growing season when transpiration rates are low but N demand is high. Lower rates can be used but impact the duration of input fertigation and may lead to injections that must start earlier than halfway through the irrigation set and potentially lead to greater leaching risks. For storage, one to two liquid tanks are required per station depending on compatibility of prescribed inputs or blends and field size.

As a grower, you need to work with a trusted and knowledgeable advisor who can provide a prescription for the appropriate inputs and rates at each event to match demand, manage chemical incompatibilities, mitigate blend “fall-out” (precipitation of minerals in fertilizer blend over time) and make in-season adaptations when necessary.       

Planning
Developing a seasonal plan is paramount to successful execution. As a grower, you’ll need a weekly schedule with specified inputs or blends, per-acre rates and per-set totals because your events will typically be scheduled by irrigation block.

As an advisor, developing a weekly schedule is more than just taking the seasonal N needs and dividing those evenly by the number of applications, then applying a specific product at a specific time. All your agronomy training, especially the 4Rs, is utilized in developing this type of recommendation.

It begins with a keen understanding of the demand curve. The rate of tree N demand is greatest between leaf-out and fruit development (sizing), then slows just a bit through kernel fill and then tapers off more as nuts reach maturity and through to senescence. Weekly rates should mirror this demand curve. The Almond Board of California has a good visual of this in their Nitrogen Best Management Practices handout.

Once you dial in the rates, you need to be aware of the abiotic conditions and physiological events taking place at various points through the season to choose the best input source to fulfill nutrient demand. Soil temperature, for one, is a significant factor. At Yara’s Incubator Farm in Modesto, Calif., we have a sandy loam soil that averaged about 56F between the middle of March and the middle of April. According to the Western Fertilizer Handbook, 2012, full conversion from ammoniacal nitrogen to plant-available nitrate N would be somewhere between six and nine weeks. To accurately match demand, you need to be aware of the time associated with nitrification rates. Just because we apply crop nutrition products to the field site doesn’t mean the plant can always access them. When inputs are not readily available to the plant, an unintended lag between application time and actual plant uptake may occur. In these earlier-season fertigation events, inputs with a higher percentage of nitrate N can ensure plant uptake as this form of nitrogen is fully plant-available regardless of soil temperature.

Results from a five-year continuous fertigation trial in almond by Yara North America show a $630/ac net profitability increase compared to “slug”-based grower standard programs supported by a 17% yield increase. The crop output per ac-inch of water improved almost 15%, and the fertilizer carbon footprint was reduced by 10%.

Why Continuous Fertigation Should Be Implemented
Though it may appear complex at first glance, continuous fertigation is fairly simple to adopt with the right tools and a knowledgeable advisor. It can be a far more prescriptive strategy that requires less guesswork when utilized properly. With regular field visits and tissue sampling efforts, it is easy to make minor adjustments along the way instead of only having basically three opportunities during the development of the crop to get it right.

There are several other key benefits to adopting a continuous fertigation strategy in almond. The first is profitability. There is absolutely a cost to nitrogen use efficiency (NUE). If the nitrogen applied does not generate greater output, then the dollars spent for those units of N are wasted, not to mention they’re environmental fate is likely further degradation of our groundwater resources and a recipe for further regulations.

To address NUE economics, let’s consider a 2200-lb/ac crop example. To save money, you can you cut 50 lbs N/ac and save roughly $30/ac, but you will need to increase from 70% to 90% NUE to maintain yields. However, consider the opportunity costs. If you maintain the same N rates and improve from 70% to 90% NUE, you now have the ability to support another 700 kernel lbs/ac. Now we’re making money instead of just saving.

That’s all just math though; how does this actually perform in real-world conditions?

Through good economic years and bad, we have been trialing continuous fertigation combined with higher nitrate N programs for the last five years at the Incubator Farm and externally. Over those five years, we have documented a $630/ac net profitability increase compared to a “slug”-based grower standard program supported by a 17% yield increase. The environmental impact of these programs is also reduced. The crop output per ac-inch of water has improved almost 15%, and the fertilizer carbon footprint has been reduced by 10%.

These results combined support a strong argument for continuous fertigation adoption by highlighting the gains in efficiency of production, resulting in greater productivity, profitability and input resource optimization.

Monitoring and Building Soil Health in California Vineyards

Figure 1. Example of a vineyard soil health scoring function modeled after Cornell’s CASH framework.

Soil health is central to sustainable agriculture and a key goal of regenerative and organic farming. Practices like the application of organic amendments, cover cropping, reduced tillage and livestock integration are promoted to improve soil health. Traditionally, sustainability or organic certifications have relied on the adoption of certain practices for monitoring and verification. However, newer regenerative agriculture certifications are introducing requirements for direct monitoring of soil health.

This shift raises important questions: How should soil health be measured and rated? How can these ratings inform management decisions? Should soil health ratings and interpretations be tailored to specific crops and regions?

To explore these issues, we conducted a case study analysis of 87 vineyard blocks across California, representing diverse management histories. This study aims to shed light on the link between regenerative agriculture and soil health monitoring in the context of California winegrape production.

Figure 2. Map of participating vineyard blocks and sample locations. A total of 87 vineyard blocks were sampled from as far north as the Russian River Valley AVA and down to the Happy Canyon of Santa Barbara AVA.

How to Measure Soil Health?
Numerous soil health assessment frameworks have been developed globally, each varying in practicality, sensitivity, and interpretability. These frameworks typically include indicators of physical, chemical and biological soil properties. In the U.S., commercial laboratories offer soil health testing packages priced between $55 to $165 per sample. However, the methods and indicators used in these packages vary, making it challenging to compare results across tests.

The Soil Health Institute evaluated 30 soil health indicators across 124 long-term experiments in Northern America and recommended a core suite of practical and affordable measurements: soil organic carbon (SOC), carbon mineralization potential (MinC) and aggregate stability index (ASI). These indicators were chosen for their response to management practices across a wide range of soils, climates and production systems. In our study, we focused on these three indicators due to growing interest among California growers and laboratories in the Soil Health Institute’s recommendations.

Interpreting Soil Health Measurements
When evaluating soil health indicators, it is common to wonder: Is a MinC value of 50 mg CO2-C/kg soil/day  good or bad? Last year, my soil had 1.2% SOC, but this year, the lab results showed 1.15%. Does this indicate a significant decline in soil health? What is the maximum aggregate stability achievable in my soil?

Answering these questions requires an understanding of expected soil health indicator ranges, the soil’s inherent potential and typical sampling and analysis errors. To address these complexities, Cornell’s Comprehensive Soil Health Assessment (CASH) developed scoring functions for various soil health indicators using samples from the Mid-Atlantic, Midwest, and Northeast U.S. regions.

The CASH scoring system assigns scores based on the percentage of samples with equal or lower values. For example, a score of 80% means your result is better than 80% of the reference dataset (Fig. 1). The system also accounts for soil texture, recognizing its role in influencing and sometimes constraining soil health outcomes.

Color ranges on the chart help evaluate whether soil health values differ significantly. Substantial improvements over time can shift soil into better color zones, with dark green zone indicating the soil has likely reached its potential. Though other rating and benchmarking frameworks have been proposed, we based our scoring system for California vineyards on the CASH framework, given its simplicity and clarity.

Rating Curves for California Vineyards
To develop scoring functions for California vineyards, we collaborated with winegrape growers who provided soil samples from vineyard blocks of red varietals. These blocks included those that had adopted cover cropping, compost application and no till or grazing for at least five years as well as blocks where none of these practices had been adopted for at least 10 years. Soil samples were collected from areas next to the vine and at the center of the drive rows. Additionally, growers completed a detailed survey about their practice implementation.

The dataset includes a total of 87 vineyard blocks (Fig. 2), with various combinations of practice adoption, ranging between 0 and 27 years. Thus, the scoring functions represent how soil health values may improve with the adoption of regenerative practices across a broad range of soil types and microclimates (Fig. 3).

Figure 3. Soil health scoring functions for soil organic carbon (SOC), mineralizable carbon (MinC) and aggregate stability index (ASI) for California vineyard soils

Like other frameworks, our scoring functions account for soil texture. Clayey soils are known to store more carbon and support greater microbial activity compared to sandier soils. Consequently, coarse-textured soils achieve high scores at lower SOC and MinC values than fine-textured soils. For ASI, values trend higher in coarse-textured soils because they are less prone to dispersion when slaked.

Comparing the ranges of SOC, MinC and ASI in our study to those reported in the literature supports the idea that building soil health may face more biophysical limitations in mediterranean regions compared to temperate climate zones. This highlights the importance of developing scoring functions tailored to specific regions and crops.

Monitoring Soil Health for Adaptive Management
For soil health scoring systems to be useful for growers, they must be sensitive to changes in management practices within an operation. To test this, we compiled individualized reports for each participating grower and evaluated whether the scoring system could detect differences in management history among samples from the same grower (Fig. 3).

The study involved 12 growers, each providing samples from 2 to 17 vineyard blocks. Overall, the scoring system successfully identified differences between vineyard blocks submitted by the same grower. Growers reported the scores either reinforced their management goals or highlighted areas where soil health management fell short of their targets. These findings demonstrate the soil health assessment framework can effectively support adaptive soil management in vineyards (Fig. 4).

Figure 4. Anonymized grower report example. Soil health ratings are greater in the vineyard blocks with adoption of multiple practices compared to vineyard blocks with only cover crops.

Successful Paths to a Healthy Vineyard Soil
Adopting soil health practices, such as cover cropping, composting, reduced tillage and grazing, involves costs and uncertainties, often with unclear timelines for measurable impacts. We used quantitative comparative analysis to explore conditions leading to soil health scores above 60%, revealing complex causal relationships.

Long-term cover cropping (10+ years) emerged as the most important factor for achieving high soil health scores, especially when combined with another regenerative practice. This benefit extended across the vineyard floor, improving soil health in both alleys and under-vine areas. Notably, the integration of livestock was identified as a key practice for accelerating soil health improvements, yielding measurable benefits even after less than 10 years of cover cropping.

Achieving high ASI and MinC scores appeared to require long-term adoption of more practices compared to high SOC scores. However, our findings suggest tailoring the right combination of practices to specific environmental conditions is more important than simply increasing the number of practices used.

Practical Implications for Vineyard Managers in California
Our study provides proof-of-concept for the use of SOC, MinC and ASI to evaluate vineyard soil health in California, supported by practical soil health scoring functions. This approach can help monitor vineyard soil health and inform adaptive management strategies. Given the variability of soil type and microclimate, growers are encouraged to experiment with different strategies to determine what works best for their conditions. While monitoring can identify effective practices, building soil health is a slow process that often takes over a decade. This underscores the need for long-term commitment, with monitoring intervals every few years being sufficient.

Winegrape growers can use our rating curves as a reference to monitor soil health. For SOC testing, ensure that labs report SOC specifically, rather than total carbon, especially in calcareous soils where high carbonates can skew results. Many labs also offer MinC (soil respiration) testing; our scoring functions are applicable as long as results are expressed in mg CO₂-C kg¹ soil d¹, regardless of preparation or incubation duration (one to four days). For ASI, only results obtained using the Soil Health Institute’s SLAKES test are compatible with our scoring functions. Growers can work with labs that use SLAKES or measure ASI in-house via the SLAKES app available at soilhealthinstitute.org/our-work/initiatives/slakes/.

Future Work
The scoring functions in our study are based on data from 87 vineyard blocks and reflect the progression in soil health scores that may occur over time with the implementation of a soil health management strategy. As more data becomes available, these scoring functions could be refined further to address specific soil types or microclimates.

Since the effectiveness of soil health management practices depends on factors like implementation (e.g., cover crop species, compost type, etc.) as well as soil type and environmental conditions, future research should focus on identifying the most effective combinations of practices for specific contexts.

Finally, soil health is rarely a management goal on its own. Future research should quantify the impact of improved soil health on key agronomic and environmental outcomes, including yield, grape quality, pest and disease pressure, pollution from leaching and runoff, biodiversity and climate change adaptation and mitigation.

This project was funded by the CDFA Specialty Crops Block Grant and the Foundation for Food and Agriculture Research. We thank all growers who participated in this study.

References
Hughes, H. M. et al. Towards a farmer-feasible soil health assessment that is globally applicable. Journal of Environmental Management 345, 118582 (2023).

Feeney, C. J. et al. Development of soil health benchmarks for managed and semi-natural landscapes. Science of The Total Environment 886, 163973 (2023).

Bünemann, E. B. Soil quality – A critical review. Soil Biology and Biochemistry 120, 105–125 (2018).

Shi. Recommended Measurements for Scaling Soil Health Assessment. (2024).

Fine, A. K., van Es, H. M. & Schindelbeck, R. R. Statistics, scoring functions, and regional analysis of a comprehensive soil health database. Soil Science Society of America Journal 81, 589–601 (2017).

Moebius-Clune, B. N. et al. Comprehensive Assessment of Soil Health – The Cornell Framework Manual. (2016).

Maharjan, B., Das, S. & Acharya, B. S. Soil Health Gap: A concept to establish a benchmark for soil health management. Global Ecology and Conservation 23, e01116 (2020).

Six, J., Doetterl, S., Laub, M., Müller, C. R. & Van de Broek, M. The six rights of how and when to test for soil C saturation. SOIL 10, 275–279 (2024).

Müller, T. & Höper, H. Soil organic matter turnover as a function of the soil clay content: consequences for model applications. Soil Biology and Biochemistry 36, 877–888 (2004).

Nunes, M. R. et al. SHAPEv1.0 Scoring curves and peer group benchmarks for dynamic soil health indicators. Soil Science Society of America Journal 88, 858–875 (2024).

Fajardo, M., McBratney, Alex. B., Field, D. J. & Minasny, B. Soil slaking assessment using image recognition. Soil and Tillage Research 163, 119–129 (2016).

Slakes: A Free Smartphone App to Measure Aggregate Stability. Soil Health Institute (2024). https://soilhealthinstitute.org/our-work/initiatives/slakes/#overview

Citrus Dry Root Rot Caused by Fusarium solani: A Persistent Threat to California Citrus

Figure 1. Dry root rot disease in lemon orchard planted on Carrizo in Santa Paula. a) Lemon trees with yellow foliage; b) impacted crown, roots and vascular system and usually abundant fruit fallen over from dry root rot; c) wilted dead tree.


Dry root rot, caused by the soilborne fungus Fusarium solani, has been a persistent threat to California citrus for decades. While the disease has been preent in citrus orchards for many years, it became particularly problematic following wet winters in the 1960s and 1980s. During these periods, the disease affected both young and mature trees, especially those on susceptible rootstocks and in poorly drained soils. However, the threat of dry root rot persists today, posing an ongoing challenge to California’s citrus industry.

Fusarium solani
F. solani is a weak pathogen that requires a weakened host to cause significant damage. Factors like stress from other pathogens, nutrient deficiencies or environmental stressors can predispose citrus trees to infection. For example, Phytophthora root rot can weaken trees, making them more susceptible to F. solani attack. Trees planted as bare-root seedlings exhibited higher resistance to dry root rot compared to container-grown trees. However, fumigation prior to planting was associated with reduced disease incidence. Several factors can contribute to the development of dry root rot in citrus; a combination of environmental and host factors can predispose citrus trees to Fusarium solani infection. Periods of drought or excessive moisture can weaken trees, making them more susceptible to disease. High temperatures can exacerbate symptoms and promote fungal growth. Poor soil drainage and nutrient imbalances can further compromise tree health. Host factors also play a significant role. Certain rootstocks may exhibit greater susceptibility to F. solani infection compared to others. Older trees with declining vigor may be more prone to infection. The virulence of specific F. solani strains and the level of inoculum present in the soil can influence the severity of disease outbreaks. By understanding these complex interactions, growers can implement targeted management strategies to mitigate the impact of dry root rot on their citrus orchards.


Figure 2. Frequency of Phytophthora and Fusarium species isolated from citrus nurseries in California.

Finding the Cause
A comprehensive soil analysis was conducted to assess potential correlations between soil properties and disease incidence. Parameters, such as sodium, boron, salinity, pH and soil type, were evaluated. However, no significant correlations were found between these factors and disease severity. This suggests soil conditions, while important for overall tree health, may not be a primary factor in predisposing trees to dry root rot. Leaf tissue analysis revealed elevated levels of zinc and manganese in diseased trees compared to healthy trees. Additionally, potassium deficiency was observed in diseased trees. However, it is unlikely these nutrient imbalances are the primary cause of the disease. Rather, they may be secondary symptoms resulting from the stress caused by the fungal infection.

F. solani primarily targets the root system, causing a gradual decline in tree health. Infected roots exhibit a characteristic reddish-purple to grayish-black discoloration, which distinguishes it from Phytophthora root rot, which typically affects the outer root bark. This discoloration can extend into the trunk, leading to internal wood decay and external bark discoloration. Aboveground symptoms include leaf yellowing, premature defoliation, twig dieback and reduced fruit yield. In severe cases, trees may suddenly collapse, even with leaves still attached (Fig. 1). 

In the past year, we’ve received numerous reports of healthy lemon trees suddenly wilting and collapsing in Santa Paula, Ventura, and the Central Valley. Upon digging, the root system revealed black, purple or grayish roots with a brown, vascular discoloration. Leaves turned yellow, then brown, with rapid dieback and wilting. Surprisingly, all tree collapses due to dry root rot occurred primarily on lemon trees planted on Carrizo citrange rootstock. Adjacent lemon blocks on Trifoliate or C-35 rootstocks remained unaffected despite similar management and environmental conditions. These observations led to two hypotheses:

1. Nursery contamination: Multiple sources in nurseries (plants, soil and water) pose a high risk for spreading citrus dry root rot, potentially leading to outbreaks in home gardens and commercial orchards.

2. Rootstock susceptibility: Rootstocks like Carrizo citrange are more susceptible to dry root rot caused by Fusarium solani and Phytophthora species compared to Trifoliate and C-35.

Nurseries can serve as reservoirs for soilborne pathogens like Fusarium and Phytophthora. Infected plant materials, contaminated soil and water sources can harbor these pathogens and facilitate their spread to new orchards. While F. solani is primarily associated with the disease, other fungal pathogens may also be involved. Extensive sampling, identification, pathogenicity testing and characterization of fungal pathogens in all potential nursery sources are essential. In our comprehensive survey of California citrus nurseries, we collected soil, root and water samples. Following rigorous isolation procedures, we identified four key pathogens: F. solani, F. oxysporum, Phytophthora nicotianae, and P. citrophthora. Among these, F. solani was the most prevalent species isolated from nursery samples (Fig. 2).

Morphological examination revealed distinct characteristics for each fungal genus (Fig. 3). These findings emphasize the critical need for stringent sanitation practices and effective disease management strategies within nursery operations to prevent the dissemination of these harmful pathogens.

Selecting a healthy, Fusarium- and Phytophthora-tolerant rootstock is crucial for establishing new orchards as it provides tolerance to the entire plant. Resistant rootstocks play a major role in integrated disease management. Our research is developing an integrated strategy to manage dry root rot and Phytophthora root rot diseases in citrus nurseries and groves. Using resistant rootstocks is a promising approach to combat both diseases. If pre-invasion by Phytophthora is shown to increase dry root rot occurrence, current control methods for Phytophthora could potentially reduce dry root rot incidence in citrus production.

Figure 3. Morphological characteristics of representative species isolated from citrus nursery samples of root tissue and soil belonging to Fusarium and Phytophthora spp. Fusarium colonies were subcultured on potato dextrose media (PDA), while Phytophthora colonies were grown on V8 juice agar. The front (a) and back (b) of media plates were photographed. Under 40x total magnification, multiseptated, oval/kidney-shaped F.solani (c) and multiseptated, oval/kidney-shaped with sharp end on both side F.oxysporum (d) mycelia of Phytophthora spp. under 40X magnification (e, f).

Disease Management Strategies
To effectively manage dry root rot, it is crucial to implement integrated pest management strategies. These may include careful selection of disease-resistant rootstocks, proper irrigation and fertilization practices and the use of fungicides to protect young trees. Additionally, maintaining good orchard sanitation and avoiding excessive soil moisture can help minimize the risk of infection.

Effective management of citrus dry root rot requires a multi-faceted approach. Key strategies include:

1. Disease-free planting material: Sourcing disease-free planting material from reputable nurseries is crucial to prevent the introduction of pathogens into orchards.

2. Soil solarization: Solarizing the soil before planting can help reduce populations of soilborne pathogens, including F. solani.   

3. Cultural practices: Proper irrigation, fertilization, and pruning can enhance tree vigor and reduce susceptibility to disease.

4. Chemical control: Fungicide applications can help manage the disease, but it is important to follow label instructions and rotate fungicides to prevent the development of resistant strains.

5. Biological control: The use of beneficial microorganisms, such as Trichoderma spp., can help suppress the growth of F. solani and other pathogens.   

By implementing these strategies, citrus growers can mitigate the impact of citrus dry root rot and maintain healthy, productive orchards.

Finding New Insecticides for Use in California Safflower Supported by the IR-4 Program

Figure 1. Safflower growing as a seedling (top left), in the branching stage of late vegetative growth (top right), and well after flowering (bottom).

Safflower is an oilseed crop with several important uses beyond the valuable oil produced from the harvested seeds (Fig. 1). In the Tulare Lake Basin of the southern San Joaquin Valley in California, safflower is often grown in rotation with processing tomato and cotton. The benefits to the soil that safflower provides to the other crops comes largely from the exceptionally deep taproots that the plant grows, which are highly tolerant of saturated soil conditions. Safflower grown exclusively on residual water from a single preplant irrigation in the winter will draw down a perched water table, which cotton and tomato are sensitive to. Additionally, the taproots of the crop also create deep flow channels for improved water infiltration later in the year which greatly helps with any leaching efforts to remove accumulated salts from the root zone of cotton and tomato planted later.

Aside from the soil and water benefits to cotton and tomato, safflower also plays a key role in pest management in adjacent cotton and tomato fields. Insect pests, such as lygus bug and stink bugs, which are serious pests in tomato and cotton, and beet leafhopper, which transmits Beet Curly Top Virus to tomato, are all found in safflower. As safflower starts growing as early as February, it’s often the only green vegetative plants through April before cotton and tomatoes are planted. That means these insect pests show up on safflower first, and in that vein, safflower acts as an early indicator of the pressures these insects may pose for the upcoming cotton and tomato planted nearby. As cotton and tomato grow early in their seasons and become susceptible to damage from these pests, monitoring of these insect populations in safflower becomes very important to make decisions about areawide insect pest management. To that end, safflower acts as a sort of trap crop for these pests as growers can then treat safflower fields for these insects before they reach development stages and population levels that promote migration into tomato and cotton. This preventative monitoring and treatment in safflower improves pest management success in tomato and cotton by reducing the flow of the pests into these crops, which can then reduce the number of insecticide applications needed in cotton and tomato and preserve those uses for later in the season should they be needed.

Insecticide Trials
Since 2018, we’ve conducted insecticide efficacy and crop safety trials in safflower for control of lygus, stink bugs and beet leafhopper. We compared how well these new insecticides controlled these pests and observed the safflower plants for symptoms of damage from the new insecticides. The purpose of the trials was to generate enough data that is required by the California Department of Pesticide Regulation to show the insecticides meet the state’s standards for being registered for use in safflower. In our trials, we compared the new insecticides to plots in the field that had no insecticide treatment as well as plots treated with the local growers’ standard insecticide treatment.

The insecticides studied were cyclaniliprole (Harvanta 50 SL) in two trials from 2018-19 (Table 1) and acetamiprid (Assail 30 SG) in two trials both in 2020 (Table 2). In trials for both insecticides, the experimental plots were treated three times during the season following the grower’s standard retreatment intervals for their standard treatment. In some of the select data provided, you’ll see pest control patterns for lygus and beet leafhopper. We never observed enough stink bugs in any of the trials to make conclusions about how well these insecticides worked in safflower.

In the 2019 cyclaniliprole trial, we saw good efficacy against lygus nymphs, the juvenile stage of the insect. However, we didn’t observe obvious control with the new insecticide compared to the untreated control until two weeks after the second treatment and then throughout the evaluation period after the third treatment application (Fig. 2). The grower standard treatment during this same time performed better than the cyclaniliprole treatments in controlling lygus nymphs. We never observed any crop injury related to applications of the cyclaniliprole treatments. These observations together supported the registration of Harvanta 50 SL for use in safflower in California, meaning safflower growers can now use this product in the state.

In one of the 2020 acetamiprid trials, we saw good efficacy against beet leafhoppers. Control of beet leafhoppers was significantly better than the untreated control after each of the three treatments, but this usually lasted for only a week (Fig. 3). The acetamiprid performed similarly to or better than the grower standard control throughout the trial. We didn’t observe any crop injury effects from acetamiprid applications to safflower during the trial. These data are currently being evaluated for registration of Assail 30 SG in California to be used in safflower.

These new insecticides can provide valuable tools to safflower growers in California, not just for managing insect pests in safflower but also for managing pests that may migrate into neighboring cotton and tomato crops. The work done in these trials is supported by efforts put forward by local safflower growers and the pesticide manufacturers. The IR-4 project financially supports and coordinates the trials and product label registration efforts.

Figure 2. Three subsequent cyclaniliprole treatments effect on lygus nymphs. Nymph counts were the number of insects per sample, which was 50 sweeps using a net. Red vertical lines represent when the retreatments occurred. “DAT” means days after treatment.

The IR-4 Project
Since 1963, the IR-4 project continues to serve the specialty crop industry by increasing pest management solutions for growers while securing healthy food safe for consumption.

IR-4 specialty crops include fruits, nuts, herbs and vegetables recommended for a healthy diet as well as flowers, trees and shrubs that enhance our environment. It’s no mystery in today’s world consumers demand high-quality produce and plants. Managing harmful insects, weeds and diseases are difficult tasks for today’s growers given current pest populations, exotic and invasive species, resistance management, regulatory restrictions, residue mitigation, organic food production and many other challenges. Access to integrated pest management (IPM) tools are essential for food security and human health.

The mission of IR-4 is to facilitate regulatory approval of sustainable pest management technology for specialty crops and specialty uses to promote public well-being. The label is the law, and IR-4 works in label expansion for the safe, legal and effective use of biological and conventional pesticides. On a national level, IR-4 works with producers, growers, stakeholders, academics and extension agents to identify pest management needs and potential solutions.

IR-4 stands for Interregional Research Project #4; a bit of a mouthful, but a relic of it’s past. Label expansion can be quite cost-prohibitive, with registration fees today reaching the six- and seven-figure level at times. Prior to 1950, pest control options like those registered in large acreage crops (wheat, corn, soybean, etc.) were not available to specialty crop growers due to these costs. Furthermore, minor use patterns on major crops left a deficit to grower needs. This dilemma was coined the “Minor Use Problem.” In the late 1950s, State Agricultural Experiment Station (SAES) directors, university extension agents and USDA recognized the need to develop processes for registering pesticides for use on specialty crops and minor uses on major crops. As a result, in 1964, an Interregional Research Project #4 titled, ‘Evaluation of Current Data and Needed Research to Determine Tolerance Limits of Chemicals for Minor Uses on Agricultural Products,’ was created. Now, if registrants go through IR-4, registration fees are waived and the necessary research is funded, provided the request comes from the public (growers, academics) and the use fits into an IPM strategy.

Figure 3. Three subsequent acetamiprid treatments effect on beet leafhoppers. Leafhopper counts were the number of insects per sample, which was 50 sweeps using a net. Red vertical lines represent when the retreatments occurred. “DAT” means days after treatment.

Today, the IR-4 Project operates as a unique partnership between USDA (both the National Institute of Food and Agriculture (NIFA) and the Agricultural Research Service (ARS)), SAES, the EPA, the plant protection materials industry, commodity groups and growers. In recent years, additional partnerships formed with USDA-Foreign Agricultural Service supporting international specialty crop export activities, Animal Plant Health Inspection Service working on selected invasive species, the Department of Defense’s Deployed Warfighter Protection Program providing regulatory support for public health pesticides, and CDFA.

IR-4 is constantly evolving to meet the needs of producers and consumers by providing tools for IPM and collaborating in global harmonization of residue levels. The Integrated Solutions Program focuses on research areas like pest problems without solutions, resistance management, residue mitigation and organic food production. The Biopesticide Regulatory Support Program furthers the development and registration of biopesticides by providing regulatory assistance to public-sector scientists and small businesses navigating the EPA registration process. The Environmental Horticulture Program focuses on invasive species and pollinator protection. International efforts include harmonizing crop groups and maximum residue levels to reduce trade barriers for U.S. producers.

Research requires funding; therefore, IR-4 is funded by USDA-NIFA and CDFA and receives in-kind contributions from SAES, U.S. EPA, the crop protection industry, Canada and commodity associations.

Headquartered at North Carolina State University, IR-4 has regional facilities at University of Florida, University of Maryland Eastern Shore, Michigan State University and UC Davis. There are also liaisons in every state working with local growers to identify safe and effective solutions for pest management. IR-4 research takes place at many land grant universities and USDA-ARS facilities across the country.

If you would like to get involved, please contact Kari Arnold, based in UC Davis, at (530) 574-9181 or klarnold@ucdavis.edu.

My Career as a Certified Crop Advisor: A Retrospective

Jerome Pier (left) co-authored the 10th edition of the Western Fertilizer Handbook, one of the many highlights of his career. Pier believes it is a CCA’s job to bring the knowledge to the table required to meet California’s nitrogen management needs.

I will never forget my introduction to the miracle of agriculture in California’s Central Valley. I interviewed for an agronomist position for Netafim Irrigation in Fresno in June 1995. I was finishing my USDA post-doctoral job at the University of Lincoln, Nebraska and was tired of researching corn and soybeans. After my interview, they suggested I take my rental car on a tour around the Valley. I first drove to the Westside and was amazed at the variety of crops being grown, such as cotton, melons, alfalfa, fruit and nut trees, tomatoes, winegrapes and many others I didn’t recognize. After lunch, I looked to the east and was drawn to the snow-covered Sierras. I drove up highway 168 to Shaver Lake, the source of irrigation water for many of the crops I saw earlier in the day. I couldn’t believe that someone would pay me to live and work in an agronomist’s dream world. I accepted Netafim’s offer without hesitation.

Now that I have decided to retire, I am looking back at how California agriculture has changed from my first visit, and I wonder what lies ahead.

Start of the Journey
My career has allowed me to travel to growers’ fields throughout California and the Western U.S. When I started work in 1995, cotton and alfalfa were being grown on 3.3 million acres with only 400,000 acres of almond, 650,000 acres of grape and 60,000 acres of pistachio. Almond yields averaged around 1,000 lb/acre and growers were grossing around $2,000/acre. Citrus acreage was dominated by oranges with only 8,000 acres of mandarins. Sweet cherries were mainly grown in northern California with a few orchards in Tulare County. Processing tomatoes were grown on over 300,000 acres, and average yields were around 33 tons/acre. There were no blueberries being grown in California. Winegrapes were all grown on AxR 1 rootstock and growers were pulling out vineyards infested with phylloxera and replanting with new, less susceptible rootstocks. Winegrape growers invested in drip irrigation systems when they replanted their vineyards. Most growers fertilized with nitrogen once or twice a season and little else. Crops were irrigated by flooding or sprinklers. A few growers were experimenting with using drip irrigation in orchards and were deciding if they could get by with just a single drip line or would require two lines. Some growers were experimenting with buried drip irrigation in field crops. Buried drip asparagus was an early success in Firebaugh. Finally, the CCA program was just getting started with only a few hundred in California.

I became a CCA in 2003 soon after I became the Central Valley division agronomist for Western Farm Service. The exams were in-person and given four times a year in a few locations. The CCA program was challenged by attracting new members. With most consultants obtaining their PCA license and taking tests to qualify for different pest and disease categories, studying for a new program focused on agronomy and plant health was daunting. However, advisors that spent the time to obtain a CCA certification added to their skillset and knowledge of the multiple crops grown in California. 

Nearly 30 years later, California agriculture has changed significantly. California crops are still highly diversified, and production values outrank the next largest state by an order of magnitude. Permanent crops now dominate the landscape, especially tree nuts like almond and pistachio, which respectively now cover 1.3 million acres and 460,000 bearing acres. Almond yields are more than double what they were in 1995, and many growers feel they must achieve 3,000 lb/acre yields to remain profitable. Cotton, now predominantly Pima, is grown on approximately 166,000 acres. Alfalfa grows on 500,000 acres, about half of the acres in 1995. Mandarin acres are 10 times what they were in 1995. Sweet cherries are now found in Kern County to capture the early market, and the Bing variety is being replaced by newer, earlier harvested varieties. Nearly all processing tomatoes are grown with buried drip irrigation and yields have more than doubled. There currently are over 7,000 acres of blueberries grown in California. The number of winegrape rootstocks are bewildering. Asparagus is being grown by one or two producers with acreage so low it is not reported. Drip irrigation predominates over nearly every acre of crops produced. Most growers are split applying liquid fertilizers through their drip systems. Fertilizer programs are based on balanced blends containing nearly all plant-essential nutrients, both macro and micro. Many growers claim to be applying much less nitrogen fertilizer and getting much higher yields than they did in the past due to the efficiency of application of microirrigation.

Jerome Pier (stage) was previously chair of Western Region Certified Crop Advisors Board of Directors and has been a mainstay at multiple consultant meetings over the years (photo by Kristin Platts.)

In 2012, The Harter Report was published at the request of the California legislature. The report performed a mass balance accounting of nitrogen in two watersheds that were vulnerable to nitrate pollution of groundwater, the Salinas Valley and Tulare Lake Basin. The report determined nitrogen fertilizer was being overapplied and unaccounted-for nitrogen could potentially end up in drinking water. This report eventually led to growers having to complete Irrigation and Nitrogen Management Plans (INMP) to examine how farming practices might impact groundwater quality. It was from this point forward the Western Region CCA program acquired new members at a rapid pace to become the largest regional program in the world. CCAs who took a course on nitrogen management were qualified to sign grower INMPs. The Western Region CCA program continues to maintain a strong membership while other regions in the U.S. are struggling. I have always felt being a CCA elevates a consultant to a higher level of service to their grower-customers. For California agriculture to continue to farm sustainably, a holistic approach is needed, and the CCA brings that expertise to the farm.

Future Challenges
As I look to the future of California agriculture, I see the biggest challenge being irrigation management. A great deal of attention is paid to how growers are applying fertilizer, but it is very difficult to encourage growers to improve their irrigation practices. I feel this challenge is due to growers receiving an invoice for their fertilizer but considering water to be their personal resource. It is quite challenging to understand water movement underground and how much water crops require to be fully productive. Many growers manage water based on hours of irrigation and do not consider the volume of irrigation being applied. Most crop advisors, I feel, are hesitant to comment if they see a grower’s irrigation practice is not appropriate for fear of liability. I feel the CCA program brings soil, water and nutrient management tools to bear on this complicated issue. Our strong and well-respected Western Region CCA program gives me hope that California will continue to sustainably produce a cornucopia of the world’s food and fiber for many years to come.

The Role of Precision Agriculture in Optimizing Orchard Water Management in California

Figure 1. Eddy covariance flux tower equipped with key instruments. A net radiometer on the left for measuring radiation balance, a gas analyzer and sonic anemometer at the center for monitoring gas exchange and wind speed, and the new LI-710 ET sensor on the right for measuring evapotranspiration.

California’s orchards are an agricultural marvel, producing an incredible variety of fruit and nut crops that are enjoyed across the nation and around the world. From the sprawling almond and pistachio orchards of the Central Valley to citrus and stone fruits in coastal regions, growers rely on sustainable management of resources to maintain productivity. Among these resources, water stands as the most critical and increasingly scarce resource. With multi-year droughts, increasing water regulations and growing competition for water resources, the efficient use of water has become a cornerstone of sustainable orchard management.

In this context, precision agriculture offers a path forward. By employing advanced monitoring technologies and data-driven approaches, growers can achieve a level of irrigation management that was previously unimaginable. Precision agriculture enables growers to optimize water application by delivering the right quantity at the right time and in the right place where it is most needed. This targeted approach to irrigation not only improves water use efficiency but also enhances tree health, reduces costs and minimizes the environmental impact of agricultural operations.

Understanding Orchard Water Use with Advanced Tools
One of the key tools in precision agriculture is the eddy covariance system (Fig. 1). This advanced technology measures the exchange of water vapor and carbon dioxide between the orchard and the atmosphere. By providing real-time data on evapotranspiration (ET), the combined loss of water from the soil and plants, eddy covariance systems help growers understand exactly how much water their orchard is using at any given moment.

This information is crucial for designing irrigation schedules that align water delivery with the actual needs of the trees. Such a tool is particularly valuable in large orchards, where water requirements can vary significantly across the field due to differences in soil type, tree age or microclimatic conditions. Previously, eddy covariance systems were too expensive and complicated to be integrated in commercial irrigation applications. However, recently, the new ET sensor, LI-710 (shown on the right in Fig. 1), has become available, providing similar data and functionality for growers at a lower cost compared to the traditional eddy covariance systems.

Monitoring Tree and Soil Water Status for Optimal Irrigation
Complementing the eddy covariance system are ground-based monitoring tools like sap flow sensors and soil moisture sensors (Fig. 2). Sap flow sensors are installed directly on the tree trunks to measure the movement of water through the xylem, providing a direct indication of how much water the tree is using. Meanwhile, soil moisture sensors (Fig. 2) measure the volumetric water content of the soil, providing information about the amount of water stored in the soil. In contrast, soil water potential sensors measure the energy which water is being held in the soil, offering insights into the availability of water for plant uptake. Both types of sensors are valuable for optimum irrigation management.

Together, these tools give growers a detailed picture of the water status in their orchards, from the soil to the trees and into the atmosphere. For example, soil water potential sensors can indicate when the soil is too dry for tree roots to extract water, signaling the need for irrigation. Conversely, sap flow measurements can help growers avoid over-irrigation, which not only wastes water but can also lead to problems like nutrient leaching and waterlogging of the root zone.

Comparing Irrigation Strategies for Better Decision-Making
The benefits of precision irrigation become especially clear when evaluating various irrigation strategies. Figure 3 presents the comparative outcomes of two irrigation methods: full irrigation and deficit irrigation.

In the full irrigation treatment, trees received enough water to meet their entire evapotranspiration demand, ensuring optimal growth conditions. Soil moisture levels in this treatment remained stable throughout the season, with trees maintaining high transpiration rates and minimal water stress. This approach is ideal for maximizing productivity, but it also requires a significant amount of water, which may not be sustainable during drought years or under strict water allocation limits required under the Sustainable Groundwater Management Act in some regions of California.

In contrast, the deficit irrigation treatment deliberately imposed mild water stress on the trees by providing less water than their full evapotranspiration demand. This strategy resulted in lower soil moisture levels and reduced transpiration rates. However, the trees were still able to maintain reasonable productivity levels, demonstrating deficit irrigation can be a viable strategy for conserving water without sacrificing too much yield.

The choice between these two approaches depends on growers’ specific circumstances, including water availability, crop type and economic considerations. For many growers in the Central Valley, deficit irrigation offers a practical way to reduce water use while maintaining orchard productivity during challenging conditions such as multi-year droughts.

Figure 2. Installation of soil moisture sensors, soil water potential sensors and sap flow sensors in a pistachio orchard near Madera, Calif. The sap flow sensors are attached to the tree trunks and covered with aluminum foil while the soil sensors are installed below ground at depths of 30 cm and 60 cm. Data collection was managed using a data logger with power supplied by a battery connected to a solar panel.

Adapting Irrigation Practices to Orchard Conditions
In practice, implementing precision irrigation requires more than just installing sensors and collecting data. It requires incorporating this information into a comprehensive management plan customized to the specific conditions and needs of each orchard. Trees in sandy soils, for example, may require more frequent but smaller irrigation events, while those in clay soils may benefit from less frequent but deeper water applications. In a similar manner, young trees with limited root systems often have water requirements that differ from those of fully grown trees.
Precision agriculture tools can help growers account for these differences and tailor their irrigation practices to meet the specific needs of their orchards. By combining real-time data with an understanding of soil and tree dynamics, growers can create irrigation schedules that maximize water use efficiency and optimize tree health.

Economic and Environmental Benefits of Precision Irrigation
The economic benefits of precision irrigation are significant. Efficient water usage allows growers to lower both their water expenses and the energy costs linked to pumping. In addition, healthier trees that receive the right amount of water are more productive and less susceptible to diseases, resulting in higher yields and better-quality fruit or nuts. These advantages can help compensate for the upfront costs of precision agriculture technologies, making them a valuable long-term solution for growers.

Beyond the economic benefits, precision irrigation also has important environmental implications. By reducing overirrigation, growers can minimize the risk of nutrient leaching, which occurs when excess water carries fertilizers beyond the root zone and into groundwater or surface water bodies. This not only helps protect water quality but also reduces the need for additional fertilizer applications, saving both money and resources. Furthermore, by conserving water, growers can reduce their overall water footprint, contributing to the sustainability of California’s agricultural sector.

Figure 3. Comparison of soil moisture content, soil water potential and transpiration efficiency (T/ET) under full irrigation (top) and deficit irrigation (bottom) treatments in a pistachio orchard near Woodland, Calif. Volumetric water content (VWC) and soil water potential (SWP) are displayed for 30- and 60-cm depths along with transpiration efficiency data from two field treatments (FT1 and FT2 for full irrigation, DT1 and DT2 for deficit irrigation) (Peddinti and Kisekka 2025).

Overcoming Challenges and Looking Ahead
The adoption of precision agriculture is not without its challenges. For many growers, the upfront cost of purchasing and installing advanced monitoring equipment can be a barrier. Furthermore, understanding and utilizing the data generated by these tools often involves a learning curve, as growers adapt it to their daily management practices. However, as more growers adopt these technologies and share their experiences, the knowledge base around precision irrigation continues to grow, making it easier for others to follow suit.

Educational initiatives and outreach programs are essential for encouraging the adoption of precision agriculture practices. Workshops, field days and demonstration projects can help growers see these technologies in action and understand their potential benefits. Collaborations between researchers, industry stakeholders and growers are essential for developing practical solutions that address the real-world challenges faced by California’s orchard managers.

Precision Agriculture as a Long-Term Solution
Looking to the future, precision agriculture is likely to become even more sophisticated with the integration of artificial intelligence, machine learning and advanced data analytics. Predictive models that use data from eddy covariance systems, sap flow sensors and soil moisture probes could provide growers with real-time recommendations for irrigation scheduling, taking the guesswork out of water management. Similarly, remote sensing technologies, such as drones and satellite imagery, could complement ground-based monitoring tools by providing a broader perspective on orchard health and water use.

As these technologies continue to evolve, they will play an increasingly important role in helping California’s growers navigate the challenges of water scarcity and climate change. By embracing precision agriculture, orchard managers can ensure the long-term sustainability of their operations while maintaining California’s position as a global leader in fruit and nut production.

References
Peddinti, S. R., Gordon, P., Oker, T., Marino, G., and Kisekka, I., 2025. Evaluating transpiration efficiency and soil moisture dynamics under varying irrigation regimes. Under preparation.

-Advertisement-