PyGanic® Crop Protection is a botanically derived, organic contact insecticide that delivers quick knockdown of a broad spectrum of hard-to-kill insect pests across a wide variety of crops. PyGanic is OMRI listed and fits into any cropping system including organic, sustainable and conventional production. Visit Valent.com/PyGanic for more information.
Delayed Spring Growth and Grapevine Production During Drought
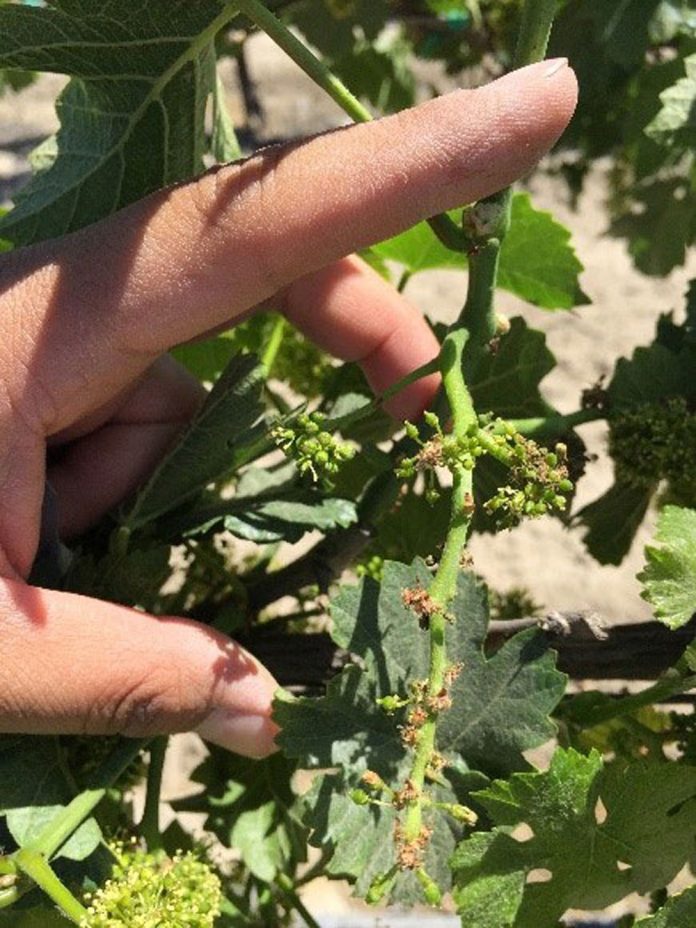
After 2021 grapevine budbreak, we received many calls about dead spurs, delayed bud break, stunted shoot growth and poor fruit set. In Fresno County, some severely impacted vineyards suffered a substantial yield loss. In many cases, the problem was delayed spring growth (DSG), and the classic vine symptoms include:
- Delayed and erratic bud break
- Stunted shoot growth
- Excessive berry shatter and poor fruit set
The situation was apparently spread across different grape growing regions in California, and UC Davis Department of Viticulture and Enology held a virtual grower meeting to discuss it (the recorded presentation can be found on the UC Davis AggieVideo website.)
Delayed Spring Growth
Grapevine DSG is associated with insufficient rehydration of the vines and may be due to vascular tissue injury, insufficient carbohydrate reserves, excessively dry soil over winter or some combination of these factors. Symptoms can result in significant yield loss and permanent vine damage, resulting in economic hardship for growers. Some vine DSG symptoms are similar to other pest/disease symptoms (e.g., vine trunk disease or soil pests like nematodes/phylloxera.) However, most vineyards we visited had little or no sign of trunk disease or soil pests. Several factors this past fall and winter contributed to widely observed and severe vineyard DSG symptoms:
- Ongoing drought and increasingly dry soils, especially over winter in vineyards which were not sufficiently irrigated postharvest, or during winter
- Warmer than normal fall temperatures, including a particularly warm October
- A sudden freeze in early November
According to CIMIS station data at Five Points, October 2020 was warmer than the last five years’ average and followed a sudden freeze event in November (Figure 1), and warmer-than-normal autumn is a risk factor for DSG. In addition to the November freeze event, October and November 2020 were mostly dry, and a drier autumn could make the freeze worse. Even though the minimal temperature of the 2020 winter might be lower than the last five years’ average according to the CIMIS station data, the DSG’s occurrence and severity varied significantly across vineyards in Fresno County and other parts of California.

Also, vineyard management, particularly postharvest and winter irrigation, could make a big difference on the results of DSG even if the ambient weather condition was similar. The geographic location as well as vineyard microclimate can sometimes mean quite different consequences in the face of freeze damage. Figure 2 illustrates the variation of daily minimum temperatures from five locations in Fresno County. Typically, vineyards located on the west side had a lower minimal temperature and suffered more freeze damage than vineyards located on the east side. Sand Ranch in particular had the lowest daily minimum temperature among five locations from October to March.

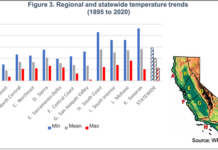
To make matters worse, Fresno County saw much less precipitation during the months of November and December 2020 than the last 20 years’ average (Figure 3). These drier months might offer the perfect conditions for DSG. Although precipitation amount was normal in January 2021, February was yet another dry month in comparison to historical averages. Lack of soil moisture before bud break is another major risk factor for DSG.

Grapevine winter freeze damage and DSG have similar symptoms and can be difficult to differentiate. Winter cold damage or freeze injury damages vascular tissues and can thus interfere with water, carbohydrate and mineral translocation, causing symptoms similar to DSG. A lack of soil moisture can impair vine rehydration, making vines suffer water stress and causing DSG symptoms directly. Additionally, vines might be more vulnerable to cold injury even though the minimal temperature in the past winter, such as 25 degrees F at Sand Ranch, might not cause significant freeze damage on most Vinifera grapes.
Maintain Vine Health
Vineyard conditions should be considered to avoid DSG and possible cold damage:
- Abiotic or biotic stressed vines (e.g., severe water stress and overcrop, nutrient deficiency, pest/disease)
- Young vines
- Late ripening and cold tender varieties
- Certain rootstocks, including Freedom and Harmony
- Insufficient soil moisture during the dormant period (e.g., October to March in the San Joaquin Valley)
Generally, maintain vine health over the growing season and assess soil moisture as the vines enter dormancy, watering if needed. Too many clusters with not enough leaf area can weaken the vines and deplete the trunk and root’s carbon reserves, which are needed to maintain respiration over winter, help prevent freezing and nourish the vines as they regrow in the spring. To maintain a functional vine canopy, irrigate as necessary to support photosynthesis without stimulating excessive growth. If pests or diseases are present in the vineyard, such as powdery mildew, nematodes, grapevine trunk disease, virus, mites and leaf hopper, a good assessment of canopy health is important. Grapevines with severe defoliation or small canopies will be of great concern, and management should focus on better addressing pest and disease problems to avoid early defoliation.
A young vine has its inherent nature of vulnerability due to a lack of sufficient carbon reserves. Therefore, severe water stress and overcropping should be avoided, and irrigating the soil before a freeze event (e.g., late October and early November) can be greatly beneficial to provide heat protection for young vines.
This past spring, we noticed some susceptible varieties might suffer greater damage from DSG, and that has been consistent with the reports from other growers. Chardonnay and Pinot gris have been reported frequently on DSG, although both varieties are also susceptible to winter freeze.
Rootstock can also play an important role in DSG. Certain rootstocks (e.g., 5BB and Freedom) are more susceptible to DSG than others (e.g., 1103 P), according to results of UCCE rootstock field trials in different growing regions of California. Thus, growers who have the susceptible rootstock might want to take extra care of the vines, such as irrigating the soil during the dry winter, so that the risk of potential DSG might be minimized.
Manage Soil Moisture
Last but not least, lack of soil moisture might be the most important yet manageable factor contributing to most DSG farm calls. As discussed previously, drier October, November, December and January months posed a great risk of DSG as well as inhibited rehydration of the vines, which can also lead to a greater risk of freeze damage. However, water availability during the drought years might be significantly reduced or expensive.
Therefore, irrigation during the drought years can become the dilemma. Growers need to balance the cost and reward of irrigation vs. no irrigation during drought years. Greater than 20% yield loss has been reported for some vineyards in Fresno County in 2021, and DSG might play a large role in it, although the record summer heat and seasonal variation could also result in loss. Finally, the consequence of DSG on Fresno vineyards varied greatly. Some vineyards appeared to be significantly stunted after budbreak and later fully recovered due to irrigation. Some vineyards might suffer multi-year yield loss due to the weakened canopy and few desired canes to prune.
In the face of upcoming potential drought, growers can use multiple tools to reduce or eliminate the effect of soil moisture deficit. Many tools (e.g., shovels, soil augers, moisture sensors) can provide great benefits for assessing soil moisture and help growers determine whether or not to irrigate. Weather stations can also provide great amounts of information regarding the minimal ambient temperature as well as the amount of local precipitation, since temperature and precipitation can vary greatly from one vineyard to another. UC IPM has seven weather stations in Fresno County and one station in Madera County in cooperators’ vineyards, and those stations can offer both temperature and precipitation amount, serving the growers whose properties are nearby the station.
A New Biocontrol Approach for the Reduction of Pierce’s Disease in Vineyards
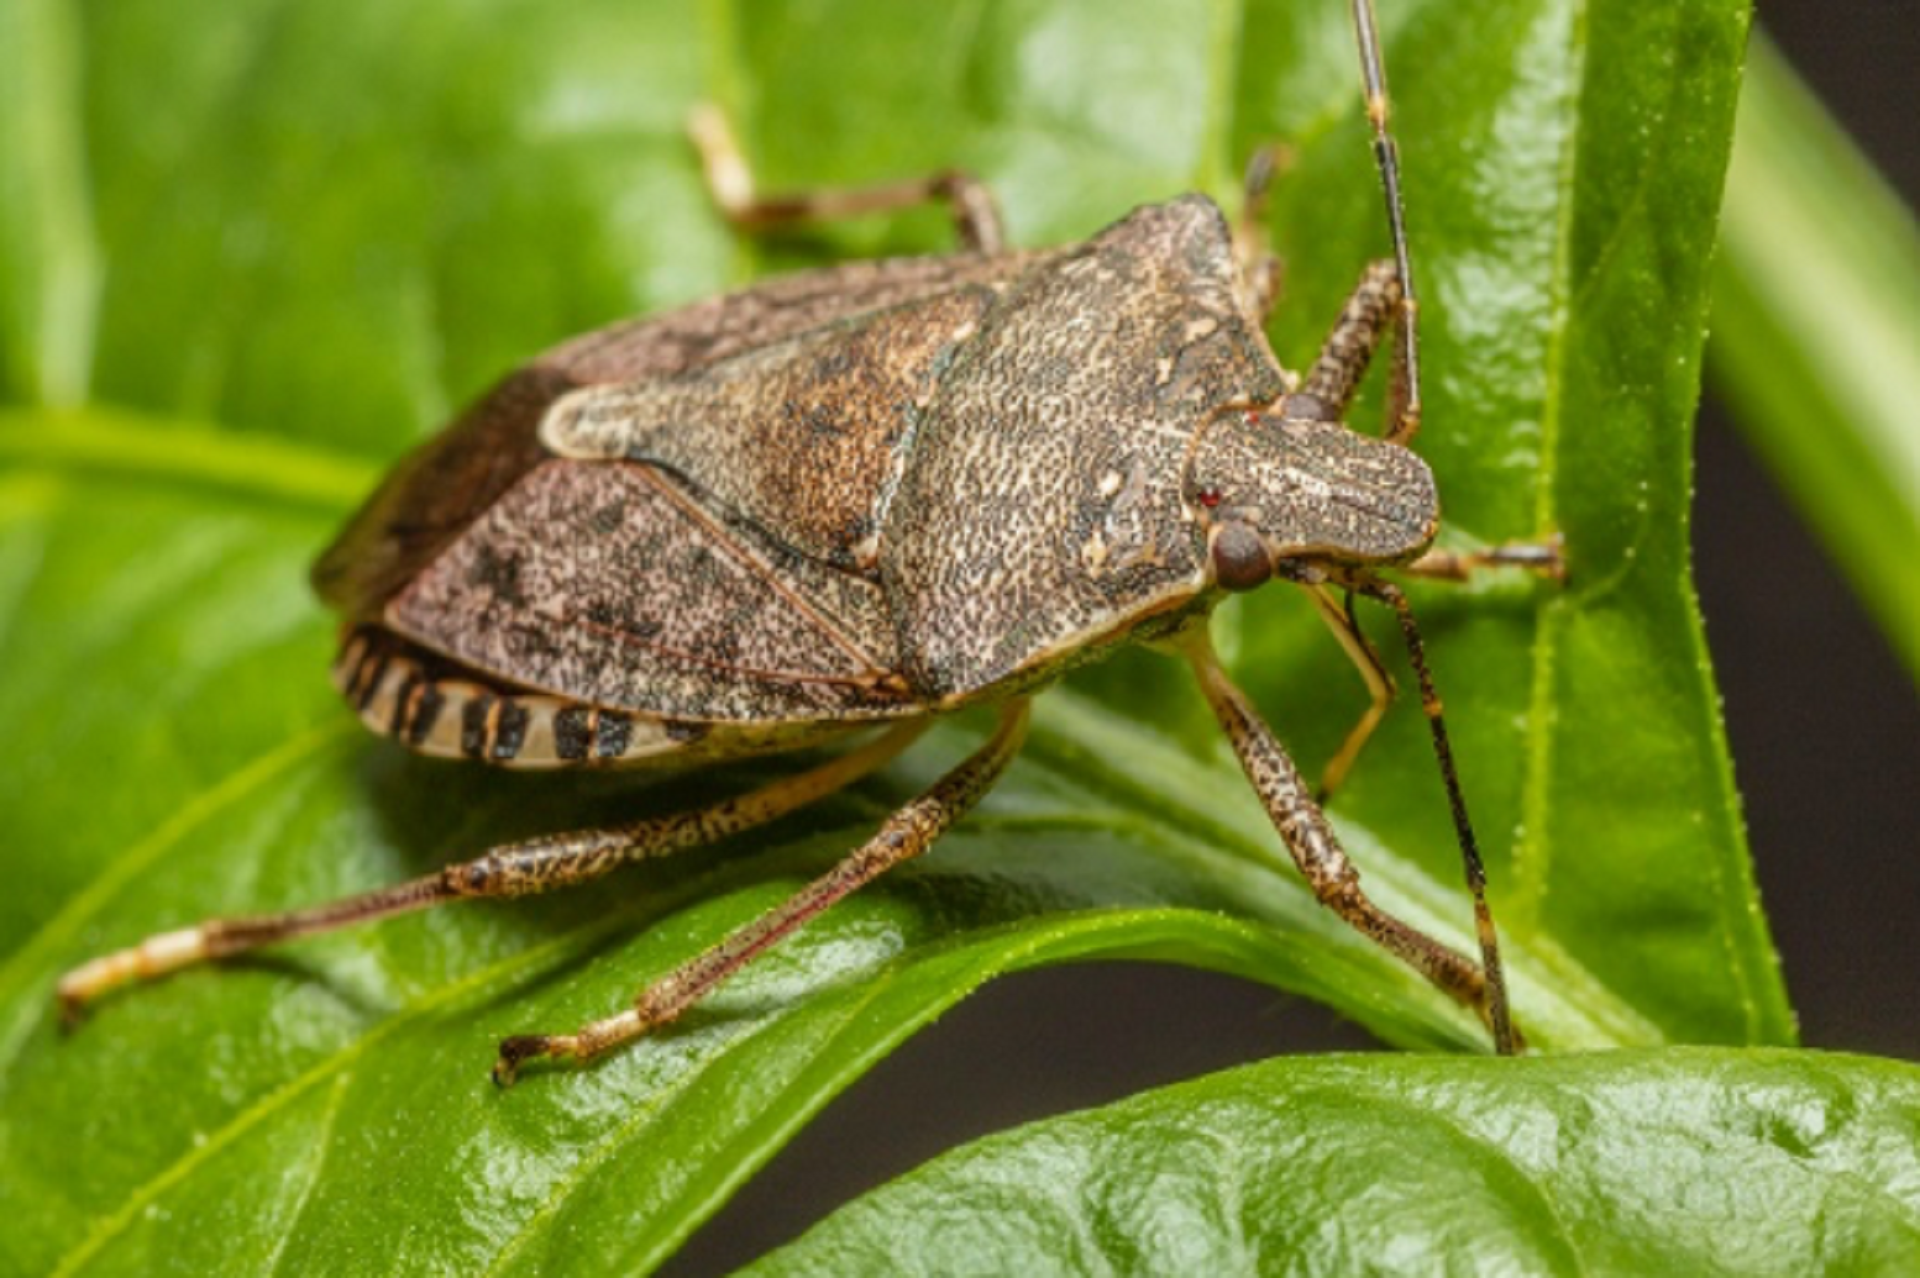
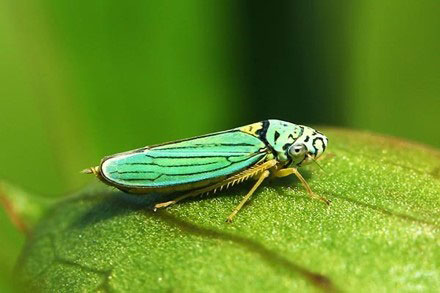
Though vineyard managers continually face many challenges to optimal productivity, Pierce’s Disease (PD) represents a particularly formidable threat due to limited options for effective prevention and control. PD is a degenerative, deadly and costly disease of grapevines caused by Xylella fastidiosa subsp. fastidiosa (Xff) bacteria, Gram-negative rod-shaped microbes with characteristic large pili. Though hosted by many plant species, these bacteria are easily spread to grapevines by insect vectors such as blue-green and glassy-winged sharpshooters (Figure 1, see page 41). Xff colonize the gut of sharpshooters and are transmitted to grapevines as the insects feed on vines.
Pierce’s Disease: A Major Threat
Once inside a grapevine, Xff bacteria impede the normal function of xylem tissue (transport of water and nutrients ‘up’ from roots to stems and leaves.) This damage induces the characteristic chlorosis and scorching of leaves, causing early symptoms of PD which mimic water stress. However, the insidious and cumulative damage caused by PD eventually kills entire vines in one to five years.
PD represents a major threat to U.S. wine regions, accounting for widespread economic damage (e.g., roguing and replanting of vines, low fruit production, etc.) and costly deployment of resources aimed at disease moderation. PD has been reported in 28 California counties, covering most of all wine-producing regions. State Extension teams in Texas, Arizona and North Carolina have reported significant outbreaks in 2021. Lost production and vine replacement has been estimated to cost grape producers about $56.1 million annually as of 2014. Further, a 2016 survey of nearly 200 growers and managers in Napa and Sonoma counties revealed that 73% of respondents identified PD was one of their top three management problems.
Few methods for controlling and treating PD have been made available, with efforts historically focused on controlling the sharpshooter vector (e.g., insecticides, trapping, monitoring, inspections) or roguing seriously ill vines (rogue, replant), all of which has achieved only limited success. However, a new option that reduces PD in grapevines is now available.
New Bacteriophage Injection for PD
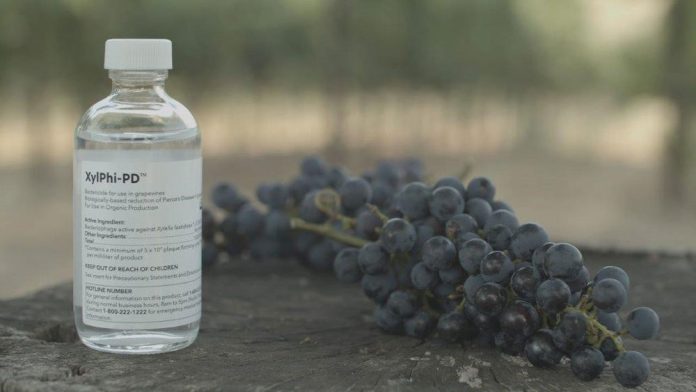
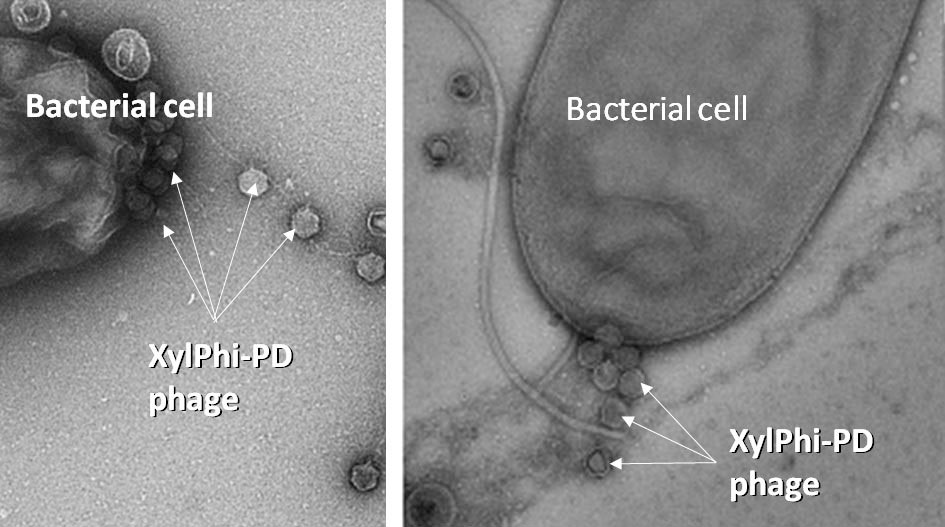
XylPhi-PD is a novel, OMRI-listed, biological treatment for PD, a cost-effective break-through technology developed exclusively for viticulture by A&P Inphatec (Figure 2, see page 32). XylPhi-PD contains a cocktail of viral bacteriophages (Figure 3, see page 32) that are injected into a grapevine (‘bacteriophage’ are bacteria-killing viruses that selectively infect bacteria but do not infect the eukaryotic cells of plants or animals.) These virus particles enter and destroy Xff bacteria, thus limiting bacterial growth and the xylem-clogging damage to the plant. Hundreds of phage particles can be manufactured inside an Xff bacterial cell after infection by a single phage particle. The Xff bacterial cell eventually dies and releases all newly created phage particles to seek and destroy more Xff bacterial cells (Figure 4).
XylPhi-PD applications are made by injection of the product into the vascular system of grapevines. Applications are made directly into the active xylem tissue of the plant using a pressurized injection device, the Xyleject Injection System (Figure 5).
XylPhi-PD can be flexibly applied as a treatment when disease symptoms appear, as a preventative to protect growing vines, or whenever conditions may lead to disease. As with most any disease situation, disease prevention or treatment early in the disease process provides much better outcomes than treatment of later-stage severe infections. XylPhi-PD is available in 100-mL vials (treats up to 300 mature vines or 600 young vines.) The product has no restricted-entry interval (REI), requires minimal personal protective equipment (PPE) when used in accordance with label directions and is approved for use in organic production (OMRI-listed, Organic Materials Review Institute).
Efficacy Overview
Multiple studies have been conducted to support the development and commercialization of XylPhi-PD, and results have provided much insight regarding the product’s efficacy profile and use strategies. Brief overviews of some of these studies follow:
Greenhouse pilot study (Texas A&M, 2014):
Design: 30 greenhouse grapevines inoculated with Xff. 15 vines treated with XylPhi-PD once at three weeks post-inoculation, 15 vines received only buffer. Visual symptoms of PD assessed 12 weeks post-inoculation.
Results: XylPhi-PD reduced PD incidence by 87%.
Natural infection field trial (Texas A&M, 2015):
Design: 30 Chardonnay and 30 Cabernet Sauvignon vines in an area with high natural PD pressure randomly assigned to each of the four groups. Vines treated zero, one, two or three times with XylPhi-PD during the summer.
Results: Disease incidence in the XylPhi-PD-3X group was significantly reduced by 44% (P = 0.047) compared to controls (10% vs 18%). Activity of vectors positive for Xff was high during the trial period.

Challenge studies, prevention and therapeutic treatment (California University, 2017):
Design: Prevention study – 15 Chardonnay and 15 Cabernet Sauvignon vines treated with XylPhi-PD and then challenged twice with Xff.
Therapeutic study – 30 Chardonnay and 30 Cabernet Sauvignon vines/group challenged twice with Xff and then treated zero, one, two or three times with XylPhi-PD.
Results: Prevention – prechallenge XylPhi-PD significantly reduced incidence of PD symptoms by 75% in Cabernet Sauvignon vines (P < 0.10) and 100% in Chardonnay vines (P < 0.05) vs controls.

Therapeutic – three post-challenge XylPhi-PD treatments significantly reduced incidence of PD symptoms by 90% in Cabernet Sauvignon vines (P < 0.05) and 77% in Chardonnay vines (P < 0.10) vs controls.
Multi-year natural infection field trial (2017-20; Sonoma, Calif.):
Design: Two groups of healthy Zinfandel vines were tracked in a high PD-pressure, organic vineyard for three seasons (Ridge, Lytton Springs). One group (n=71) received XylPhi-PD three times/summer, while controls (n=94) only received buffer.
Results: After three years of treatment, vines treated with XylPhi-PD show much less PD incidence than control vines as assessed by both qPCR (-60%) and visual PD symptoms (-72%). Vines treated with XylPhi-PD also generated higher fruit yields, averaging +1.34 lb/vine (+21%) more than control vines.
4-site, 3-year, Natural Infection Field Trial (2019-21; Sonoma, Calif.):
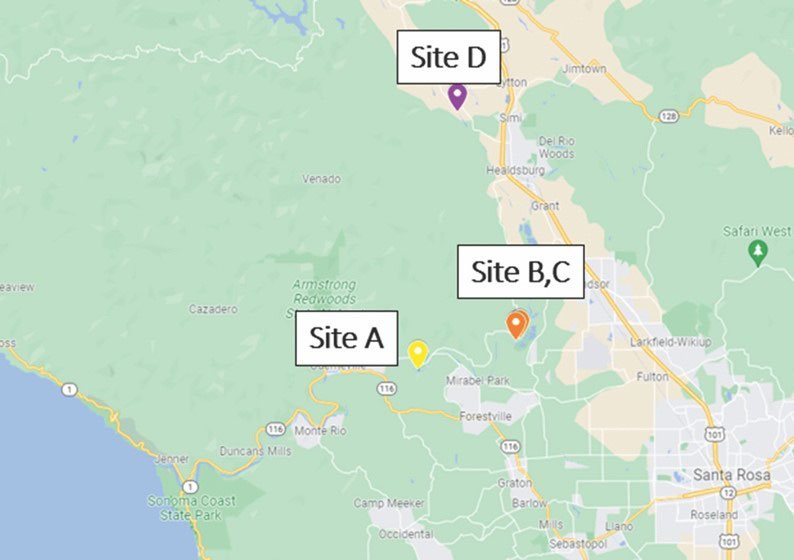
Design: A three-year, multi-location commercial (Wilbur-Ellis) field study evaluated the efficacy of XylPhi-PD against endemic PD across four sites and three production seasons. The extensive research effort began in 2019 when a study was conducted that involved 400 vines (300 Chardonnay, 100 Pinot Noir) at three Sonoma County commercial wineries with a history of PD (one winery had two test fields) (Figure 6). All four commercial vineyards were historically high PD sites, and despite continual roguing and insecticide use in the past, a persistent reservoir of Xff remained in the vineyards from previous infection cycles. Thus, each site included vines with both early-stage and chronic/severe PD.
Vines were randomly selected in treatment blocks at each site and assigned to either of two treatment groups as follows:
-Control (untreated): n=200 (50/site);
-XylPhi-PD: three treatments (Jun/Jul/Aug); 80 µL of XylPhi-PD injected twice in the trunk and once in each cordon (4 to 6 injections = one treatment); n=200 (50/site).
Six petioles from each vine were collected in September for analysis by quantitative polymerase chain reaction (qPCR) and confirmation of Xff infection. All study vines were also visually assessed by trained observers for PD development. Insect traps were placed at each study site in an attempt to monitor vector pressure.
A continuation of the same study protocol was followed in 2020 and 2021, allowing two additional seasons of treatments and observations for the same vines/blocks at the same sites/wineries. In addition, treatments and observations of additional vines were initiated in 2020 at each site (n=50/site, 200 total), repeated again in 2021 (Figure 7). As a result, three groups emerged from the study for tracking and evaluation:

Vines with three years of treatment (three-year treated, n=200)
Vines with two years of treatment (two-year treated, n=200)
Non-treated controls (n=200)
Results
Comparative outcomes for vines qPCR-positive for Xff are summarized in Figure 8, see page 36. Under the conditions of only mild to moderate PD pressure and low vector populations, sequential year-to-year use of XylPhi-PD generated impressive results. Incidence of Xff positivity fell 24% and 45%, respectively, for vines receiving two or three years of treatment compared to untreated controls. Improvement in the three-year group was significant (P < 0.05) vs controls. The few vines remaining Xff-positive in the two- and three-year groups were chronic infections that would be rogued.

The visual assessment of vines for signs of PD was another important study parameter, and outcomes (Figure 8) were similar to those using qPCR confirmation of infection. Vines treated with XylPhi-PD for two years generated a 27% reduction in visual PD incidence compared to controls, while vines treated for three years showed double the benefit, a significant 54% reduction (P < 0.05) of PD incidence. The similarity of these data with qPCR results suggests that visual assessments can help vineyard managers tangibly gauge the efficacy of XylPhi-PD.

Notably, XylPhi-PD continued to protect against PD infections at all four trial sites for the three years of observations, with no new infections detected in the three-year treated group. In contrast, the control group had ~2% to 4% new infections.
Fruit yield was measured at one study site (D) at the study’s conclusion in 2021 (Figure 9, Chardonnay, eight- to ten-year-old vines). Compared to untreated controls, vines in the group treated with XylPhi-PD for three years averaged 5.1 lb (+17%) more fruit per vine than controls. Vines treated for two years were intermediate (3.1 lb, +10% more fruit vs controls).
Usage Recommendations
XylPhi-PD can be applied as a preventive treatment to protect growing vines, as a therapeutic treatment when disease symptoms become visible, or anytime production conditions may lead to disease pressure.
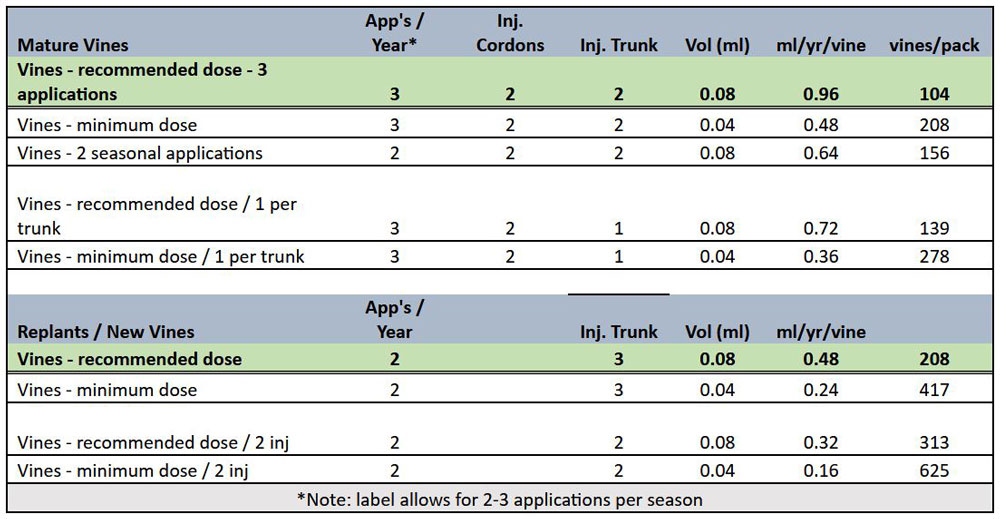
Locations selected for application of XylPhi-PD can be based on the age of the plant, the pruning style and/or the training system utilized for the plant. The product is to be injected into the active xylem vascular tissue above ground level. Two examples of injection strategies appear in Figure 10, see page 37. On established vines, for example, one or two injections can be applied in the trunk with an additional injection in each cordon or spur. For young, recently planted or radically pruned vines, apply two or three injections into shoot, two to six inches above the ground. For all scenarios, the total number of injections administered to a vine define one ‘application’ of XylPhi-PD.

For most production situations (medium to high PD pressure), two or three applications of XylPhi-PD are recommended during each growing season at near-monthly intervals (Figure 11, see page 37). This frequency of application has been demonstrated to provide optimal PD control under various levels of PD pressure. The volume of XylPhi-PD administered can also vary depending on the age of plants being treated and PD pressure.

The quantity of XylPhi-PD used in XylPhi-PD treatment programs can vary based on the number of injections/vine, the concentration of product/injection and the number of applications/year. Growers and PCAs have options and flexibility to match doses and the number of applications to their specific conditions and risks. Table 1 summarizes some of these options and their impact on the amount of XylPhi-PD used and number of vines treated per 100-mL vial.
Treatment Strategies for PD Management
Several recommendations for managing PD across an entire vineyard have emerged from field use experience with XylPhi-PD. These recommendations largely depend on the scope and distribution of PD in a particular vineyard or block.
As usual, vines demonstrating severe and/or chronic PD infection should be rogued per IPM protocols.
Vines appropriate for XylPhi-PD treatment should be identified.
These appropriate vines should be treated with recommended doses of XylPhi-PD at two or three seasonal applications as needed for mature vines or replants (per label directions).
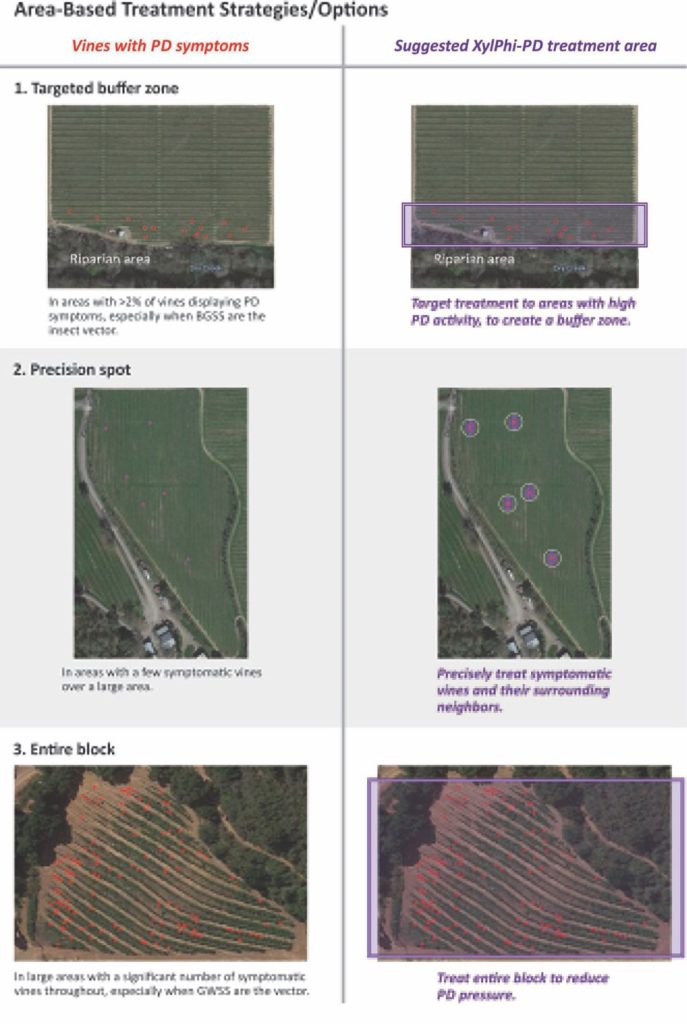
It is the second step, identifying which vines to treat, that can sometimes pose a quandary for production managers. To help in this process, three strategic options can offer direction for developing a customized plan for vineyard-wide PD management. Based on evaluations regarding the spread of infection and site specifics for a particular vineyard or block, a treatment strategy can be selected from the following (Figure 12):
Targeted buffer zone: Treat all vines in any defined area with high PD activity (>2% symptomatic vines) and/or vector activity, such as near a riparian area.
Precision spot: In large areas with few symptomatic vines, mark/identify affected vines and treat only them and their immediate surrounding neighbors.
Entire block: In large areas with multiple scattered symptomatic vines, in the presence of vectors, full-block treatment is needed to reduce overall PD pressure.
In addition to these three options, the duration of treatment (multiple years) is also a critical consideration. As discussed earlier, field studies have demonstrated the cumulative value of consistent treatment with XylPhi-PD over multiple years for reducing the level of PD in a vineyard or block, even when under low PD pressure. As always, prevention of severe, chronic disease is the best approach, and consistent long-duration use of XylPhi-PD appears to substantially diminish PD progression and pressure in vineyards.
Identifying PD
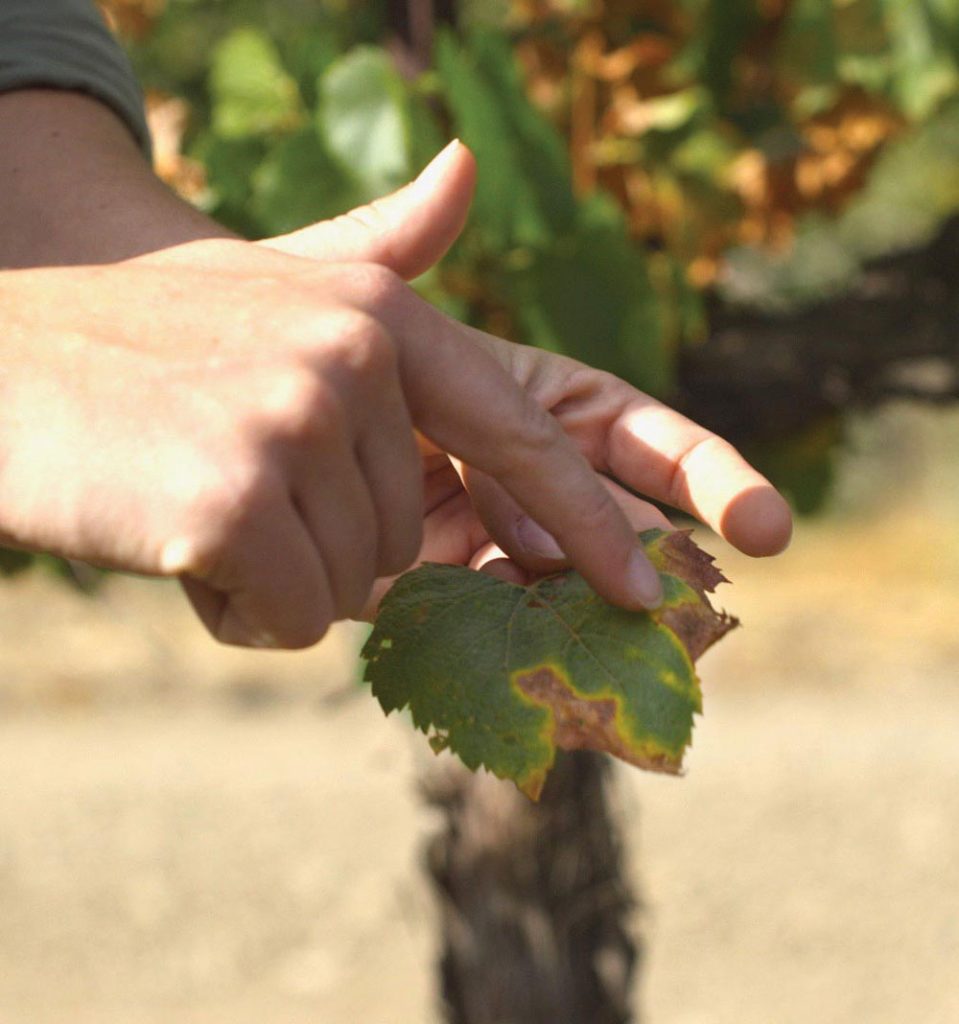
Some of the visual signs of PD damage are presented in Figure 13, including characteristic chlorosis (leaf scorching), irregular lignification and berry shriveling, and ‘matchstick’ petioles. In general, PD is likely present in a vineyard if the following four symptoms are observed late in the season:
Leaves scald in concentric rings or in sections
Leaf blades abscise, leaving petioles attached to the cane
Bark matures irregularly
Fruit clusters shrivel or raisin
However, damage caused by various other diseases, water stress, pests or nutrient deficiencies/imbalances may produce symptoms similar to those caused by PD. Therefore, PD must be laboratory confirmed by detection of Xff by qPCR testing on late-season/fall petioles (e.g., UC Davis Foundation Plant Services, Texas Plant Disease Diagnostic Lab, Arizona Plant Diagnostic Network).
Conclusions
PD is an extremely challenging problem for wine producers and their consultants. A biological control approach with XylPhi-PD offers a fresh opportunity to help manage PD and limit losses associated with the disease. In multiple studies, XylPhi-PD treatment of diverse wine varietals prompted reductions in PD incidence and/or severity under conditions of both natural and challenge infection with Xff. These favorable outcomes distinguish XylPhi-PD as a targeted and cost-effective strategy for effectively protecting valuable vineyards against PD.
Always read and follow product label directions. Not registered in all states. EPA Reg. No. 93909-1. Operators of injector must undergo training and be certified by Pulse and must follow instructions in device manual. XylPhi-PD is a trademark of A&P Inphatec. Xyleject is a trademark of Pulse Biotech.
To view a field trial demonstration click here https://www.youtube.com/watch?v=LzwQv-hfcew
Diagnosing Vineyard Problems
The 2021 season was a challenging year for western grape growers. After an unusually dry, cool winter, many growers observed poor shoot growth and various fruit maladies from bud-break through harvest. Delayed spring growth, vine mealybug and leaf hopper infestations, heat waves and water shortages were just a few of the issues that caused problems for grape growers.
Farmers and viticulturists were busy trying to diagnose various vineyard problems from shortly after bud-break through leaf fall. Diagnosing vineyard problems as soon as possible is important for minimizing yield and quality losses, especially when caused by pests that can be managed before moving into neighboring vineyards. However, when a quick diagnosis cannot be made, it is important to survey the vineyard and collect as much information as possible so damage can be mitigated.
Prompt Data Collection
When trying to diagnose abnormal plant growth, it is important to collect as much data as possible near the time that it was first observed. Data in the form of dates, symptoms (e.g., abnormal growth), signs (e.g., insects), records, etc. are important for you and those you may consult with in determining the cause of poor growth. Table 1 highlights important information to collect for proper diagnosis. The most basic information focused on vineyard characteristics, such as variety/rootstock combination, weather, soil, irrigation type, grape tissue analysis, etc., are typical data needed to solve vineyard problems. Sometimes, it can take days or weeks of consideration to determine what has affected the vines. However, there are times when a problem remains unsolved, even after data have been collected and reviewed by multiple experts.
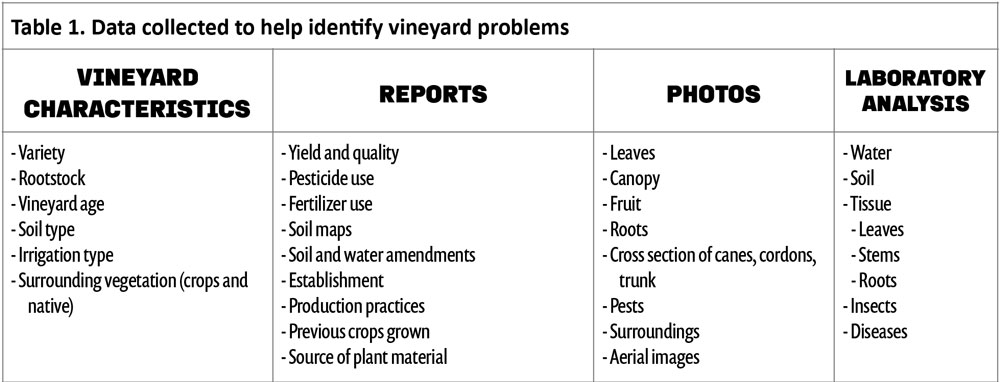
After basic vineyard characteristics, reports (see Table 1) of varying types are important pieces of information for deciphering vineyard issues. Phenological dates, yield and quality, fertilizer and pesticides used, etc. give clues about what has happened this season and in past years that may correlate with a particular issue. The more reports that are available for review, the easier it will make solving the problem.
Photos are a great tool because they can easily and quickly be shared via email or text. Today’s phones are equipped with a camera that can capture both photos and video that make documenting vineyard problems easier. However, there is a difference between a photo and a great photo that can help solve the cause of symptoms. Great photos show detail that can aid in determining the cause of symptoms. For example, a picture of a single leaf on the bed of a truck probably won’t help identify a problem. A more useful photo would highlight multiple symptomatic leaves showing their location on the grapevine and in the vineyard, which may highlight the root cause of a problem.
Water, soil and tissue laboratory analysis when taken annually help identify trends over seasons. The best approach is to pull samples at specific times (i.e., growth stages) each year so the information is available when decisions need to be made. For example, taking water samples at the beginning of the growing season will help determine how much nitrogen is coming from irrigation water sources. Once known, planned fertilization rates can be adjusted depending on the amounts in the water. Excess nitrogen applied during the season without knowing what is in well water can contribute to poor fruit quality and may further contaminate the aquifer.
Biotic vs Abiotic
Vineyard issues affecting vine health and fruit production fall into two categories: biotic or abiotic. Issues caused by insects, fungi, bacteria, viruses, rodents, birds and other living organisms are biotic. Abiotic includes non-living factors like climate, soil compaction, water, pH, nutrient presence or lack thereof, etc. Biotic factors tend to be the most common reason for poor grapevine health but aren’t always the primary cause.
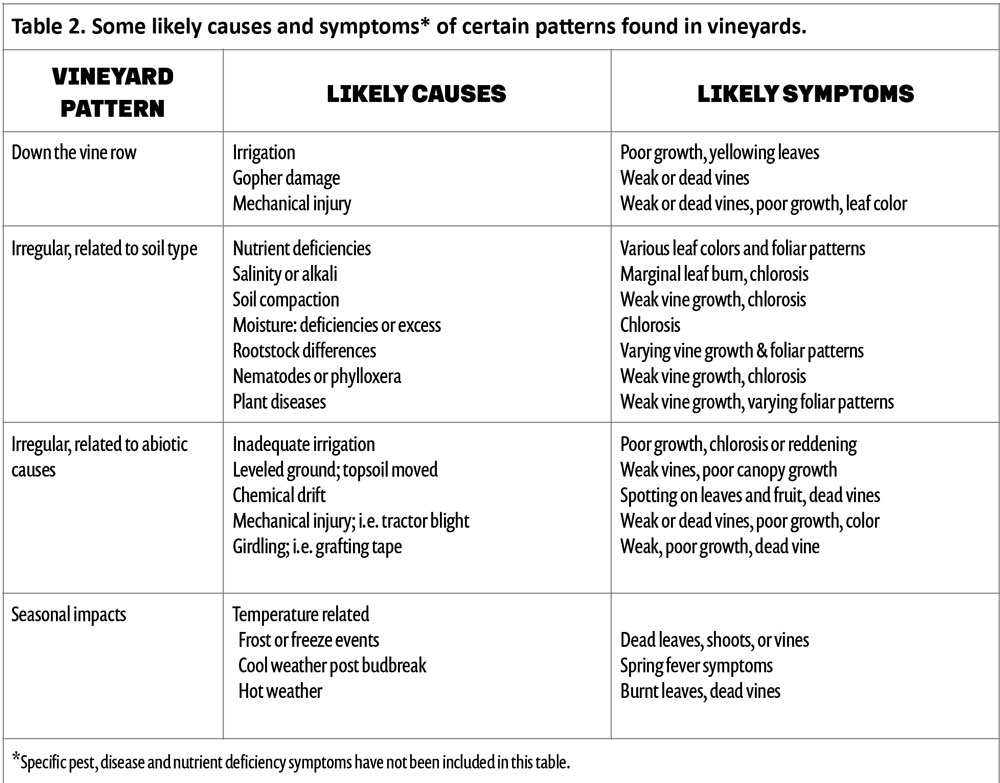
Trying to separate symptoms between biotic and abiotic vine health issues can take time to sort through since symptoms can have multiple causes. For example, a vineyard may be showing signs of decline due to root rot infections. However, the real cause may be the presence of hardpan not allowing water to drain. Water accumulating around vine trunks often leads to fungal infection, decline and vine death. Symptoms from both fungal infections and poor water penetration can have similar symptoms (weak vine growth with chlorotic foliage). Identifying the primary cause is important so a solution can be developed and implemented.
Understanding Patterns
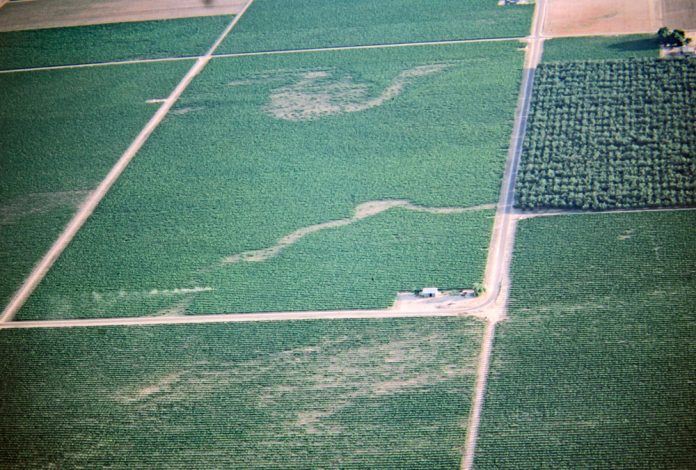
Patterns of symptomatic vines are an important piece of information needed to solve the cause of poor vineyard growth. An easy way to identify patterns is the use of aerial imagery (Figure 1) to survey your vineyard. Aerial imagery has improved tremendously and can help detect differences in vine growth, soil and irrigation issues, pest or disease problems and more. Accessing aerial imagery is as easy as using your own drone to capture footage or hiring a licensed pilot or company to take photos and video for you.
Data from aerial imagery can also be transformed into helpful indices such as NDVI, and specialized sensors such as thermal or hyperspectral images provide additional data for assessing vineyard condition. Aerial imagery can help you track irrigation problems or general vine health throughout the season by outlining patterns based on vine growth and leaf condition.
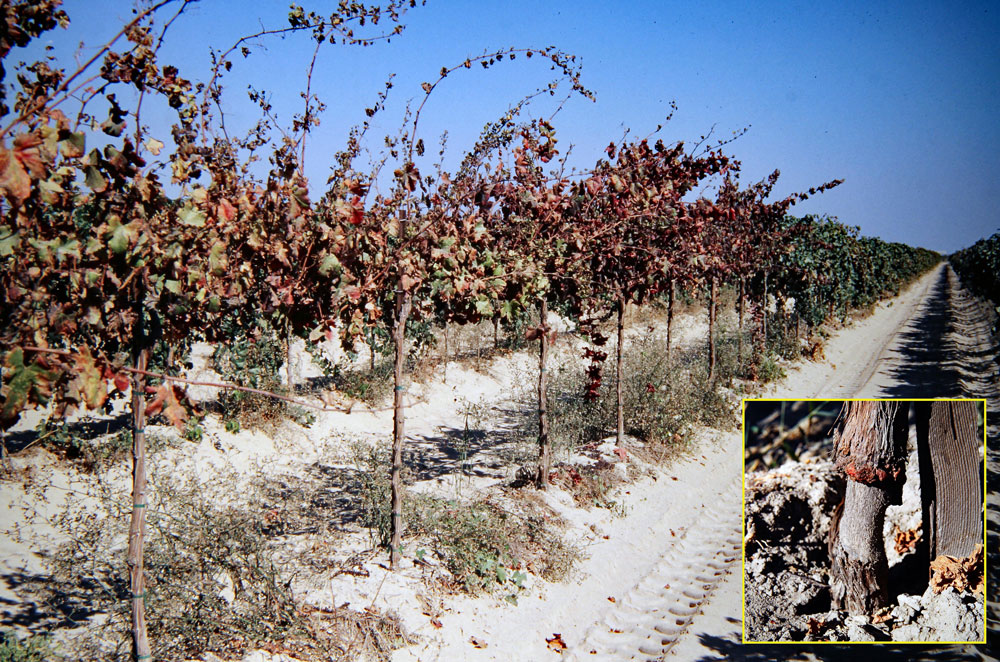
Driving and walking vine rows with a soil map in-hand can be essential for assessing problem areas. Surveying the vineyard on foot or with an ATV allows for a closer look at low-vigor areas, which may give you management clues that can complement aerial imagery. Patterns of poor growth found on vineyard edges, down rows or in small patches are sometimes easily solved when those areas are visited on foot. For example, Figure 2 shows multiple vines within a row that are weak or dead. At first glance, a disease might be suggested as the cause of poor growth and death. But after further investigation from top to bottom, it was found that the base of the vine and root system had been chewed and girdled by meadow voles. Once the problem was identified, a management plan was implemented, which ended additional vine deaths.
Symptom Diagnosis
Diagnosing abnormal growth symptoms is somewhat of an art and a science. When called to identify the cause of poor or unusual growth, a vineyard diagnostician must consider all the scenarios that might be causing symptoms.
A methodical approach that results in an accurate diagnosis is important since time is of the essence when considering management strategies to minimize yield and quality losses. Variety, rootstock, vineyard age, soil type(s) and depths, irrigation methods and timings, nutrition, common pests, diseases, climate and many other factors must be considered. A systematic approach must be taken to identify the primary cause that includes symptoms found in the vineyard, including related reports, photos and laboratory analyses.
Diagnosing grape pests or diseases can be easier than abiotic causes since three factors need to be present: the pest or disease, grape (i.e., host) and favorable environmental conditions.
Often, the lack of optimal climatic conditions do not allow for pest or disease outbreaks. In contrast, the cause of abiotic symptoms is more difficult to identify and costs time and resources. Once pests or diseases have been eliminated as causes, a diagnostician must spend time reviewing reports, lab analysis and walking the vineyard looking for patterns and additional clues. A shovel, shears, soil probe, and a lot of time will be needed to narrow down the cause.
Finding a Trusted Advisor
Solving vineyard problems that are negatively impacting yield and quality can be daunting, especially when you are working alone. At some point, you may need to consult with an expert. Finding a trusted advisor can also be daunting because there’s often a cost associated with hiring someone. Here are some considerations for finding and hiring a CCA, PCA, private consultant or agricultural forensic consultant.
Before hiring someone, clear goals need to be identified so they can be shared with a prospective consultant. First, what are the yield and quality goals for the vineyard and are they being impacted by the problem? Are you trying to determine what has reduced vineyard performance or what has killed vines? Second, do you want solutions to end the loss of vines and stop the yield decline? Finally, do they have the experience needed to help you solve your vineyard problem? Are they focused on your success or are they just interested in selling you something that will “correct” the problem? If it is a challenging problem, do you feel confident that they will tell you the truth if they don’t know what the cause of poor growth is in your vineyard? If you don’t already have a trusted CCA or PCA, it may take some time to interview a consultant that you feel confident will help you and have your success in mind.
Use of Gypsum to Reclaim Salt Problems in Soils
Soil salinization is caused by excessive accumulation of salts in the soil and is one of the most severe land degradation problems. Globally, salt-affected soils are estimated to be about 2 billion acres and are expected to increase in the future. In California, about 4.5 million acres of irrigated cropland (more than half) are affected by salinity, causing significant problems to the state’s agriculture. When salinity levels exceed critical thresholds in the soil, the plants cannot reach their full genetic growth potential, development and reproduction.
Causes and Consequences of Soil Salinity
Soil salinity can be related to the origin of the soil (e.g., in soils from land that was once submerged under the level of the sea or a lake.) It can also be caused by humans. Irrigation in dry areas exacerbates the problem as water contains salts that are left in place after evapotranspiration, and there is not enough rainfall to help with the leaching (i.e., the process of washing off excess salts from the surface toward the deeper layer of the soils and out of the reach of plants.)
Salinity can be caused by excess in different kinds of salts, including table salt (NaCl), potassium chloride (KCl), etc. Table salt is the most common and most problematic. It is composed of sodium ions (Na+), which negatively impact soil physical-chemical properties and create an osmotic stress in plants, and chloride anions (Cl-), which are toxic to plants.
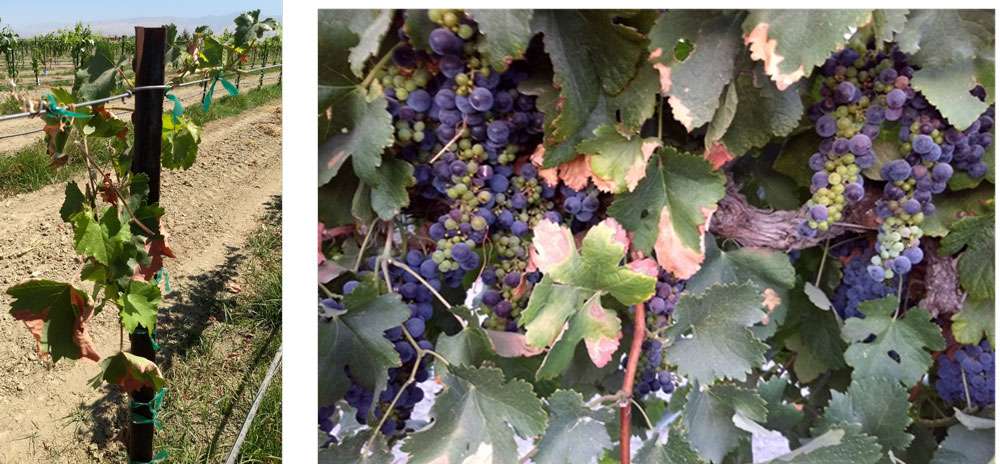
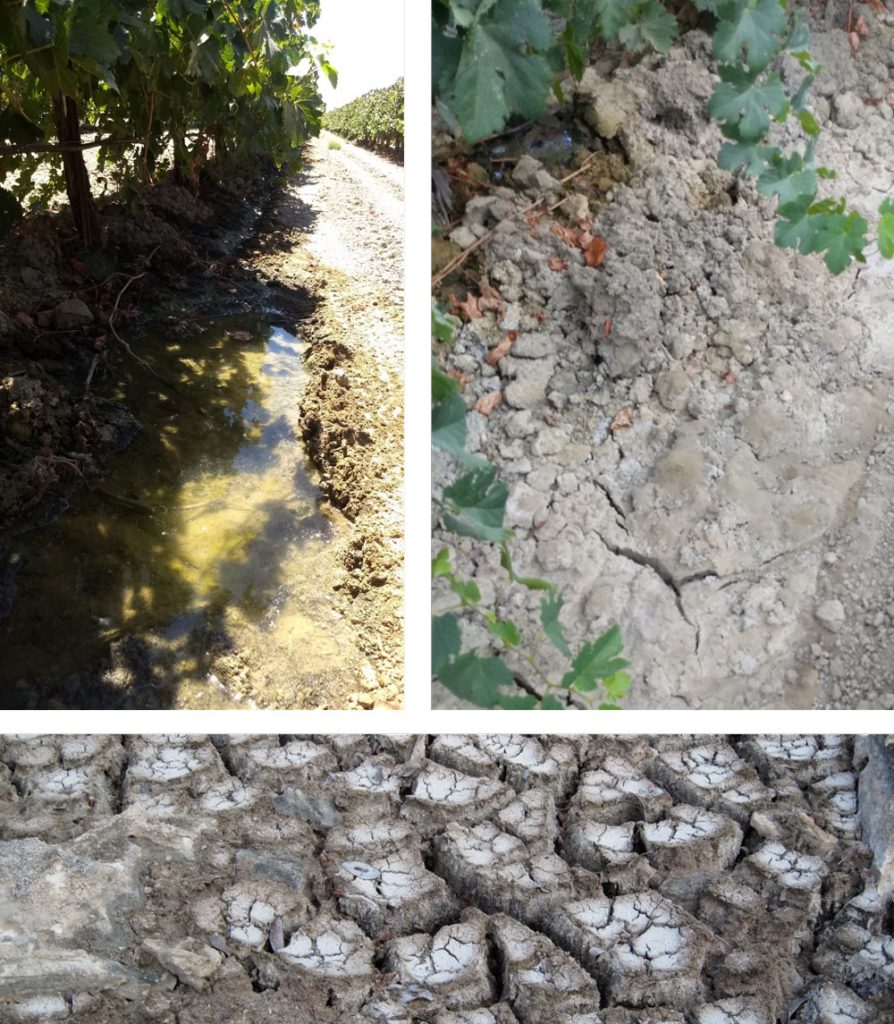
Accumulation of sodium in soils causes swelling of clays, destroys soil structure and reduces infiltration and water holding capacity (Figure 2). This reduces the oxygen & water availability to roots. Excess of salts in the soil generates osmotic stress, which affects grapevine physiology and performance. At low rates, it is a chronic problem that disturbs grapevine water relations, causes stomatal closure in grapevine and reduces leaf and crop size. At high rates, it can create toxicity problems that can lead to premature leaf senescence and plant death (Figure 1, see page 22).
Salt buildup can result in three types of soils: saline, saline-sodic and sodic. Salinity & sodicity terms are used interchangeably very often. However, salinity refers to the concentration of salts (of all kinds) in the soil. Sodicity is associated with the proportion of sodium in pore water or adsorbed to the mineral surface. In saline soils, there are enough soluble salts of all kinds to injure plants. Sodic soils are low in soluble salts but relatively high in exchangeable sodium. Saline-sodic soils have a high content of salts and high content of sodium relative to calcium and magnesium salts.
The electrical conductivity of soil extracts can measure soil salinity, as with more salts in the water, it is easier for the current to flow. Sodicity of soil is indicated by the exchangeable sodium percentage (ESP), which is the soil cation exchange capacity occupied by sodium, or by the measure of sodium adsorption ratio (SAR), which represents the amount of sodium with respect to calcium and magnesium. Saline, sodic and saline-sodic soils can be differentiated according to their physical-chemical properties. Soils with EC > 4 dS/m, SAR <13, pH <8.5 are classified as saline soils; soils with EC <4 dS/m, SAR >13, pH >8.5 are classified as sodic soils; and soils with EC >4 dS/m, SAR >13, pH <8.5 are classified as saline-sodic soils.
Alleviating Soil Salinity
Alleviation of salt-related problems is of crucial importance to reduce the impact on crop performance and ensure the profitability of agriculture. This can be done by decreasing the amount of Na+ ions, destroying soil structure and replacing them with Ca+ ions. Adding calcium helps maintain a favorable electrolyte concentration in the soil solution, thereby preserving the physical and chemical properties such as structural stability and clay flocculation, which encourages better root penetration and air and water movement through the soil. Ca2+ ions have a much higher flocculating power than sodium and potassium ions due to their charge and size. Thus, Ca2+ ions have a higher affinity for clays and can easily replace Na+ ions during soil reclamation practices to improve soil properties.
For this purpose of alleviating salt buildups, soils are treated with calcium-based amendments, the most common being the application of gypsum (CaSO4·2H2O). Other products, such as calcium chloride (CaCl2), calcium carbonate (CaCO3) and sulphuric acid (H2SO4), can also be used for reclamation of saline soils but are not as effective as gypsum, and they are destined to specific conditions.
Calcium chloride contains chloride anions that are known to be toxic to plants and, in particular, grapevines. Sulphuric acid does not directly contain calcium required to replace the Na+ ions in the soil. Hence, it is only effective in calcareous soils (rare in the U.S.), where it can react with the calcium carbonate to free the calcium already in place. Calcium carbonate (CaCO3), or lime, is alkaline and significantly less soluble than gypsum. It is generally used to reclaim acid soils. It cannot provide sufficient Ca2+ ions for effective Ca2+- Na+ exchange as it can free Ca2+ ions only in acid soils, while salt-affected soils are generally alkaline.
Gypsum as a Solution
Gypsum is a soft sulfate mineral composed of calcium sulfate dihydrate with the chemical formula CaSO4∙2H2O containing two molecules of water inside every single crystal.
Calcium sulfate can also be found in two more phases: calcium sulfate anhydrite (CaSO4), which does not contain water of crystallization, and calcium sulfate hemihydrate, also called bassanite (CaSO4∙1/2H2O), which only contains a half-molecule of water per crystal. Severe pressure, temperature and other natural conditions make gypsum outcrops lose water molecules and form anhydrite and bassanite.
Besides a high concentration of calcium and sulfur, pure-quality gypsum contains 21% water, giving it peculiar properties (e.g., different solubility) with respect to the other forms of calcium sulfate. Of particular importance under dry conditions is the ability of plants to access and use the water in the crystalline structure of gypsum.
The use of gypsum crystallization water by organisms is a critical water source for life under dry conditions, as recently demonstrated by Palacio et al. 2014. These authors reported that in natural conditions and during summer, the sap of shallow-rooted plants is 70% to 90% derived from gypsum crystallization water. The extraction and use of water molecules from gypsum by plants is accelerated in hot temperatures. Microporosity of gypsum also offers protection to the soil microbes and promotes relatively abundant and diverse microbial life in dry conditions. Soil microbes may in turn increase the availability of inorganic compounds to plants.
Gypsum is best applied routinely, as frequent irrigations leach out calcium from the root zone. This is even more important when water for irrigation is alkaline. If gypsum is not applied regularly and calcium content decreases in the soil, the soil tends again to get compacted and the infiltration of water slows down, creating stress to plants.
It is recommended to spread gypsum on soils as an application through low-volume irrigation sources (i.e., drip and sprinklers) and is shown to work best with irrigation water of low salinity, i.e., about 0.1 ds/cm. Liquid gypsum application can increase the water infiltration to greater depths under the emitters over time due to soil particle binding and aggregation properties of calcium. When gypsum is applied through drip lines with irrigation waters of high bicarbonate content, it requires cautionary measures and lowering of pH (<6.5) because of the formation of calcium bicarbonate precipitates.
Gypsum Research
With the intent of clarifying the effectiveness of gypsum to reclaim salt-affected soils and to provide application guidelines in vineyards, we performed a three-year-long project where we monitored the response of soil physics, grapevine physiology and fruit composition to different dosages and forms of CaSO4 (anhydrite, CaSO4 & gypsum CaSO4∙2H2O) in synergy with organic matter.

The experiment was performed from 2019 to 2021 in a Merlot vineyard located in a fine loamy sodic soil on the southwest side of Bakersfield, Calif. After the first season of measurements (2019), to ensure no differences across treatments before application, we broadcasted chemical amendments in winter 2020 in bands under the vines (Figure 3, see page 26). The experiment was a completely randomized block design with six treatments replicated four times, and each replicate was 0.2 acres large.
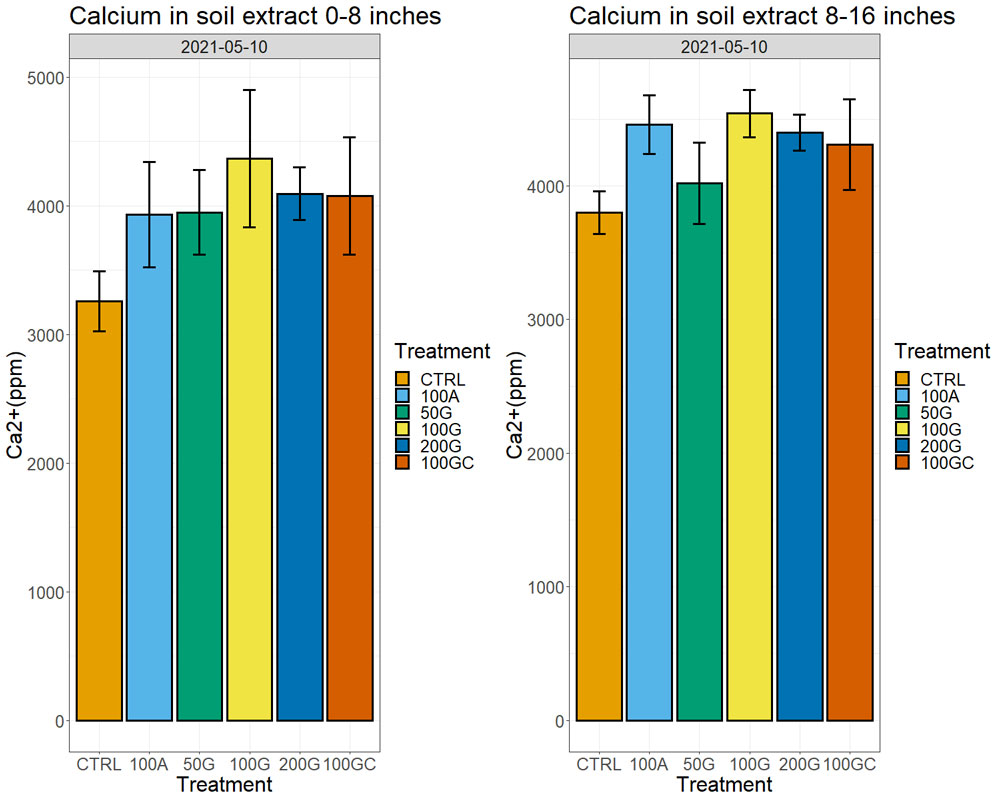
The treatments were applications of gypsum at different rates: 2.5 t/ac (50% reclamation rate, code 50G), 5.1 t/ac (100% reclamation rate, code 100G), 10.2 t/ac (200% reclamation rate code 200G), application of anhydrite at 5.1 t/ac (100% reclamation rate, code 100A) and addition of compost to gypsum (5.1 t/ac gypsum + 1t/ac compost (code 100GC)). We included one untreated control (code CTRL). All treatments were applied in one single application at the beginning of the experiment.
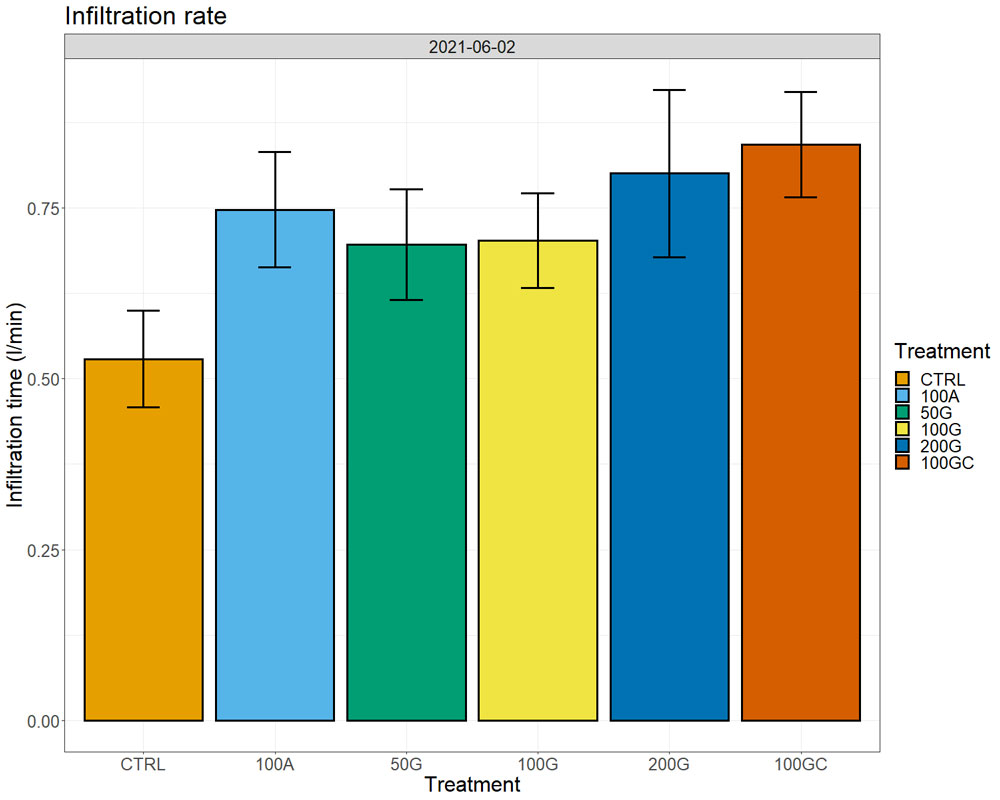
Calcium amounts in the soil extracts (obtained after treatment of soil samples with ammonium acetate) increased in all treatments with respect to the control one year after the application, both in the top eight inches and at a depth between 8 and 16 inches. We observed the largest increase in the 100G, which had 28% more exchangeable calcium ions on the soil particles than the control in the top eight inches and 15% more in the 8- to 16-inch depth (Figure 4, see page 26). Sixteen months after the application, we started observing effects on water infiltration rate in the soil, with the untreated control showing the lowest water infiltration rate. The 200G and 100GC showed the highest infiltration rate with 65% and 63% improvement over the control, respectively (Figure 5, see page 26).
We did not observe notable differences in plant water status measured by a pressure chamber (water potentials), neither in photosynthesis nor transpiration across the treatments. In the two years after the treatment, we observed higher yields in the 200G and 100GC with respect to all other treatments and the control (Figure 6). The response was more robust in the year of the application, in particular for the 100GC, with plants producing 15% higher yield than the control, but only 2% more than the control in the second year. At the same time, the effect of the 200G was more consistent and was higher (8%) with respect to the control the same year as well as the following year (5%). The other treatments did not have positive effects on yield. We did not observe significant differences in sugar content (Brix), pH or titratable acidity of musts across treatments.
This trial showed that gypsum effectively reduces the adverse effects of salt stress on soils and vines by increasing calcium ions at the surface of clays. The increase of calcium ions improves soil structure with positive returns on infiltration rates and the increase in soil health promotes grapevine performance and increases yield. The addition of compost enhances the positive effects of gypsum.
Leaf Sap Analysis: A Forward-Looking Alternative to Tissue Sampling
Leaf sampling in agricultural crops is a long-practiced sampling method where the analysis of the collected tissues is used to assess crop nutrient status. Sampling whole leaves, drying, grinding, digesting and then analyzing the sample for nutrient levels has aided farmers in managing their crop nutrition programs and optimizing crop yield.
This method, however, has some inherent limitations. Primarily, the results of the analysis are providing nutrient levels for ALL nutrients in the sample, including those that are structurally bound within cell walls, the leaf surfaces (cuticles) and organelles. While the analysis is accurate in quantifying the nutrient levels in the sample, these bound nutrients are largely immobile and unavailable to developing leaves and fruit.
Additionally, any nutrients found on the outside of the leaf or embedded in the leaf cuticle are included in the results. As an example, if a calcium carbonate material were applied foliarly to a crop and then tissue samples were pulled, the analysis would demonstrate that our tissue’s calcium levels increased. On the other hand, calcium carbonate materials have very poor foliar uptake and are commonly used as solar protectants or sunscreens. As a sunscreen, it is necessary that the material remains on the leaf surface to do its job, but a standard tissue sample analysis cannot differentiate between “in” or “on” the leaf. Further, tissues being prepped for analysis may be rinsed or washed in an attempt to alleviate leaf surface contaminants. What is commonly overlooked with this practice is the effect that rinsing can have on nutrients within the leaf. For instance, potassium, calcium, magnesium, manganese, nitrogen, phosphorus and zinc can all be leached to varying degrees from the leaf tissue with water.
Now, if the grower is analyzing the leaf tissue because it is the crop, then knowing the nutrient levels of the entire leaf structure and surface is appropriate. However, many growers are not selling leaves but are using the leaves as the machinery to develop the structure of the plant and produce the end crop. Whether that end crop is a tuber, fruit, nut, seed or simply a flower, knowing the number and quantity of nutrients available for assimilation within the plant as well as the balance among these nutrients may spell the difference between a mediocre crop and a stellar crop. Knowing and adjusting the nutrient balance is crucial to nutrient performance and preventing fruit nutrient disorders which can impact crop storability and shelf life. Other characteristics such as fruit sugar levels, size and color also can be positively impacted by proper nutrition.
Forward Looking Analysis
An alternative method to leaf tissue analysis is sap analysis. With sap analysis, leaves are sampled in sets with new leaves and old leaves collected separately without petioles. At the lab, a proprietary process under the NovaCrop brand then extracts the sap from the leaf. This process is done without rinsing, drying, grinding, cutting or crushing the leaves and the extracted sap is largely free from leaf structural components and surface contaminants. This results in the extracted sap being more similar to a blood sample than the biopsy approach akin to classical tissue sampling and analysis. In addition to analyzing the samples for 19 nutrients and five other nutrient and metabolic indicators, having the sap of both new and old leaves analyzed separately allows for the comparison of nutrient uptake, mobility and remobilization within the plant. This comparison is also valuable for assessing the movement of sugar in the plant, which is the plant’s initial building block and energy source.
Minerals, sugars and nitrogen-containing compounds, such as amino acids and proteins, found in the sap represent the majority of plant nutrients that are immediately available for use. By intentionally sampling and analyzing leaf sap, the results provide a forward-looking picture of the nutritional environment in which the plant is currently growing. With this information, deficiencies, toxicities and nutritional imbalances can be identified and corrected in a proactive manner, often before their physiological effects are visible. With traditional tissue analysis, the results are providing information largely about what has already happened nutritionally, leading to decisions being reactive in nature. As the demand for agricultural products continues to increase, farmers are often turning to more aggressive fertility programs, which frequently leads to over-applying nutrients or missing the best opportunity for the application.
Both over-applications and mistimed applications of nutrients can negatively affect crop yields and quality. The balance of nutrients within the plant can be upset by an over-applied nutrient. This can happen with foliar-applied nutrients as well as soil-applied nutrients. In some instances, as with nitrogen, it can alter the expression/regulation of genes and lead to a shift in growth toward vegetative and away from fruit development. In other cases, the over-applied nutrient can create nutrient imbalances that present as deficiency symptoms of other nutrients despite adequate concentration levels in the sap. This can be described as like-kind interactions where minerals of similar charge are competing with each other for space within the sap (cations affect cations and anions affect anions.) Physiological responses within the plant to an applied nutrient can modify the uptake or physiological activity associated with other nutrients, either positively or negatively.
Nutrient Availability
By removing unavailable nutrients from the analytical picture, the concentrations of available nutrients and their interactions are more easily seen in the analysis and accommodated for in the grower’s nutrition program. In the soil, colloidal and mineral properties influence how various nutrients, specifically cations, populate the cation exchange locations. A key takeaway is that these soil interactions occur primarily with available nutrients. The same is true within the plant with nutrient interactions primarily between available nutrients not unavailable and structurally bound nutrients. This is where sap analysis shines.
By quantifying the metabolically active and available nutrients in the sap and assessing their balance, growers are able to determine not just if nutrient deficiencies exist but also the future potential for nutrient deficiencies. With a NovaCrop sap analysis in hand, growers are able to evaluate the balance of nutrients in their crop and better understand how excessive levels of nutrients may impact the uptake and/or activity of others. Through this analytical report, a grower might determine that the most efficient way to increase the level of a certain nutrient is NOT by applying more of that nutrient, but rather is best achieved by decreasing the rate of other applied nutrients and restoring balance. Over-application of nutrients affect the safety of ground and surface water for human consumption and the wildlife dependent on those water sources. In an ever-increasingly regulated world, leaching and runoff of nutrients caused by over-application are not merely wasted money and crop potential, but could result in the grower being fined thousands of dollars, reclamation fees and civil judgements. Fertility management plan modifications, when based on NovaCrop sap analysis, and coupled with soil analysis, improves fertilizer use efficiencies and decreases over application of nutrients.

