


Organic agriculture has increased in popularity in recent decades due to its reputation as an environmentally friendly alternative to conventional agriculture. However, significant improvements to organic practices must be implemented to ensure adequate, sustainable productivity in both organic and conventional systems. Nutrient management in organic agriculture requires further investigation to provide information on nitrogen availability to organic growers for agronomic reasons as well as prevent environmental consequences from nutrient loss in agricultural fields. In conventional agriculture, and in limited instances in organic agriculture, the nitrate quick test can be used before the exponential growth phase to determine available nitrate (Bundy and Andraski 1995). However, in contrast to conventional N-containing fertilizers, N management in organic vegetable systems is a challenge because complex organic forms of N, which originate from crop residues, compost, manures and other organic materials, require mineralization by microbes to become plant-available (Drinkwater and Snapp 2007). In addition to environmental and agronomic concerns, legislation has been passed to limit the application of N to agriculturally managed fields in California through the California Regional Water Quality Control Board. With all this in mind, it is important to understand what affects N availability to plants as well as what may sequester N in the soil.
Process of Nitrogen Mineralization
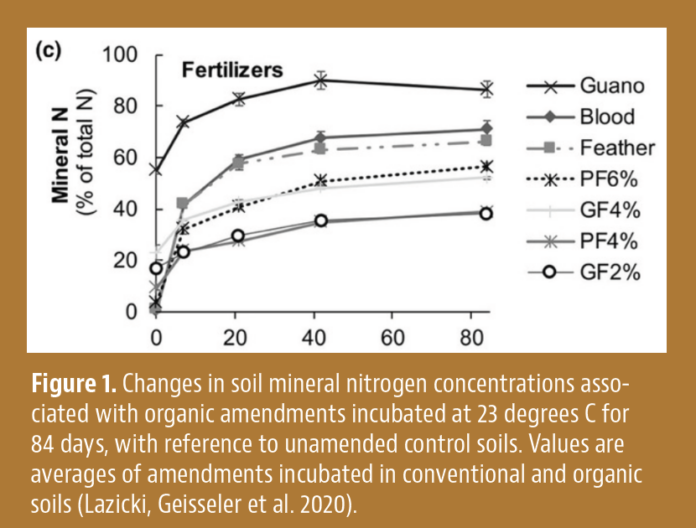
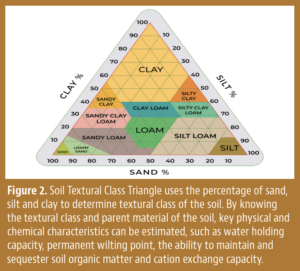
In organic agriculture, N is applied in the form of proteins, DNA and other N-containing organic molecules, which must go through the process of microbial decomposition to become available to plants (Drinkwater and Snapp 2007). Organic N is first converted to ammonium (NH4-N) by microbial populations and, in aerobic conditions, is subsequently oxidized to nitrate (NO3-N). Manure must go through a similar process for the majority of its N-containing molecules but may also contain some mineral N. Microbial decomposition and release of inorganic N to the soil solution, or N mineralization (N-min), depends on many factors, such as soil temperature, moisture and texture as well as carbon to nitrogen (C:N) ratio of the microbial substrate (Figure 1) (Lazicki, Geisseler et al. 2020). The wide variety of soil orders in combination with seasonal temperatures and environmental conditions make predicting N-min difficult. Knowing the textural class and parent material of the soil being farmed can save a lot of time with nutrient and irrigation efficiencies when acquiring a new piece of ground. By knowing the textural class (Figure 2) and parent material of the soil, key physical and chemical characteristics can be estimated, such as water holding capacity, permanent wilting point, the ability to maintain and sequester soil organic matter (SOM) and cation exchange capacity. This gives the grower a bit more insight into the field’s characteristics and its capacity to retain and provide nutrients to plants.
Nitrogen Mineralization Studies on Soil Organic Matter and Amendments
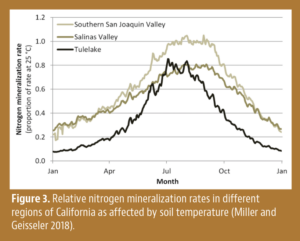
Studies have been performed in conventional agricultural fields to determine temporal patterns of N-min from SOM, however studies of N-min from SOM in agricultural fields on the central coast of California are limited (Miller and Geisseler 2018). Agricultural crops require more N than can typically be mineralized from SOM during a vegetable crop’s growing season (Figure 3). In addition, the temporal pattern of N released from SOM may not line up with patterns of crop uptake, which leads to the need for applications of commercial N sources. Studies have been done looking into contributions of N from SOM and an organic amendment of composition 4-4-2 (4% N, 4% P2O5 and 2% K2O) in vegetables on the central coast; however, the investigation of longer-season vegetables in a multitude of soil textures is limited (Smith, Cahn et al. 2022). Longer-term temporal mineralization of N from SOM and organic amendments in different soil textures is warranted. It is likely the N dynamics of SOM and organic amendments vary between crops with short or long growing seasons, such as spinach and butter lettuce, which are in the ground for 30 to 45 days, compared to longer-term crops, such as broccoli and cauliflower, which are in the ground closer to 90 days.
Influence of Soil Texture on Nitrogen Mineralization
Soil texture influences the level of mineralization with varying quantities of pore space, clay content, cation exchange capacity, surface area of particles, water holding capacity, plant available water and potential for organic matter accumulation as well as microbial activity and substrate protection (Feller and Beare 1997). In soils with a high clay content, SOM may be protected by soil aggregates and thus present a lower N-min rate compared to a sandy soil with SOM that is labile and unprotected (Hassink, Bouwman et al. 1993). Ros (2012) found N-min was primarily related to the size of total and extractable organic matter fractions, whereas variables reflecting soil texture were less important. However, other studies have found texture to be an important part of regression models predicting N-min from SOM (Miller, Aegerter et al. 2019). N-min from SOM depends on many factors, with two of the most important shown to be soil temperature and soil texture. Moisture is also an important variable but is held constant in laboratory incubations (Miller, Aegerter et al. 2019). Temperature sensitivity of N-min from SOM in agricultural soils has been investigated by Miller et al. (2018) and was found to be significant, especially in cropping systems where crops are grown year-round (Miller and Geisseler 2018). As both soil texture and temperature have been shown to affect N-min in SOM, we expect to see both characteristics influence N-min in organic amendments. With contrasting evidence of the importance of texture in N-min from SOM, many organic fields with varying soil textures are needed to provide an optimal research environment.
Particulate and Mineral Associated Organic Matter
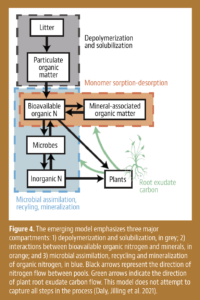
Particulate organic matter (POM) and mineral-associated organic matter (MAOM) are two types of organic matter generally associated with carbon sequestration and N cycling. The MAOM fraction forms through associations between the organic matter and the soil minerals helping to determine the chemical properties and stability of the interactions (Daly, Jilling et al. 2021). Particulate organic matter is primarily composed of N-containing polymers from decomposing plant matter, bacterial waste and microorganism byproducts. The balance between MAOM and POM depends on the sorption and desorption potential of the soil minerals. Emerging frameworks suggest while depolymerization is a rate-limiting step to N-min, bioavailable organic N may be driven by other factors (Figure 4). At this point, more investigation into how POM and MAOM effect N-min needs to occur.
Soil Incubations to Determine Mineral Nitrogen
While laboratory incubations of organic amendments have been performed to determine the timeline of mineralization or immobilization of N under controlled conditions, investigation to determine if in situ field studies match predicted mineralization rates is required (Lazicki, Geisseler et al. 2020). Several models have been used to fit N-min dynamics, yet a reliable model that provides a high R2 value across different environments is elusive (Miller, Aegerter et al. 2019, Morvan, Beff et al. 2022). Further work on in-field incubations using undisturbed soil cores in organic broccoli fields are being performed on the Central Coast using data collected from 2023 to 2025.
With the increasing demand for organic production, a firm understanding of N-min dynamics will be a key piece of information for farms to remain profitable as well as limit environmental pollution. While a fool-proof estimation of N-min is yet to be discovered promising physical, chemical and biological characteristics of the soil, such as soil texture, SOM fraction and quantity, microbial respiration and the percent of N within the soil are all promising measures.
References
Bundy, L. G. and T. W. Andraski (1995). “Soil yield potential effects on performance of soil nitrate tests.” Journal of Production Agriculture 8(4): 561-568.
Daly, A. B., et al. (2021). “A holistic framework integrating plant-microbe-mineral regulation of soil bioavailable nitrogen.” Biogeochemistry 154(2): 211-229.
Drinkwater, L. E. and S. S. Snapp (2007). Nutrients in Agroecosystems: Rethinking the Management Paradigm, Elsevier: 163-186.
Feller, C. and M. H. Beare (1997). “Physical control of soil organic matter dynamics in the tropics.” Geoderma 79(1-4): 69-116.
Hassink, J., et al. (1993). “RELATIONSHIPS BETWEEN SOIL TEXTURE, PHYSICAL PROTECTION OF ORGANIC-MATTER, SOIL BIOTA, AND C-MINERALIZATION AND N-MINERALIZATION IN GRASSLAND SOILS.” Geoderma 57(1-2): 105-128.
Lazicki, P., et al. (2020). “Nitrogen mineralization from organic amendments is variable but predictable.” Journal of Environmental Quality 49(2): 483-495.
Miller, K., et al. (2019). “Relationship Between Soil Properties and Nitrogen Mineralization in Undisturbed Soil Cores from California Agroecosystems.” Communications in Soil Science and Plant Analysis 50(1): 77-92.
Miller, K. S. and D. Geisseler (2018). “Temperature sensitivity of nitrogen mineralization in agricultural soils.” Biology and Fertility of Soils 54(7): 853-860.
Morvan, T., et al. (2022). “An Original Experimental Design to Quantify and Model Net Mineralization of Organic Nitrogen in the Field.” Nitrogen 3(2): 197-212.
Ros, G. H. (2012). “Predicting soil N mineralization using organic matter fractions and soil properties: A re-analysis of literature data.” Soil Biology & Biochemistry 45: 132-135.
Smith, R., et al. (2022). “Fine-tuning fertilizer applications in organic cool-season leafy green crops can increase soil quality and yields.” California Agriculture 76(2-3): 77-84.


 Invading California")

