Home Blog Page 10

Properly Timed Foliar-Applied Urea and Phosphite Increase Citrus Yield and Fruit Size

0

The goal of properly timed foliar-applied fertilizer is to increase the economic benefit derived from the grower’s fertilization program. In this strategy, fertilizer is applied at key stages in citrus tree phenology (the series of developmental events that result in fruit production and tree growth) (Figure 1). Key stages of tree phenology are associated with important physiological and developmental processes. The fertilizer application is timed to stimulate a specific physiological process and achieve a plant growth regulator effect that increases flowering, fruit set, yield, fruit size or fruit quality, even when the tree is not deficient in the applied nutrient based on standard leaf or other tissue analyses. Properly timing the fertilizer application is important because the developmental stage of the target organ determines the result obtained. 

Figure 1. Key stages of citrus tree phenology from left to right: flowering, fruit set, fruit development (exponential fruit growth), fruit maturation and flushes of shoot and root growth.


Winter Applications Increase Yield and Fruit Size 

The key stage of citrus tree phenology being targeted is bud determinacy, the irreversible commitment of buds that transitioned from vegetative shoot development to floral development in the fall to produce inflorescences and flowers. When a bud is determined, it can no longer revert to vegetative shoot growth. At the microscopic level, bud determinacy is identified by the initiation of sepals, the green outer leaves that cover and protect the developing floral bud (Lord and Eckard 1987). Due to annual variations in temperatures and the fact that not all shoots and buds are the same age or at the same stage of development, January 1 through February 15 is an effective window within which to make foliar applications of urea or potassium phosphite to increase flowering in citrus. 

Low-biuret urea (46% N, 0.25% biuret, 25 lb N/acre or a 50 lb bag of low-biuret urea per acre) applied in mid-January to target irreversible commitment to flowering in ‘Washington’ navel orange trees resulted in a net increase in three-year cumulative yield of 17,355 lb/96 trees/acre compared to control trees receiving five-fold more urea applied to the soil. Delaying the foliar-application of low-biuret urea to mid-February resulted in a net increase in three-year cumulative yield of 13,757 lb/96 trees/acre. In both cases, yield of commercially valuable size fruit of packing carton sizes 88+72+56 (2.7 to 3.5 inches in transverse diameter) increased as total yield increased (Ali and Lovatt 1994). Similarly, potassium phosphite as Nutri-Phite (0-28-26; Verdesian Life Sciences), which supplies P as PO3, not PO4, applied at 0.64 gal/acre in January to target irreversible commitment to flowering of Valencia orange trees in Florida resulted in an average net increase of 900 inflorescences per 12-inch square frame, a 166% increase in inflorescence number compared to untreated control trees, and produced a net increase in yield of 6,853 lb/acre (Albrigo 1991). In a second experiment, foliar-applied Nutri-Phite (0-28-26, 0.64 gal/acre) in January resulted in a net increase in four-year cumulative Valencia orange yield of 25,247 lb/acre, an average net increase of 6,311 lb/acre/year for the four years of the experiment, with an average net increase of more than 400 lb total soluble solids per acre per year (Albrigo 1991).

Summer Applications Increase Yield 

The key stage of phenology being targeted is maximum peel thickness, which marks the end of Stage I of fruit development in citrus in which fruit growth is predominantly by cell division, and the beginning of Stage II of citrus fruit development, the period of exponential fruit growth by cell expansion. At maximum peel thickness, all the cells that make up the mature fruit are present. Subsequent fruit growth is by the uptake of water into the juice sacs. The cells of the albedo, the white layer of the peel, simply stretch to accommodate the increasing size of the juice sacs; only the flavedo, the outer colored layer of the peel, continues cell division through harvest. The goal is to stimulate additional cell divisions just prior to maximum peel thickness. One additional cell division would double the number of cells in the fruit, a second cell division would quadruple the number of cells, etc. When these additional cells enlarge, fruit size is increased. Field research with navel orange, Valencia and mandarin cultivars documented the efficacy of foliar applications of low-biuret urea or potassium phosphite made between the last week of June and mid-July.

Foliar-applied low-biuret urea (46% N, 0.25% biuret, 25 lb N/acre) in early July to target maximum peel thickness in ‘Washington’ navel orange trees resulted in a net increase in yield of commercially valuable size fruit of packing carton sizes 88+72 (2.7-3.15 inches in transverse diameter) of 4,927 lb/109 trees/acre/year and a net increase in yield of larger fruit of packing carton size 56 (3.2 to 3.5 inches in transverse diameter) of 3,374 lb/109 trees/acre/year compared to untreated control trees (Lovatt 1999). 

To stimulate cell division prior to maximum peel thickness, Nutri-Phite was applied at 0.49 gal/acre in mid-May and again in mid-July. Nutri-Phite produced a net increase in fruit of packing carton sizes 88+72 of 5,078 lb/109 trees/acre/year with a net increase in yield of larger fruit of packing carton size 56 of 4,158 lb/109 trees/acre/year. The Nutri-Phite treatment also increased fruit total soluble solids (TSS) by early November compared to the untreated control (P < 0.001), achieving a TSS:acid ratio of 8.1 by early November compared to 7.2 for fruit from untreated control trees (P < 0.01) (Lovatt 1999). 

Application and Flowering Physiologies

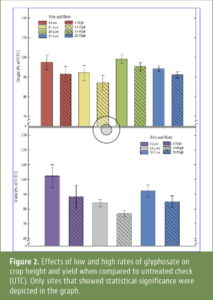
It is well known that flowering in citrus is induced by low temperature (LT ≤59 degrees F day/ ≤50 degrees F, but >7 degrees F night) and by water-deficit stress (WD ≤-2.4 MPa stem water potential) for eight weeks. Inflorescence and flower number both increase as the duration of the LT or WD period increases. Citrus is unique in the plant world. Not only does flowering increase with the increased duration of WD, but also with the increasing severity of WD (Figure 2). 

Figure 2. The figure on the left illustrates that flowering in lemon trees increases as the severity of water-deficit stress increases (the numbers on the x-axis become more negative.) Water-deficit stress is measured as predawn xylem pressure potential (PDXPP) in MegaPascals (MPa). The figure on the right demonstrates that flowering increases with the increased number of days lemon trees are maintained at a moderate water-deficit stress (-2.4 MPa PDXPP). After Hake (1995)


In the late 80s, my lab discovered that leaf ammonium concentrations increased with the increased duration of both LT and WD and that leaf ammonium concentrations increased in parallel with the increase in both inflorescence number and flower number in response to the duration of LT or WD (Lovatt et al. 1988a, b). Since urea applied to leaves is catabolized by the plant enzyme urease to ammonia and carbon dioxide (NH3 and CO2), my lab tested the capacity of foliar-applied urea to supplement ammonium accumulation during LT and WD and increase citrus flowering. For navel orange trees exposed to a 50% or 25% shorter period of low temperature, foliar-applied low-biuret urea increased flowering 194% and 230%, respectively. Foliar-application of low-biuret urea to lemon trees maintained at a moderate WD (-2.4 MPa predawn xylem pressure potential) at the end of the 50-day stress period increased flowering 260% compared to WD-treated trees not receiving foliar-applied low-biuret urea (Lovatt et al. 1988a, b). At the level of gene transcription, new evidence suggests that LT and WD initiate flowering through overlapping genetic pathways (Tang and Lovatt 2022). Thus, WD provides a tool to increase citrus flowering in growing areas experiencing warmer, dry winters, with foliar-applied low-biuret urea or potassium phosphite able to supplement both LT and WD to increase citrus flowering. 

These Different Molecules Share the Same Benefits, but How?

Recent evidence suggests that both urea and phosphite increase tree nitrogen status and cytokinin biosynthesis. In both roots and leaves, nitrate and ammonium upregulate the expression of the key gene regulating cytokinin biosynthesis, IPT, the gene encoding isopentenyl transferase, which catalyzes the rate-limiting step in cytokinin biosynthesis (Sakakibara 2006; Sakakibara et al. 2006). Nitrate taken up by roots and cytokinin synthesized in the roots move in the xylem to the shoots and leaves, where nitrate upregulates the genes for N assimilation and the IPT gene for cytokinin biosynthesis. Cytokinin and metabolites synthesized in the leaves are then transported in the phloem to the roots. Thus, N and cytokinins work together to promote and coordinate root and shoot growth, bud break and flowering. Ammonium derived from foliar-applied urea would stimulate N assimilation and upregulate cytokinin biosynthesis. Cytokinins are known to promote flowering and fruit growth.

Surprisingly, phosphite was recently demonstrated to upregulate key genes for N assimilation, resulting in increased nitrate uptake (Vereet et al. 2021) and, as predicted by the information presented above, phosphite increased cytokinin biosynthesis (Swarup et al. 2020). Phosphite supplied to roots resulted in significantly greater cytokinin concentrations one day after phosphite treatment (P ≤0.05). Root cytokinin concentrations continued to increase during the week-long experiment to a level greater than untreated control plants (P ≤0.05).

The Window for Increasing Flowering is Now

 Citrus flowering is induced by LT and WD stress. WD stress of approximately -2.4 MPa stem water potential can be maintained by deficit-irrigation, and thus WD can be used to supplement LT in citrus areas with warmer, dryer winters due to global climate change. Winter prebloom foliar-applied urea and Nutri-Phite can be used to supplement LT and WD stress to increase citrus flowering and yield. In addition, summer foliar-applied low-biuret urea or Nutri-Phite can be used at maximum peel thickness to further increase fruit size and yield of commercially valuable size fruit. In light of recent research results, foliar-applied urea and Nutri-Phite likely achieve a plant growth regulator effect by increasing N assimilation and cytokinin biosynthesis. 

Foliar fertilizers should be applied in sufficient water for good canopy coverage (at a final pH of 5.5 +/- 0.5), but not to run off, which is a waste of product. Pooling of fertilizers at the leaf tip can result in tip burn. The application should be like a pesticide spray with good canopy mixing and coverage of the upper and under surfaces of the leaves on the exterior and interior of the canopy and the target organ. Always follow the product label. Results cited for properly timed foliar-applied potassium phosphite reported herein are for Nutri-Phite, Verdesian Life Sciences, the only commercial product for which results appear in peer-reviewed journals.

References

Albrigo, L.G. 1991. Effects of foliar applications of urea or Nutri-Phite on flowering and yields of Valencia orange trees. Florida State Hort. Soc. 112:1-4.

Ali, A. and Lovatt, C.J. 1994. Winter application of low-biuret urea to the foliage of ‘Washington’ navel orange increased yield J. Amer. Soc. Hort. Sci. 119:1144-1150. 

Hake, K.D. 1995. Regulation of Flowering in Citrus limon by water-deficit stress and nitrogen compounds. PhD Dissertation, University of California, Riverside. 149p.

Lord, E.M. and Eckard, K.J. 1987. Shoot development in Citrus sinensis L. (Washington navel orange). II. Alteration of developmental fate of flowering shoots after GA3 treatment. Bot. Gaz. 148:17–22

Lovatt, C.J. 1999. Timing citrus and avocado foliar nutrient applications to increase fruit set and size. HortTechnology 9:607-612. 

Lovatt, C.J., Zheng, Y. and Hake, K.D. 1988a. A new look at the Kraus Kraybill hypothesis and flowering in Citrus. 6th. Intl. Citrus Congr. 1:475-483.

Lovatt, C.J., Zheng, Y. and Hake, K.D. 1988b. Demonstration of a change in nitrogen metabolism essential to floral induction in Citrus. Israel J. Bot. 37:181-188.

Sakakibara, H. 2006. Cytokinins: Activity, biosynthesis, and translocation. Annu. Rev. Plant Biol. 57:431-449.

Sakakibara, H. Takei, K. and Hirose, N. 2006. Interactions between nitrogen and cytokinin in the regulation of metabolism and development. Trends in Plant Science 11: 40-448.

Swarup, R., Mohammed, U., Davis, J. and Rossall, S. 2020. Role of phosphite in plant growth and development. White paper, School of Biosciences, Univ. Nottingham. 

Tang, L. and Lovatt, C.J. 2022. Effects of water-deficit stress and gibberellic acid on floral gene expression and floral determinacy in ‘Washington’ navel orange. J. Amer. Soc. Hort. Sci. 147(4):183-195.

Verreet, J.-A., Prahl, K.C., Loof, S. Birr, T. Klink, H., Cai, D. Xu, S. 2021. Phosphite plant biostimulant mode of action: gene expression, phytohormone levels, enzyme activity. Electronic Biological Inorganic Chemistry PO3 Workshop. (Christian-Albrechts-University of Kiel, Germany).

Irrigation Tools and Information for Efficient Water Management in California Avocado Production Systems

0
Figure 1. a) An aerial view of the flux tower from a distance;

In California, avocados are primarily grown in southern and central parts of the state along the coast. These regions face uncertain water supplies, mandatory reductions of water use and the rising cost of water, while efficient use of irrigation water is one of the highest conservation priorities. Data on water use by avocado orchards and optimal irrigation strategies needs to be updated in light of increasing water pressure in order to achieve efficient water and fertilizer management. Moreover, due to increasing salinity in water sources, effective irrigation is more critical to ensure optimal yield and high-quality fruit as avocados are one of the most salt-sensitive crops.

An ongoing irrigation study aims to acquire relevant information on crop water consumption and develop more accurate crop coefficient curves over the season for avocados under different environment and cropping systems in southern California. Extensive data collection is being conducted in nine mature avocado sites in San Diego, Temecula, Orange and Ventura counties using combined cutting-edge ground- and remote-sensing technologies. A combination of surface renewal and eddy covariance equipment (flux tower, Figure 1) are utilized to measure actual crop evapotranspiration to develop crop coefficient curves at each site. Several other sensors and equipment are being used to monitor soil and plant water status and soil salinity, and high-resolution images are being captured by unmanned aerial systems to evaluate canopy features. This article provides some avocado water management tips based on the preliminary findings of this study. 

Figure 1. a) An aerial view of the flux tower from a distance;
Figure 1. b) a ground view of the tower;
Figure 1. c) a close look from the top of the flux tower demonstrates net radiometer sensor and two fine thermocouple sensors at one of the avocado experimental sites.


Variable Spatial and Temporal Crop Water Needs

The results from the avocado experimental sites demonstrate considerable variability in avocado consumptive water use, both spatially and temporally. The cumulative avocado consumptive water use (actual evapotranspiration or ET) across two sites in Temecula (site 1 with an elevation of 1,490 ft. above sea level) and in the San Pasqual Valley, Escondido (site 2 with an elevation of 720 ft. above sea level) varied from 28.1 in. to 38.5 in. over a 235-day period (Figure 2). The average daily actual ET was 0.18 in d-1 in June/July at site 2, while the amount was 0.14 in d-1 at site 1 for the same period. This is a notable difference of actual ET between these two sites. More uniform daily crop water consumption over the summer period occurred at site 2 when compared with site 1 located at a higher elevation.   

Figure 2. Daily actual evapotranspiration at avocado site 1 and over 235-day period (April 14, 2022 through December 4, 2022). Considering daily actual ET measured and tree spacings, the average crop water consumption during this period was determined to be 40.8 gallons per day per tree at site 2 and 20.1 gallons per day per tree at site 1. Tree spacings were different at the two sites, so per-tree use varies more than the per-area ET as mentioned above.


Crop Coefficient Values a Valuable Tool 

To estimate crop water requirements, various crop coefficient (Kc) values of 0.64 (Grismer et al. 2000), 0.72 (Gardiazabal et al. 2003) and 0.86 (Oster et al. 2007) were reported for “Hass” avocado. Kc value is greatly impacted by differences in climatic conditions, canopy features (size of crop canopy and shaded area), row orientation, soil and irrigation water salinities, and amounts and frequencies of water applied. The question is, can we use a single crop coefficient the entire season that is based upon data developed decades ago that does not consider the impacts of plant density, row orientation and microirrigation? Can this value be used for different avocado regions in California? 

Figure 3, see page 10 demonstrates the trend of daily actual crop coefficient values over a 235-day period at avocado site 2. More variations in water use were found during fall months when compared with spring and summer months. Average crop coefficient values of 0.77, 0.72 and 0.81 were determined for the periods of April to May, June to mid-October, and mid-October to early December, respectively. Lower crop coefficient values were obtained at site 1. It needs to be noted that these sites haven’t been under water stress and/or salinity stress most of the study period while due to the two heat waves in late June and early September, trees could experience heat stress for a while. The continuous measurements across the experimental sites will provide a comprehensive data set to update and develop more accurate crop coefficient curves for avocados at each site. These crop coefficient curves could be considered as an effective tool for irrigation management in California avocado production systems.  

Figure 3. Actual crop coefficient values determined at the avocado experimental site 2 in Escondido. The orchard has a south-facing slope and the dominant soil texture is sandy loam.


Soil Moisture Sensing 

Understanding the effects of irrigation events on soil moisture provides critical insight for growers about the present growing environment for crops. While experienced growers have learned over seasons of observations how their soils and water interact, utilizing a soil moisture measuring device of some sort enables them to put a number on their observations and more accurately track trends over time.

The sensors allow growers to better understand the frequency and duration of irrigation events needed and to maintain adequate moisture based on the crops being grown. There are instances where irrigation cycles are occurring too often and for far longer periods than needed to achieve field capacity of the rooted volume of soil. There are also instances where the use of sensors revealed malfunctioning irrigation system components by reporting unusually dry soil in areas that should have received ample irrigation. Soil moisture sensing is contingent on having a well-maintained irrigation system with a good distribution uniformity. Soil moisture sensors should be used as a useful tool to answer the following critical questions:

What is the water status of the soil early in the irrigation season?

When is the right time for the first and subsequent irrigation events? 

Is the soil profile full after each irrigation event? 

What is the length of irrigation time?

Should the irrigation practice be changed?

An example of the use of soil moisture monitoring at site 1 over a six-month period is shown in Figure 4. Half-hourly soil water tension was plotted for multiple depths (6”, 12” and 18”). The data shows that soil water was maintained at a desired level within the crop root zone at this site due to the frequent drip irrigation events. Although the average soil water tension varied over time in the top 18 in. of the soil, it never declined below 5 centibars and never exceeded 56 centibars over the period. The average values at 6”, 12” and 18” deep over the period were 20.1, 11.5 and 9.0 centibars, respectively. The soil moisture data at this site indicates that the irrigation frequency was scheduled properly while shorter irrigation runs could be considered in each irrigation event to improve irrigation efficiency. 


Figure 4. Half-hourly soil water tension (centibar) measured at depths of 6”, 12” and 18” at avocado site 1 over a six-month period (March 14, 2022 through October 13, 2022).

Soil Types and Conditions, Canopy Features and Row Orientations

Avocado is one of the most salinity sensitive crops produced in California but is commonly grown in areas where poor quality is common. In recent years, salinity problems in California avocado have become increasingly common as the cost of irrigation water has risen and the availability of low salinity water for agriculture has diminished. 

The source of water across the six avocado experimental sites in San Diego, Temecula and Orange counties have an ECe greater than 1.0 dS m-1 and chloride >100 ppm. Across the sites, the maximum soil ECe of the top 1 foot was measured (3.4 dS m-1) at a site with 28-year-old trees and a silty loam soil texture in Orange County. A high chloride content (311.3 ppm) was also measured in the top 1 foot. A leaf chloride percentage of 0.465 was observed in early September at this orchard. Under such circumstances, yield improvement could be gained for the avocado orchard with increasing amounts of applied water to leach salt and particularly chloride from the effective crop root zone. Excess irrigation can be considered as beneficial water use for salinity management in avocado groves while the optimal leaching strategy could be different from site to site depending on soil types and salinity status, quality of irrigation water and irrigation system.     

Ground shading percentage or canopy cover that provides a good estimation of canopy size/volume (Figure 5) and the amount of light that it can intercept is likely the most important driver influencing crop water needs. At the experimental sites, canopy vegetation cover percentage for each tree derived from drone-based multispectral imagery ranged from 0% (missing trees) to 100%. For instance, the canopy cover varied from 33.5% to 98.9% with tree spacings of 15 ft. × 18 ft. at site 1 versus 40.3% to 94.5% at site 2 with tree spacings of 20 ft. × 20 ft. The average canopy cover was 71.6% and 85.4% around the flux towers at site 1 and site 2, respectively. This clearly indicates that site 2 has a greater light interception, and as a result, greater crop water needs are expected when compared with site 1 (Figure 2). 

Figure 5. Polygons RGB Mosaic of avocado trees at site 2 (top) and avocado tree centers and polygons at site 1 (bottom). Trees at both experimental sites (around monitoring stations) have a south-facing slope orientation.


Both sites 1 and 2 have a south-facing slope orientation which means there is unlikely to be a notable impact from slope differences on the crop water use between the two sites. Avocado sites with north- and east-facing slope orientations are expected to have lower crop water needs even in a single orchard, and accordingly sometimes a different irrigation schedule is required for different zones under different orientations in an avocado orchard.  

The Key to Building a Soil that Can Suppress Pathogens Naturally

Figure 1. Disease suppressive soils are defined as soils that naturally defend against pathogenic diseases before the disease attacks a growing crop, or the pathogen can infect the crop but the disease declines with successive cropping.

When it comes to managing soilborne plant diseases, methods for reducing or eliminating the impact of pathogens have heavily relied on selecting a resistant plant variety and the use of pesticides for protection. However, the soil, and specifically the biological component consisting of microbes, can be another tool growers can leverage to help protect their crops from soilborne diseases.

Healthy soil and a healthy crop can lead to reduced disease incidence, an idea that is becoming more widely accepted across the agriculture industry. Many questions arise with this concept: How are soil health and soilborne plant diseases related? Can soil health result in less plant disease increase pressure? What are the mechanisms behind this phenomenon? In this article, we will discuss and address these questions and take a deep dive into a phenomenon known as disease suppressive soil (DSS). 

Microbes Are the Key 

The activity of soil microbes or communities of microbes is what gives rise to a soil’s disease suppressive properties. As you can imagine, the soil is a complex system, and understanding the mechanisms that contribute to DSS is extremely intricate. Imagine the interactions between beneficial and pathogenic microbes as a battlefield belowground. In the case of DSS, the beneficial microbes win. Just like on a battlefield, many tactics, strategies and tools are needed to overcome your opponent; and the same is true for soil microbes. Multiple mechanisms from increasing soil and plant health to directly impacting pathogenic microbes are used by soil microbes in the battle between beneficial and pathogenic. 

Soil microbes play a key role in soil health and soil quality, which in return affect the degree of disease suppression in the soil. Soil microbes have multiple ways in which they suppress disease in the soil, including the improvement of plant health, inducing natural defense response in the host plant, secreting enzymes and antibiotics, and through microbial competition.

Defining Suppressive Soils and Why They Matter

DSS are defined as soils that naturally defend against pathogenic diseases before the disease attacks a growing crop, or the pathogen can infect the crop but the disease declines with successive cropping (Figure 1). Soils can do this through reducing the establishment or growth of pathogenic fungi or bacteria due to the makeup of their microbiome (the communities of fungi and bacteria that are living in the soil.) Soils can keep disease development at a minimum even in the presence of a susceptible host and disease-causing pathogen. 

Figure 1. Disease suppressive soils are defined as soils that naturally defend against pathogenic diseases before the disease attacks a growing crop, or the pathogen can infect the crop but the disease declines with successive cropping.

DSS can be naturally occurring but may also be developed over time through cropping practices. To help clarify, we can divide suppressive soils into two categories: general suppression and specific suppression (Figure 2). 

Figure 2. Disease suppressive soils can be naturally occurring but may also be developed over time through cropping practices. They can be categorized by general suppression and specific suppression.

General suppression gives protection towards multiple pathogenic microbes. The increase in the abundance (number of microbes) and diversity (which microbes are present) of soil microbes is key in general suppression. These soil microbes out-compete pathogenic microbes, which in turn creates general suppression. Agricultural practices can impact this type of suppression with practices such as soil sterilization reducing it and good soil health practices enhancing it. 

Specific suppression can occur naturally (long-standing) or be induced. Long-standing specific suppression is associated with a specific species of microbes or group of microbes and is naturally found in the soil without the presence of a plant. Induced specific suppression can be produced through monoculture of a crop, growing susceptible crops or by mixing small amounts of a suppressive soil into a conducive soil. 

So, why should we care about DSS? As we move forward in modern agriculture, restriction of fumigants and pesticides as well as the lack of available resistant cultivars will only make these soilborne diseases harder to manage. DSS are another tool growers can use to help manage difficult-to-control soilborne diseases.

Soil Microbial Battleground

Beneficial soil microbes have a direct impact on their pathogenic counterparts, but on the battlefield, the beneficial soil microbes can outcompete their pathogenic counterparts, leading to greater numbers of beneficial soil microbes. Underground, beneficial soil microbes use up the exudates and nutrients created and released by the host plant, blocking the pathogenic microbes from accessing and utilizing the resources needed to survive. 
During the battle, the soil microbes can display hyperparasitism, where they infect pathogenic microbes present in the soil that pose a threat to the crops around them. Plus, the microbes can cause additional impact on their pathogenic microbial counterparts by secreting antibiotic-like enzymes and toxins in a process called antibiosis. Antibiosis is a competitive tactic that kills other pathogenic microbes and increases their ability to battle and defend themselves and the host plant from pathogens. 

The health of the host plant above the ground is impacted by the soil health under the ground. The structure of the soil plays a direct role in plant health in terms of water infiltration, retention, soil compaction and access to nutrients. Soil microbes are to key to improving soil structure through increased soil aggregation, and aid in the release of mineral nutrients through a conversion process called nutrient mineralization. Soil microbes secrete exudates that can trigger disease-resistant responses for host plants. All these factors aid in improved plant health and performance. 

Soil Health Impact 

In the soil microbe-pathogen battleground, what exactly are these microbes battling for? For the pathogenic microbes, they are battling to infect the host plant. To understand the complexity and how soil health and microbes play a role in plant disease and DSS, we need to review the disease triangle (Figure 3). For disease to occur, there must be three components (representative of the sides of a triangle):

Susceptible host

Conducive environment

Virulent pathogen

If one of these sides is removed, plant disease is not possible. The environment side of the triangle is where we need to focus as this is the side that includes soil health and holds the key to creating disease suppressive soils.

Figure 3. Disease triangle. For disease to occur, there must be three components, representative of the sides of a triangle. The environment side of the triangle shows the impact of soil health and microbes on the ability for disease to occur.


The physical and chemical properties of the soil, including pH, soil organic carbon and nutrients, provide the habitat for microbial activity. Crop management practices such as tillage, irrigation, fertilization, the addition of green manures and weed management can directly impact the soil environment and microbial activity in the soil. Many of the factors mentioned here directly impact microbial activity and communities and are the key to soil health. Many of the factors mentioned here directly impact microbial activity and communities and are the key to soil health. As we know, there are tools and inputs to help improve soil health, meaning that if we manipulate the environment (the soil) and remove one side of the disease triangle, we can reduce plant disease infection. Therefore, improving soil health can lead to general DSS (Figure 4). 

Figure 4, How soil health is related to general disease suppression and the agricultural practices that impact soil health leading to general disease suppression.


What about specific disease suppression? If we recall, long-term monocropping can be used to achieve specific suppression in some systems, which is contradictive of soil health practices. The literature has noted the ability to achieve specific disease suppression by using compost and green manures. However, increasing soil health and increasing microbial communities is the best practice to achieve and improve general suppression and increase crop productivity. 

Managing the Soil to Achieve Disease Suppressive Soil 

Soil microbes are key to DSS, and soil health directly impacts the makeup and activity of soil microbes. DSS can be negatively or positively impacted by cropping systems and management practices. Soil management practices that positively influence DSS include crop rotation, intercropping, minimum tillage practices, fertility or organic inputs such as manures and composts. In addition, adding liable carbon sources as a food source for microbes will increase the abundance and diversity of soil microbes, which is critical in general suppression. Crop rotation is an important factor; rotating to a non-host can aid in reducing soilborne diseases and positively impact soil microbial diversity. What we know to date is that suppressive soils are usually mediated through soil microbial community shifts overtime, so adopting practices and amendments that increase soil health and organic matter and increase the diversity and abundance of microbial activity in your soils will aid in suppressing soilborne diseases.

Battle for a Sustainable Solution to Soilborne Diseases   

DSS can be a tool for soilborne disease management. Adapting soil health practices and increasing the soil microbial activity is a sustainable agricultural practice that will be key in the coming years. Building and maintaining suppressive soils can provide a solid foundation for crops to thrive. We’ve discussed the key to DSS (microbes) and contribution to a soil’s disease suppressive properties. Focusing on the improvement of soil health and natural defense response belowground is a good first step toward the achievement of healthy crops that are protected against soilborne disease.
Resources

Disease Suppressive Soils: New Insights from the Soil Microbiome- https://doi.org/10.1094/PHYTO-03-17-0111-RVW

Disease-Suppressive Soils—Beyond Food Production: a Critical Review- https://www.ncbi.nlm.nih.gov/pmc/articles/PMC7953945/ 

Current Insights into the Role of Rhizosphere Bacteria in Disease Suppressive Soils- https://doi.org/10.3389/fmicb.2017.02529 

Plant Health Management: Pathogen Suppressive Soils- https://doi.org/10.1016/B978-0-444-52512-3.00182-0

Fine-Tuning with Soil Health; Soilborne Disease?- https://csanr.wsu.edu/fine-tuning-soilborne-disease/

Developing Disease-Suppressive Soil Through Agronomic Management- https://www.researchgate.net/publication/292011599_Developing_Disease-Suppressive_Soil_Through_Agronomic_Management 

Phosphate vs Phosphite: Part One

0
Hands with leaves
Though phosphite is not the best nutritional source of phosphorus, it can serve as a carrier and catalyst for quick nutrition supplements and responses to nutrient deficiencies.
Phosphite has been a controversial topic for years. Its use and benefits are argued in hundreds of research papers across the world’s scientific communities. Is it a fertilizer, a biostimulant or a fungicide? These questions are discussed in multiple university research results. I believe that if we look carefully, we can conclude phosphite serves all three functions. As with everything we do with chemicals and nutrition, we need to be aware of possible negative effects. We also need to determine how we are using the phosphite materials and the results we are seeking.

First, we need to understand and differentiate between phosphate and phosphite. There is often a lot of confusion here.

It Starts with Phosphorus
Phosphorus (P) is an essential major macronutrient. It is required by all living organisms. It is a limiting nutrient that controls growth in many ecosystems. P in living systems occurs mainly in the form of inorganic phosphate as well as phosphate esters. The formation and breakdown of phosphate esters under the control of kinases and phosphatases regulates the temporal protein activity and is responsible for the generation, distribution and utilization of free energy throughout the cell in several metabolic pathways. P is a structural component of the phospholipid bilayer membranes and genetic material including DNA and RNA. In nature, most P exists in its completely oxidized state (valence of +5) as a phosphate anion (PO43-, Pi), phosphate-containing minerals and organic phosphate esters. Pi compounds are the only form of P utilized by the plants for their nutrition. Modern agriculture is currently dependent on the continuous input of Pi fertilizers, produced by the mining of rock Pi. Approximately 80% of the mined P is used to manufacture Pi fertilizer.


The Difference is An Atom
Phosphite (Phi) is a reduced form of Pi with one less oxygen atom (P valence of +3). Phi compounds have been widely used in agriculture as fungicides for controlling several plant diseases caused by oomycete pathogens including Phytophthora spp. Although Phi can be absorbed by the plant cells through the Pi transporters, plants cannot metabolize Phi, which limits its use as a fertilizer. Phi can only be metabolized naturally by certain bacteria with an enzyme called Phi dehydrogenase (PtxD), which oxidizes phosphite into phosphate, a form that can be utilized for various cellular functions, and it does not provide P nutrition to the plants. The supply of Phi attenuates the Pi starvation responses (PSRs) in plants and inhibits the growth in Pi-starved plants. The addition of Phi to plants experiencing deficiencies of P confuses the plant’s internal signal that triggers the P deficiency responses. Several studies show that too much Phi application has detrimental effects on the growth and development of various plants. Therefore, Phi compounds should not be used as a major source of P fertilizers in agriculture.


Phi is more soluble than Pi and has a smaller structured molecule, so it is more readily absorbed by plant tissue. When added with other nutrients, it can serve as an excellent carrier. For example, a Phi mix containing phosphorus and potassium, calcium or magnesium would be absorbed readily and carry the needed nutrient into the plant. This has been demonstrated in numerous trials based on Verdesian Life Sciences’ line of NutriPhite nutrient products. Because of the proven biostimulant properties of Phi and the fungicidal benefits, we have the possibility of getting multiple benefits applied with a single application.

Phosphite Not a ‘Traditional’ Fertilizer
So, though Phi is not the best nutritional source of P, it can serve as a carrier and catalyst for quick nutrition supplements and responses to nutrient deficiencies. Soil applications of Phi usually do not replace P in the soil; however, plantings the following year show the plants do better where Phi had been applied the previous season. Interest in using Phi as part of a total production package is increasing, especially for some high-value crops. Phi fertilizers, if not formulated correctly, have significant potential to be phytotoxic and induce adverse reactions with other materials in the spray tank such as microelements and pesticides. When choosing your Phi source, it would be wise to seek a stabilized formula as it is proven not to bind with other tank mix materials. Chemical bonds will create another compound that even if not phytotoxic can be completely useless and unattainable by the plant. The salt-out effect can be a potential to clog nozzles and filters and could result in a waste of dollars spent on the Phi and/or other nutrients and chemicals. By binding these up, we are losing all or most of the efficacy of an expensive input in our crop management. All fertilizers, especially Phi, should be used in close consultation with a crop consultant to meet desired production goals.


In California, it is important to recognize that research has shown foliar applications of Phi can replace Pi in citrus and avocado crops suffering from P deficiency. Phi conversion to Pi may be attributed to slow chemical oxidation or by oxidizing bacteria and fungi that have been found living on the leaves of these two crops.

In part two of this article series, we will visit the biostimulant role of Phi, which is possibly even more important than the fungicidal properties of this very diverse and very useful tool to consultants and growers.

Scouting is Important Component in Weed Control Strategies

0
Post-harvest is a good time to assess effectiveness of weed management programs (photo by M. Katz.)


Postharvest scouting for weeds in tree nut orchards presents an opportunity to evaluate this year’s orchard floor management program and see which weed species have invaded or spread, where weed populations are highest and severity of infestation. Field margins, ditch banks and irrigation canals should be included in the scouting.

Scouting allows you to adjust control practices for the following year and select the best options for the weed species of concern. It can also help with selection of the best cultivation method for the weed stage.

Correct identification of weeds at all stages of growth is especially valuable, said John Roncaroni, UCCE weed specialist emeritus. Grass species identification can be difficult, he said, but it is important to determine because some species like ryegrasses are more resistant to glyphosate while summer grasses are not. Knowing the weed can also help determine if mechanical or cultural control methods would be useful. Weeds can look similar but have very different management requirements.

The UCCE publication Sacramento Valley Orchard Source recommends scouting a couple of times during the winter to catch weeds when they are young and more easily controlled. Records of weed infestations should be kept and mapped to show where weeds are a persistent problem.

Keeping records of weed infestations from year to year can help show trends and which management tactics are working.

Another recommendation is to look for different weeds in different management zones. Tree row checking may show effectiveness of previous herbicide applications. The ground cover in row middles can show if perennial seedlings are increasing. Orchard borders and row ends are places to look for new weeds.

Almond Board of California reports that as of as of 2021, there were 13 weed species commonly found in almond orchards with confirmed cases of herbicide resistance biotypes in California. Due to the increasing numbers of herbicide resistant weed species, early control of escaped weeds can reduce cost of an annual orchard floor management program. An example in Sacramento Valley Orchard Source notes that spot treating two acres of glyphosate resistant palmer amaranth with a tank mix of Glufosinate and Gramoxone is more affordable than trying to control this weed in an entire 50-acre block.

Citrus Rootstock Choices Determine Growth and Productivity

0
Bud union of a 7 year old tree of DaisySL mandarin on C146 rootstock at Lindcove Research and Extension Center near Exeter.  This is an experimental rootstock that has shown some promise for HLB tolerance in Florida trials (photo by M. Roose.)


Citrus tree growth, health and productivity are influenced by the rootstock chosen. In a Citrus Research Board webinar, Dr. Mike Roose, professor emeritus of genetics at UC Riverside, outlined the newest challenge for citrus rootstocks: heat and drought tolerance.

Choosing a rootstock involves balancing objectives, strengths and weaknesses. Roose advised choosing a rootstock with characteristics matched to the location and objectives. With an existing planting with a known rootstock, management should be done to avoid known stresses to the rootstock. For example, Phytophthora control may be necessary for many rootstocks. Soil fumigation may be needed if there is low tolerance to nematodes. Spray regimes for Asian citrus psyllid may control aphids that vector Tristeza.

Salinity, calcareous soils and drought pose serious challenges to rootstocks.

Roose noted that there are little comprehensive data on drought resistance of citrus rootstocks and the topic is complex because drought is location specific. Major citrus producing countries have diverse climate, soils vary in water holding capacity and cultural practices such as mulching, irrigation and berms vary widely.

Roose said drought tolerance is a complex trait that is important at different growth stages and involves multiple adaptations. Those can maximize extraction of water from soil while minimizing loss from leaves. Deep roots and altered leaf morphology, including thicker cuticle, narrow leaves and changes in stomata, are also mechanisms that aid in drought tolerance.

Iron chlorosis is a condition that occurs on more alkaline soils (pH 7.5 to 8.5) because availability of iron is reduced. Water with higher pH can also enhance soil problems. A typical iron chlorosis symptom in citrus is interveinal chlorosis. A trial of Tango rootstocks from 2010 to 2020 showed differences in tolerance among five different rootstocks. Pomeroy trifoliate and Rich 16-6 had high tree losses while trees on Swingle, Carrizo, c35 and Volk had few chlorosis symptoms.

Roose said citrus rootstocks differ in tolerance to salinity and to specific ions present. Citrus shows yield decline when soil salinity reaches 1.7 dS/m with about 16 percent yield loss per additional 1 dS/m. If soil salinity is 4 dS/m, then 2 .0 inches of water per foot of rootzone are required to reduce salinity to 1.5 dS/m.

High transpiration increases the uptake of chlorine and other ions from soil. Leaf chlorosis levels are inversely related to water use efficiency and membrane transporters are involved in Cl uptake. Overall tree tolerance is also influenced by the scion.

Rootstock choice can also affect tree vigor in the absence of diseases, soil and water stresses, climate, compatibility with scion and genetics when zygotic seedlings are used as rootstocks.

Mealybugs Pose Threat to Grape Quality

0
Vine mealybug (VMB), which is spreading throughout grape growing regions in California, has six to seven generations a year (photo courtesy Lodi Woodbridge Winegrape Commission.)


Mealybug management is an important part in controlling grapevine leafroll disease.

At a Fresno State grapevine viruses symposium, Kent Daane, UC Berkeley extension specialist, said systemic insecticides are slow to kill mealybugs, while mealybugs’ ability to transmit the disease occurs at a fast rate.

A case study published in Frontiers in Microbiology noted that control of mealybug and grapevine leafroll disease is among the top priorities in the U.S. wine grape production industry. It is most prevalent in cool climate regions where fruit on infected vines has delayed maturity that results in lower brix, affecting value of the crop.

There are three biological components to grapevine leafroll disease: a complex of viruses, grapevine host plants and species of mealybugs and soft scales that transmit the virus. Symptoms appear in the fall when red grape cultivars display leaf reddening. In white cultivars, there is slight leaf chlorosis. Both red and white cultivars develop downward rolling of leaf margins and phloem disruption.

Vine mealybug (VMB), which is spreading throughout grape growing regions in California, has six to seven generations a year and all stages of overlapping generations are found on canes, clusters and leaves and under bark on trunks and cordons.

Daane said traps are effective in determining if vine mealybug is present in a vineyard. Grape growers can be surprised to find this pest in vineyards since infestations can be difficult to spot. The highest flight rates for VMB are later in the season close to harvest.

Traps can be a good starting point for a concerted regional effort in control of VMB. Asking neighbors to also trap and compare trap counts can help with control decisions.

Grape mealybug is a native pest that has a large complex of natural enemies and is often under good biological control.

Current management strategies for vine and grape mealybug include insecticides, mating disruption, biological control and management of some ant species. The Argentine ant in particular farms the mealybugs and is aggressive in California vineyards, causing a struggle in maintaining a low mealybug population.

Conclusions from studies of mealybug control in major grape-growing regions of the world show a combination of approaches are needed for grapevine leafroll disease. It must be managed on a large scale and a long-term management strategy is necessary. Infected vines or blocks will continue to be a source of infection and the disease will spread in the presence mealybug vectors.

Having a source of certified uninfected propagation materials is also a component of avoiding grapevine viruses.

New Virus Strain of BCTV in Colusa County

2
Beet curly top virus affected tomato plant. A new strain of this disease has been confirmed in Colusa County. It is vectored by the beet leafhopper (photo by Amber Vinchesi-Vahl,)


An unusual strain of beet curly top virus (BCTV) has been confirmed in Colusa County this growing season. This new outbreak follows an outbreak last year, possibly due to the drier conditions which resulted in the vector of the disease, beet leafhopper, migrating into processing tomato fields earlier than usual.

UCCE Colusa County Farm Advisor Amber Vinchesi-Vahl said that BCTV is not normally a serious issue in processing tomatoes in the northern tomato growing regions. She noted that the confirmed virus strain was different than the strain found in Fresno and Kern counties.

Some damage to fruit and plants occurs when beet leafhopper nymphs and adults feed in tomato fields, but the main issue is vectoring BCTV.

Vinchesi-Vahl , in the Vegetable Crops newsletter, said that other insects cannot transmit the virus to tomatoes. The virus is not transmitted or spread by seed, touch or machinery.

Curly top-infected plants turn yellow and stop growing. Leaves roll upward and turn purplish. Leaves and stems become stiff. Spring plantings are the most susceptible as beet leafhopper migrates from overwintering host plants when they become dry. The west side of the San Joaquin Valley is where most infections occur.

Vinchesi-Vahl said that beet leafhoppers do not complete their life cycle in a tomato field. They migrate in, feed and then move on to preferred hosts, including sugarbeets. For this reason, it is not likely that beet leafhoppers will be visible in field inspections.

When beet leafhoppers migrate out of the field, that ends the virus transmission. The infected plants, particularly the earliest infected, will die. There will be a mix of plants with different stages of the virus resulting from multiple flights of beet leafhopper into the field.

Managing surrounding weed hosts around tomato fields may be helpful in reducing sources of the virus. The UC IPM Guidelines say that insecticides applied to infested fields to control beet leafhopper and reduce the spread of the curly top pathogen may prevent some infield spread, although infected plants will not recover. In areas that are at annual risk of beet leafhopper infestations, application of a systematic insecticide may have some impact. Beet leafhopper populations are greatest in years with rainfall that promotes growth of its weed hosts in the foothills.

Growers are asked to be on the lookout for BCTV in tomato fields and to contact Vinchesi-Vahl at acvinchesi@ucanr.edu if high incidence is found.

Resistance-Breaking Virus Strain Found in Sutter County Tomatoes

0
Symptoms of tomato spotted wilt virus include extensive distortion, yellowing and necrosis of leaves. Plant infections should be confirmed with molecular testing. Locations of infected plants should be documented to allow follow up next year (photos courtesy A. Vinchesi-Vahl.)


A resistance-breaking strain of tomato spotted wilt virus (TSWV) was detected in May in a northern Sutter County processing tomato field, according to the UCCE Vegetable Crops Newsletter.

UCCE Vegetable Crops Advisor Amber Vinchesi-Vahl recommends monitoring fields for TSWV, particularly those planted with resistant cultivars. Fields where more than 3% of plants are showing symptoms are suggestive of the presence of the resistance-breaking strain. Symptoms include extensive distortion, yellowing and necrosis of leaves. Plant infections should be confirmed with molecular testing. Locations should be documented to allow follow-up next year.

Growers who suspect TSWV in resistant tomato varieties should contact Vinchesi-Vahl or deliver samples to the Colusa or Yuba-Sutter UCCE offices.

Symptoms of tomato spotted wilt virus include extensive distortion, yellowing and necrosis of leaves. Plant infections should be confirmed with molecular testing. Locations of infected plants should be documented to allow follow up next year (photos courtesy A. Vinchesi-Vahl.)

Incidence of tomato spotted wilt virus has been increasing in California processing tomatoes, Vinchesi-Vahl reports. It is spread from plant to plant by thrips, mainly western flower thrips. Tomato spotted wilt virus can only be acquired by immature thrips. Infected adults can transmit TSWV throughout their 30- to 45-day lifespan.

Symptoms for TSWV depend on stage of growth. In early vegetative stages, bronzing and wilting occur, and the entire plant may look off-color and have a crumpled appearance. At later stages, purpling and leaf curling are evident. Bumpy fruit with ring spots is seen in bearing plants. Symptoms can be similar to those caused by curly top and alfalfa mosaic, but if necrotic spots and rings develop on leaves, followed by necrosis and dieback of entire leaves and shoots, TSWV is indicated.

Effective management targets thrips and the virus. Growers should use transplants from greenhouses that monitor for thrips and inspect plants for signs of TSWV. Growers should avoid planting near established crops with confirmed TSWV infection. Thrips should be managed early in the season with chemical control as monitoring or degree day predictions indicate. Tomato fields with high populations of thrips and resistance-breaking strains of TSWV should be sprayed for thrips one to two weeks prior to harvest to reduce the spread of the adults to nearby fields. Weed control in and around the field is also recommended.

Best practices after the growing season include removal of old tomato plants and other host crops on a regional level. Weed control in adjacent fallow fields can reduce sources of infection.

For additional information on testing for TSWV or developing thrips management strategies, contact UC Davis’ Robert Gilbertson, rlgilbertson@ucdavis.edu.

Young Tango Trees Targeted by Citrus Leafminer

0
Adult leafminers cause no damage and live only one to two weeks. After mating, the female lays single eggs on the underside of leaves (left photo by David Rosen, right photo by Jack Kelley Clark, both courtesy UC Statewide IPM Program.)


Protection of Tango trees from citrus leafminer for the first three to four years after planting is warranted, UC research has found, and monitoring for larval mining activity should
be done to determine the timing and frequency of insecticide treatments.

Matt Daugherty, UCCE entomology specialist at UC Riverside, and Beth Grafton-Cardwell, UC emeritus entomology specialist, noted in their citrus leafminer study that monitoring is critical as the citrus leafminer populations vary during the season and tend to decline with tree age.

Citrus leafminer, Phyllocnistis citrella, is a tiny moth that was detected in the U.S. in 1990 and found in California’s Central Valley citrus growing regions in 2006. It was not considered a serious pest in mature citrus, but studies found that infestations in the rapidly growing Tango acreage could affect tree growth and, later, crop yields.

Daugherty said that anything that impacts growth of new flush in citrus will also impact citrus leafminer populations. Optimal temperatures for citrus leafminer development are between 70 and 85 degrees F with greater than 60% humidity.

Adult leafminers cause no damage and live only one to two weeks. After mating, the female lays single eggs on the underside of leaves (left photo by David Rosen, right photo by Jack Kelley Clark, both courtesy UC Statewide IPM Program.)

Visual surveys for this pest in young trees should take place in the spring and summer months. UC IPM guidelines note that citrus leafminer has four life stages: egg, larva, pupa and the adult moth. Adults cause no damage and live only one to two weeks. After mating, the female lays single eggs on the underside of leaves.

Eggs hatch about one week after being laid. The larvae begin feeding in the leaf and produce tiny, nearly invisible mines. When the larva emerges from the mine, it rolls the edge of the leaf over, causing a curling of the leaf. Inside that curled leaf edge, the leafminer becomes a pupa.

Daugherty and Grafton-Cardwell evaluated three insecticide treatment regimens to reduce citrus leafminer densities compared to untreated trees to determine if growth and development of Tango mandarin trees were affected during the first four
years after planting.

They found that the number of leaves that were suitable for egg laying by citrus leafminer fluctuated, with the lowest numbers occurring during the summer heat. Both the amount of tender leaf flush per shoot and the citrus leafminer populations per leaf declined during the three years of the study, reducing the number of applications of insecticides needed as trees matured.

Systemic imidacloprid combined with multiple foliar insecticides significantly improved the yield of trees in years three and four when they first came into bearing.

Individual insecticide applications reduced leafminer density for two to three weeks, including the systemic Admire Pro® applied at seven fluid ounces per acre.

-Advertisement-