


In California, avocado (Persea americana Mill.) is primarily grown in southern and central parts of the state along the coast where 88% (USDA-NASS 2023) of the avocados are grown in the United States. These regions have semi-arid Mediterranean climates and currently face uncertain water supplies, mandatory reductions of water use and rising cost of water, and thus, efficient use of irrigation water is one of the highest conservation priorities. Moreover, due to increasing salinity in water sources and the fact that avocado trees are sensitive to salinity, effective irrigation is more critical to ensure optimal yield and high-quality avocado fruits. Many avocado growers have developed irrigation practices that enable good profitability; however, the continual increase in water costs and water restrictions due to drought and climate change has placed pressure on the industry to further enhance water use efficiency. Accurate information on crop water use along with irrigation best management practices are the immediate needs of the avocado industry under the current fluctuations in water availability, reliability and quality to sustain the profitability and sustainability of production. Hass is the predominant avocado variety in California, accounting for nearly 95% of the planted area (Hass Avocado Board 2020). This article summarizes some findings from our recent three-year study conducted on Hass avocado crop water use (actual evapotranspiration or crop water consumption) and crop coefficients.
Experimental Sites and Measurements
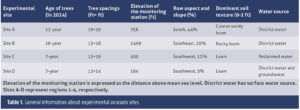
The data used in this analysis are from the research conducted at Hass avocado orchards in four avocado sites in southern California, here referred to as site A (San Pasqual Valley, Escondido), site B (Via Vaquero, Temecula), site C (Orchard Hills, Irvine) and site D (West Saticoy, Ventura) (Table 1). The sites consisted of a wide range of climates, slopes and elevations, soil texture and conditions, tree spacings, soil types and conditions, and water sources, offering a good representation of the Hass avocado production systems in California.
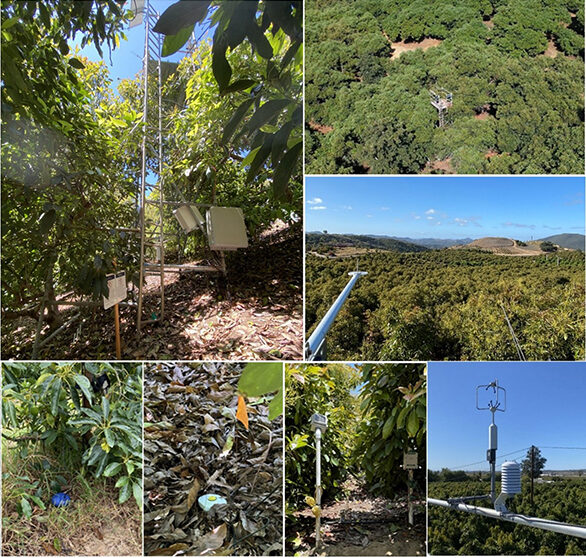
A combination of eddy covariance and surface renewal equipment (flux tower, Fig. 1) was utilized to measure actual crop water consumption at each avocado site over a three-year period (2022-24). Several other sensors and equipment were used to monitor soil and plant water status, soil salinity and chloride, and high-resolution images were captured by unmanned aerial systems to evaluate canopy features.
Weather Variables
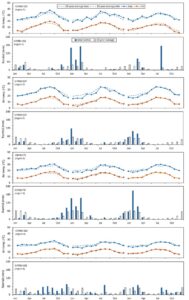
Monthly average meteorological data over three years from 2022-24 were compared with the 10-year average (1995-2024) (Fig. 2). The data demonstrated all regions had a dry 2022 winter, a wet 2023 winter and a near normal (10-year average) 2024 winter. Overall, more variations were observed in the monthly maximum temperatures than the minimum values over the study seasons compared with the mean 10-year corresponding temperature data. A similar tendency was found across the experimental regions over the period. Except the fall, the entire 2022 season was warmer compared to the 10-year average. August 2022 had the highest mean daily maximum temperature for the recorded period of three years at 38.1 degrees C (100.6 degrees F) in the San Pasqual Valley and 34.8 degrees C (94.6 degrees F) in the Via Vaquero area. September 2022 had the highest mean daily maximum temperature over the three-year period at 30.9 degrees C (87.6 degrees F) and 28.3 degrees C (82.9 degrees F) in the Orchard Hills and the West Saticoy regions, respectively.
Salinity Effects
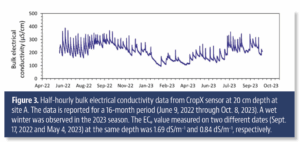
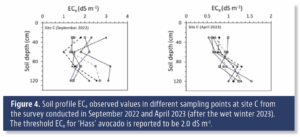
Salinity within the soil profile varies over the season and between the seasons affected by rainfall, irrigation management, leaching practices, irrigation water quality, and soil types and conditions. The bulk electrical conductivity values measured by CropX sensor at site A (Fig. 3) demonstrated a decline from 388 µS/cm on June 23, 2022 to 95 µS/cm on Feb. 8, 2023 at this site. The salinity noticeably diminished after the wet winter 2023 in comparison with summer 2022 when a salt-affected condition was observed at some of the avocado sites. The avocado sites occasionally could experience salt accumulation more than the threshold while wet winter and appropriate leaching practices may have a significant impact on maintaining salt and chloride issues (Fig. 4). This may negatively influence the crop coefficient values under circumstances. The threshold ECe (electrical conductivity of the saturation extract, dS/m−1) for Hass avocado is reported to be 2.0 dS/m−1.
Daily Crop Water Use
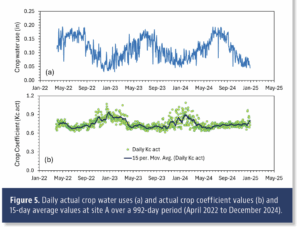
While a similar crop water use pattern was found over the course of the measurement seasons in experimental sites, daily crop water consumption was generally greatest at site A. Variable daily crop water use was observed on each site over the season/s. For instance, it varied from 0.03 in d−1 to 0.18 in d−1 with an average of 0.11 in d−1 in the 2023 season at site A (Fig. 5a). Considering the tree spacings at this site, the crop water use ranged between 6.7 and 40.5 gallons per tree with an average crop water need of 24.6 gallons per tree in 2023. The values were, as expected from the weather data, lower in late fall and winter when conditions were cooler, and the days were shorter. Uniform daily crop water consumption over the summer months occurred more frequently than other months, specifically during the winter and part of the spring when the weather conditions were more unstable.
The observed daily actual crop water use and Spatial CIMIS ETo (reference ET) in each of the experimental sites were used to compute the daily actual Kc values at each site over the study seasons. The trends in daily Kc values were similar across experimental sites over the study period, with more Kc variability during late fall and winter months when compared with spring and summer months (Fig. 5b). During late-fall and winter, the weather is more unstable with more cloudy and rainy days and wet soils. More fluctuations in actual Kc values are expected under such circumstances. The daily Kc value varied from 0.61 to 1.10 with a mean of 0.75 at site A over the 992-day study period.
Seasonal Crop Water Use and Crop Coefficient Values
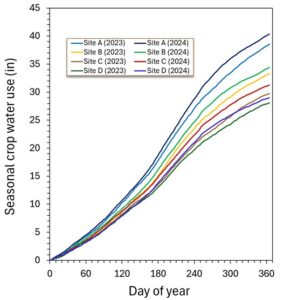
Considerable differences were found in the seasonal crop water use measured across experimental sites and seasons (Fig. 6). The largest difference was 11.4 inches between site A and site D during 2024. However, the seasonal crop water use difference between avocado sites C and D was 2.1 and 2.4 inches in 2023 and 2024, respectively. Overall, greater crop water consumption was observed in each of the avocado sites in 2024.
The greatest seasonal crop water consumption was determined at an avocado site (site A) with the features of coarse sandy loam soil texture, 44% south facing slope, average elevation of 758 feet above mean sea level, plant density of 120 trees per acre, average canopy coverage of 88.7% and tree height of 23.2 feet (Fig. 6). In contrast, the least seasonal crop water use was observed at an avocado site (site D) affected by coastal climate with the features of loamy soil texture, 3% southwest facing slope, average elevation of 164 feet above mean sea level, plant density of 254 trees per acre, average canopy coverage of 75.9% and tree height of 12.5 feet.
The results demonstrated there is considerable spatial and temporal variability in crop coefficient values of avocado orchards (Fig. 7). At site A, the average monthly Kc value varied between 0.70 in July-August and 0.85 in January. The south facing high slope along with the large canopy coverage are likely the most influential drivers in the environmental conditions of this avocado site, which tends to receive higher direct sunlight and light interception resulting in high crop coefficient values over the season. The monthly actual Kc value varied from 0.55 in July to 0.73 in January at site D, located at a low elevation. This specific site was more affected by the coastal fog influence than the others that could be a major reason for less crop water needs over the season.
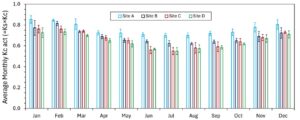
The maximum difference was found between the monthly Kc values of site A and site D, ranging from 11.5 % greater in April to 27.0 % greater in July. Greater differences were observed during the June-September period when lower Kc values determined than in the other months of the year. A similar trend was found at site B with the lower difference values. Inversely, more differences (the values are relatively low) were obtained in the winter months at site C that could be caused by the green ground cover between tree rows during the winter at this site.
The results illustrated summer has the lowest crop coefficient values, increasing gradually from late September to a maximum in mid-winter, again gradually reducing during spring to a minimum in mid-summer. To be more precise, the findings revealed greater Kc act values of avocados during flower bud development and flowering through fruit set growth phases than the fruit development phase. Potential reasons for such a trend are:
• Avocado leaves have a thick waxy cuticle that may reduce water loss through leaf surface and stomata. Young leaves, flowers and young fruit do not have a fully developed cuticle and may lose more water. Researchers reported that during flowering, as some of the floral parts have stomata, the evaporative surface of the avocado tree canopy increases by up to 90%, leading to an increment of the total tree transpiration rate.
• Avocado requires high energy in fall and winter for oil accumulation in fruit and floral development, and the trees may transpire at a higher rate compared to grass (ETo) during these months for photosynthetic activity throughout the growing season.
A mean daily crop water use of 0.13 and 0.15 in d−1 was found for spring and summer (over the three study seasons), respectively, whilst the value for winter and fall was similar (0.08 in d−1) at avocado site A with maximum values. Considering the tree spacings at this avocado site, the average daily crop water requirements are estimated 29.2 and 33.7 gallons per tree in spring and summer and 17.7 gallons per tree in fall and winter. In a winter with normal or wet rainfall conditions, precipitation most likely provides sufficient water to compensate for avocado tree water needs. The study verifies this for 2023 and 2024 at all avocado sites.
Considerable spatial and temporal variability were found in crop water consumption and crop coefficient values of avocado orchards. Several factors impact the variability of these measures in avocados, including climate, slope and row orientation, elevation, height of trees, trees canopy coverage that provides a good indication of canopy size and the amount of light interception, irrigation management practices and salinity and/or soil differences. If avocado orchards are located in similar climatic regions, it appears slope and row orientation along with canopy coverage percentage are likely the most influential drivers on avocado crop water use. It needs to be noted that in the Northern Hemisphere, midday and daily total solar radiation is mostly greater on southern slopes than on northern slopes and the slope aspect influences incoming light intensity and as a result consumptive water use.
The seasonal crop water uses provided in this article are the seasonal water consumption measured for avocado orchards across avocado experimental sites. Excess irrigation can be considered beneficial water use for salinity and choloride management in avocado orchards. The amount of additional irrigation water to effectively drain salt from the crop root zone depends on the soil conditions, effective rainfall and quality of irrigation water. However, the total irrigation water that needs to be applied in an individual orchard over the season depends on seasonal crop water requirements, effective rainfall, water distribution uniformity and salt leaching requirements. Heat waves are another driver that may impact the total applied water in avocado orchards.
The USDA Agricultural Marketing Service and the California Avocado Commission jointly supported this research.
References
Hass Avocado Board and the CIRAD Market News Service. 2020. World avocado production prospects: California in transition.
U.S. Department of Agriculture National Agricultural Statistics Service., 2023. Quick Stats. Available online at: https://quickstats.nass.usda.gov/.


 Invading California")

