


I know what you’re thinking; another green-washed lecture from someone who has no understanding of farming practices and wants to tell you how to run your operation. I assure you this is not that type of op-ed.
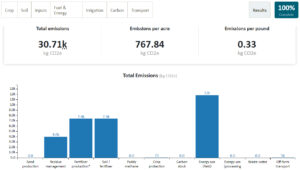
The topic of this discussion is understanding the practical relevance of improving your almond production carbon footprint (“CFP”). We begin by defining CFP as a measure of CO2-equivalent pounds per unit of food produced, or pounds of almonds in this case. There are two critical components of that statement. The first is “CO2-equivalent pounds.” This metric is used to harmonize units across industries that emit various types of greenhouse gas emissions. In almond production, as with other crop production systems, the primary greenhouse gas concern is N2O typically lost via crop nutrition management practices. The reason N2O is a primary concern is because each pound of N2O gas is equivalent to almost 300 pounds of CO2. This equivalency is also why crop nutrition management (primarily nitrogen management) is typically the single largest contributing factor to total production emissions. However, it’s also the lowest-hanging fruit for CFP improvements. The second critical element is these values are expressed on a per-unit-of-food-produced basis. This allows for efficiency gains in our management strategies to be accounted for more appropriately.
California Senate Bills 253 and 261 were signed into law this past October. These bills define a requirement for entities conducting business in California that meet specific revenue thresholds to report on their greenhouse gas emissions beginning in 2026. Entities within thresholds will have to look upstream and downstream in their supply chains to accurately quantify their emissions, which means they’ll likely need some verification of production CFPs from farms that are supplying ingredients.
What Can Be Done Right Now
Nitrogen management
With an expectation of new levels of scrutiny in the future, it’s important to focus on the practical relevance of these emissions. In many ways, emissions can be related to the overall efficiency of farming practices to produce food as previously noted. For example, if you were able to produce 2500 kernel lbs/ac using 200 lbs of N fertilizer instead of 250 lbs, you will have reduced your CFP of production. A second example might be adding a berm blower to your spray rig so that you could make half as many passes through the orchard for preemergent sprays. These improvements enhance our overall efficiency and lower emissions. Ultimately, N and irrigation management are by far the most significant contributors and offer the greatest opportunities for CFP reductions by efficiency improvements.
N management and irrigation are intimately tied together as N is taken up by the crop via mass flow with water. This characteristic is helpful in that its movement in the soil profile is predictable. It can, however, be detrimental when we mismanage our irrigation applications. Nitrogen Use Efficiency (NUE), or the amount of N supplied versus the amount removed in the crop, is a key metric of crop nutrition management efficiency. NUE improves the closer we get to matching our applications to demand and leveraging the 4Rs of Nutrient Stewardship for delivery. Traditional practices of slugging on 200+ pounds N in four to five calendar-based applications typically reduce our NUE to around 60% to 70%. The environmental fate of 30% to 40% N applied in this manner is aboveground losses due to volatilization and below-rootzone losses from leaching. These losses are counted in a production carbon footprint. Even in a scenario where greenhouse gasses like N2O are not emitted but the product is leached below the rootzone, that “wasted” input carries a CFP value with it that has not contributed to yield.
Many growers have switched to applying smaller doses more often, but they’re still adhering to the historic practice of concluding their N applications by early June. This is an improvement in that they are getting closer to matching demand at each application though they are still operating by an arbitrary calendar and not applying to true demand. The ultimate management strategy for NUE optimization is matching demand with every irrigation by adopting season-long continuous fertigation.

Continuous fertigation has been well documented to achieve 90% or better NUE with proper execution. This is achieved by minimizing environmental losses. Consider the following example to demonstrate the practical benefits. You’ve been traditionally applying 242 lbs/ac N to meet demand for a 2500-lb crop at 70% NUE. You move to a continuous fertigation strategy and from 70% to 90% efficiency. Those 242 N units can now support a 3200-lb crop. In this example, you’ve purchased and applied the same amount of N for a 2500-lb crop at 70% efficiency, but the management improvements support increased production by 700 lbs/ac, reduced CFP per unit of food produced (due to more crop with same N rate) and increased gross profit by over $1000/ac (using $1.5/lb crop price). The opportunity costs for NUE improvement are promising, even in a depressed market.
Crop nutrition management plays a critical role in improving NUE and thus reducing CFP, but input selection is equally important. There are three common forms of N fertilizer, each with their own strengths and weaknesses. Urea contains CO2, which can gas off immediately after application, ammonium can volatilize, and nitrates can denitrify under specific conditions. Selecting the right input source for the right conditions supports NUE improvements. There are also inherent manufacturing processes that influence the product CFP at the farm gate. Speak with a trusted CCA to learn more about these product-specific attributes.
Irrigation management
In a close second to nitrogen management, irrigation management accounts for about 1/3 of the total production CFP and can be maximized by irrigating in smaller doses more frequently. Water management improvements can, in many cases, lead to less total water applied per pound of kernel weight and less relative pumping time, which reduces your CFP due to fewer engine-related emissions. Optimizing irrigation efficiency and crop nutrition delivery also relies on distribution uniformity (DU). System tests should be conducted periodically because poor DU will result in overapplication of water and nutrients in some areas of the field while other areas suffer due to inadequate resources. While this all sounds good on paper, there is one of fundamental hurdle for adoption of continuous fertigation and irrigations strategies, which is the availability of water. Those that have productive wells with good-quality water are best positioned to achieve these goals as they can apply water as needed to support their efficiency goals. Those that are beholden to district water delivery schedules don’t have quite the same opportunity to feed water and nutrients in this fashion.

Remember: It is when we look at CFP as energy and resources used that did not support yield improvements that we are able to connect it back to production efficiency.
To begin assessing your operations, there are tools like CoolFarm Tool and Comet Planner to help you take inventory of your emissions related to various farm management activities. There is, however, no one-size-fits-all methodology to make improvements; strategies should be rooted in sound agronomy based on site-specific conditions to achieve the maximum benefit. Ultimately, don’t be afraid to ask questions or start taking inventory of your emissions as it will likely provide insights to your most costly farming activities in terms of energy and resources and guide you toward a more profitable future.


 Invading California")

