Soil acidity and soil alkalinity in relation to plant growth has been well-studied. Soil pH is often used as an indicator of the chemical fertility of the soil, and it is believed that most major and minor plant nutrients are best available around a slightly acid pH. This concept of soil pH-nutrient availability, the Achilles heel of soil fertility studies, was first developed in the 1930s and 1940s based on field trials, observation and various assumptions.
Early Conceptions
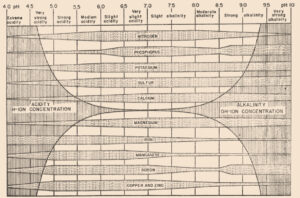
In 1936, a bulletin entitled, “A useful chart for teaching the relation of soil reaction to the availability of plant nutrients to crops” was published (Pettinger 1936) which stated, “…the effect of the degree of acidity or alkalinity on the availability of plant foods, or the relation between lime and fertilizers is one of the most widely discussed subjects in agriculture.” Soil reaction was perceived to be “…one of the pulses which indicates the state of health of the soil.” In the bulletin and diagram that came with it, Pettinger discussed the range of soil pH in relation to the availability of potassium, nitrates, magnesium, calcium, phosphates, iron, aluminium and manganese. A color diagram was presented that composed a series of bands representing the availability of plant nutrients in relation to a pH range of 4 to 10. The changes in width of the bands represent changes in the availability of the nutrient. It was stated that the diagram was designed to illustrate basic principles in the availability of nutrients in relation to soil reaction and did not “…portray the situation in a quantitative or absolute manner for any particular soil.” The diagram was considered only valid for well-drained soils of humid regions and not for alkali soils of arid regions or poorly drained or organic soils. The availability of some nutrients was directly affected by soil reaction whereas for other nutrients the availability was controlled by processes not related to the soil reaction. The bulletin noted, “…when the discovery of new evidence makes it necessary to discard present beliefs either wholly or in part, or when better methods of representing the facts are developed, the diagram will be revised and re-issued in improved form.”
The bulletin was not widely distributed, and it was received by Emil Truog at the University of Wisconsin-Madison who, by the 1930s, was a national leader in soil fertility and plant nutrition.
His work on the availability of plant nutrients emphasized the availability of plant nutrients was a relative matter and ‘available’ should be replaced by ‘readily available’, and ‘unavailable’ by ‘difficulty or slowly available’ (Truog 1937a), and that different cropping systems and crops have different levels of nutrient requirements and sufficiency levels.
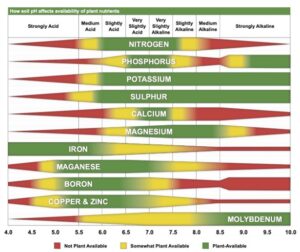
Truog liked the soil pH-nutrient availability diagram, and considered it very useful and “…the subject of tremendous importance in connection with liming, fertilizing and soil management” (Truog 1946). He expanded the diagram to 11 nutrients and made it “…more simple in form but more complete in several aspects” (Truog 1946). The diagram illustrated the relation of the soil pH to plant nutrients in which the width of the band at any pH value indicates the relative availability of the nutrient. The band did not present the actual amount as that was affected by other factors such as the type of crop, soil and fertilization. For the 11 nutrients on the diagram, a pH of around 6.5 was most favorable but did not mean a satisfactory supply; it indicated as far as the soil reaction was concerned, the conditions were favorable. Likewise, it did not mean outside the favorable range that a deficiency would prevail. Nutrients outside the optimal range could be adequately supplied as other factors than the soil pH affected plant growth or as some plants had low requirements for a particular nutrient at a high or low pH (Truog 1946).

Limitations
The soil pH-nutrient diagram was presented as conceptual in 1937 and 1946 and contained several assumptions. It assumed the availability of nutrients was the same to all plants in all soils and it was best to have the soil around pH 6.5. However, many acid soils are highly productive as are some soils that have an alkaline pH. The diagram suggested deficiencies of micronutrients did not occur at low pH and there were no problems with the availability of potassium or sulfur at high pH (Blamey 2005). There are plants that require a high soil acidity such as tea, pineapple, blueberry and cranberry, and others that require a high soil pH (Hartemink and Barrow 2023).
There are numerous cases in the availability of plant nutrients that do not match the diagram, and some of them were already highlighted by Truog (e.g., the toxicity of copper and zinc in acid soils, and the fact that calcium may not be a limiting factor in acid soils, which is not uncommon). It was often found that despite the low availability of calcium at low pH, liming had limited effect as calcium was taken up from the subsoil, other nutrients were limiting (in particular phosphorus), or soil drainage was the problem (Truog 1937b). Improved crop performance with liming is often from the reduction in aluminum toxicity, and calcium deficiency is not always the major cause of poor growth (Blamey and Chapman 1982). Other exceptions to the diagram include manganese toxicity at low soil pH, iron toxicity on acid soils, boron deficiency in alkaline soils and sulfur deficiency on alkaline soils (Hartemink and Barrow 2023). Some of these exceptions to the pH-nutrient availability concept have been explained as “…simply due to methodology” (Penn and Camberato 2019).

The availability of phosphorus is often assumed to be problematic in low-pH soils where it is said to be fixed by iron and aluminium, or in soils with a high pH when phosphorus is precipitated by calcium. Of all the plant nutrients, this is probably the most widely accepted pH-availability relationship, and in a recent review it has been termed the “…the classic understanding of the effect of pH on P uptake from soils” (Penn and Camberato 2019). Barrow recently summed up the problems with this model: It makes wrong predictions, there is very little evidence for the existence of the separate postulated sinks for phosphate and it has no facility for explaining other aspects of the behavior of phosphates (Barrow 2017). There are different effects of pH on the P availability. When the pH is decreased from 6 to 4, the rate of uptake of phosphate by roots increases, the amount desorbed from soil increases and the amount sorbed by soil often also increases. The first two increase the P availability while the third effect decreases it. The pH-phosphorus availability diagram fails the most fundamental test of science and is difficult to understand why it persists (Barrow 2017).
Soil pH is a useful indicator of the soil condition, and it affects numerous soil chemical reactions and processes. But it cannot be used to predict or estimate plant nutrient availability, and different plants respond differently as nutrients interact which can be synergistic as well as antagonistic (Barrow and Hartemink 2023). Soil pH influences solubility, concentration in soil solution, ionic form, and mobility of most plant nutrients. Soil pH affects the availability of many nutrients, but the optimum pH for plant growth depends on which nutrient is the most limiting (Barrow 2017). Furthermore, the activity of microbial communities and a range of chemical reactions in soil are affected by fluctuating pH. The bulk pH of the soil (commonly measured in a soil-water ratio) may not reflect the pH in the rhizosphere where nutrients are taken up by the plant. The soil solution pH is relevant for soil and plant biogeochemical processes, and better a predictor of crop yields than the soil pH measured in a soil-water mixture. Too seldom have theories been tested by actually measuring the effects of pH on uptake of nutrients by plants growing in soil (Barrow and Hartemink 2023).
The influence of soil pH on bioavailability is indirect at best through the competition with cations for dissolved ligands or surface functional groups and through breakdown of minerals by the protons which may enhance the bioavailability of some metals. There is also a direct effect of acidity on plant roots and on soil microorganisms (Sposito 1989), and pH at the root surface may differ from that of the bulk soil . Some recent research highlighted the importance of root-induced changes in the rhizosphere pH. In soils with pH-dependent charge (e.g., ultisols, oxisols), pH increases tend to increase the P concentration in solution and its availability to plants, whereas in soils with permanent charge it is typically the other way around (Hartemink and Barrow 2023).
Truog believed the soil pH-nutrient availability diagram presented a fairly reliable picture, but he stressed it was generalized and tentative and partly based on assumptions as data were lacking. The 1946 paper “Soil reaction influence on availability of plant nutrients” provided no data and no references. The diagram has never received further investigation but ended up in many textbooks and popular soil books and continues to be used in textbooks, encyclopedias, extension bulletins and numerous papers. The diagram has many more usages, often without citation, which suggests it has been accepted as common knowledge. It has become a defining principle in soil fertility and plant nutrition.
Since the 1950s, a large amount of research work has been done on the solubility of nutrients, the biological transformations of nutrients in soils and the effect of soil pH on adsorption and plant uptake. None of that can possibly be summarized in a simple diagram. The relationship between soil pH and nutrient availability remains of interest as nutrient availability in acid and alkaline soils is unique for each soil, crop and climatic region.
References
Barrow, N.J., 2017. The effects of pH on phosphate uptake from the soil. Plant and Soil, 410(1): 401-410.
Barrow, N.J. and Hartemink, A.E., 2023. The effects of pH on nutrient availability depend on both soils and plants. Plant and Soil, 487(1-2): 21-37.
Blamey, F.P.C., 2005. Comments on a figure in “Australian Soils and Landscapes: An Illustrated Compendium” ASSSI Newsletter, 142.
Blamey, F.P.C. and Chapman, J., 1982. Soil amelioration effects on peanut growth, yield and quality. Plant and Soil, 65(3): 319-334.
Hartemink, A.E. and Barrow, N.J., 2023. Soil pH-nutrient relationships: the diagram. Plant and Soil, 486(1-2): 209-215.
Penn, C.J. and Camberato, J.J., 2019. A Critical Review on Soil Chemical Processes that Control How Soil pH Affects Phosphorus Availability to Plants. Agriculture, 9(6): 120.
Pettinger, N.A., 1936. A useful chart for teaching the relation of soil reaction to the availability of plant nutrients to crops. Virginia Agricultural and Mechanical College and Polytechnic Institute and the United States Department of Agriculture, Cooperating, Blacksburg.
Sposito, G., 1989. The chemistry of soils. Oxford University Press, New York.
Truog, E., 1937a. Availability of essential soil elements – a relative matter. Soil Sci. Soc. Am. Proc.(1): 135-142.
Truog, E., 1937b. A new soil acidity test for field purposes. Soil Science Society of America Proceedings, 1: 155-159.
Truog, E., 1946. Soil reaction influence on availability of plant nutrients. Soil Science Society of America Proceedings, 11: 305-308.


