


The University of California Agricultural Issues Center (UC AIC) and the Department of Agricultural and Resource Economics at UC Davis work with UC Cooperative Extension Farm Advisors and Specialists to compile cost studies for crops and livestock produced in California. These costs and return studies are used by growers, bankers, crop consultants and many others to aid in a range of farm decisions from what to plant to production specifics. Often policy makers and researchers use these cost studies as well. The current and archived cost studies can be found at: https://coststudies.ucdavis.edu/
UC AIC recently released new cost and return studies for almond production in California. These 2019 regional cost and return studies for almonds are available for the Sacramento Valley, and the Northern and Southern San Joaquin Valley. This recent update of almond studies presents an opportune time to explore trends in almond cost and returns for the most recent two decades.
Before digging into graphs and figures, it’s important to discuss the elements of the cost study. The cost and return studies are meant to be used as a guide for growers, and actual costs and returns will vary depending on the specifics of the operation, growing conditions, and orchard characteristics. Therefore, it is necessary to specify underlying assumptions for orchards represented. It is not feasible to represent the infinite number of almond production scenarios out there. The following are some of the basic assumptions of 2019 cost study for the Northern San Joaquin Valley. For the full list of assumptions for each study listed in the charts, see the cost and return studies themselves.
- The orchard consists of 100 acres of almonds with a density of 130 trees per acre.
- No specific variety is listed.
- The useful life of the orchard is expected to be 25 years.
- A new micro-sprinkler irrigation system is installed during orchard establishment.
- The expected yield at maturity is 2200 lbs per acre at an expected price of $2.50/lb.
- Interest rates are 5.25% for operating loans and 6% for long-term investments.
- Land value is $25,200 per producing acre.
- Cost of pumping irrigation water from an established well is $100 per acre-foot.
- Cost of pollination is 2 hives per acre at $200 per hive.
The cost studies go into detail about the following cost categories, and provide a look at costs and returns at various yield and price combinations.
Operating costs: Any costs associated with almond production practices in a given year, including pesticide and fertilizer applications, irrigation water, labor, harvesting, interest on operating loan.
Cash overhead costs: Expenses paid that are not for a particular enterprise and should be assigned to the whole farm operation, such as office and accounting expenses, assessments, field sanitation, or equipment repairs.
Non-cash overhead costs: Annual depreciation and interest cost for farm investments. Examples include depreciation on farm machinery, well/irrigation systems, annual establishment costs, etc.
Establishment costs: Total pre-plant, planting and accumulated costs for non-bearing years. Establishment costs are amortized (spread out) over the useful life of the orchard.
Total costs: Sum of operating, cash overhead, interest and non-cash overhead costs.
Looking over these cost studies can help growers and crop advisors make sure they are incorporating all costs when making crop production decisions.
Trends in Almond Costs
To outline the trends in almond production costs, I use the 1998, 2002, 2006, 2011, 2016 and 2019 UC AIC cost and return studies for establishing and producing an almond orchard in the Northern San Joaquin Valley using micro-sprinkler irrigation. This provides an approximate idea of how costs have developed over time. The trends in most cost categories should be similar across the state, however there may be noticeable differences in certain aspects across regions, ex: land values, water costs, etc.
Figure 1 displays per-acre costs of almond production over time. All costs are adjusted to 2019 dollars to account for inflation. It is clear from the figure that from 1998 to 2016, inflation-adjusted total costs of almond production remained similar at around $4,500 per acre.
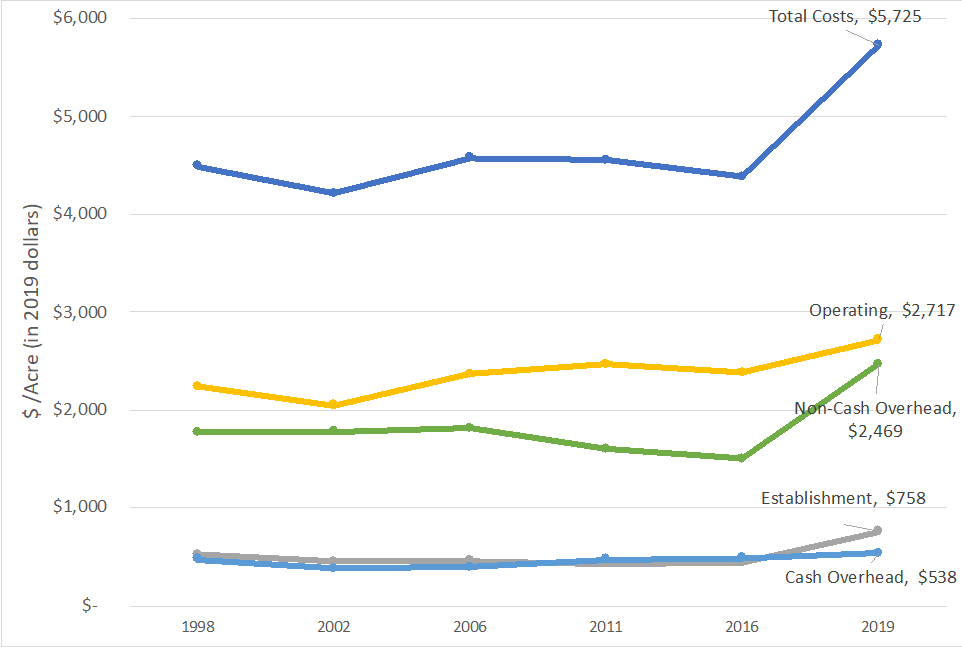
Sources: University of California Agricultural Issues Center Sample Cost and Returns Studies: https://coststudies.ucdavis.edu/. US Bureau of Economic Analysis, GDP Price Deflator.
Between 2016 and 2019, total costs of almond production per-acre increased substantially (See Figure 1). The driver of this is a large increase in non-cash overhead costs. The primary increases in this cost category between 2016 and 2019 are increases in establishment costs and land values. Interest rates in 2016 were 3.25 percent compared with 6 percent in 2019, increasing establishment costs substantially. According to USDA National Agricultural Statistics Service, average irrigated land values in California increased by 8 percent on average from 2016 to 2019. Factoring land values into the cost of production allows growers to consider the opportunity cost of their investment in the almond orchard. Even if a grower owns the land he or she plans to establish an orchard on, he or she might be better off renting out the orchard and investing those rental revenues elsewhere.
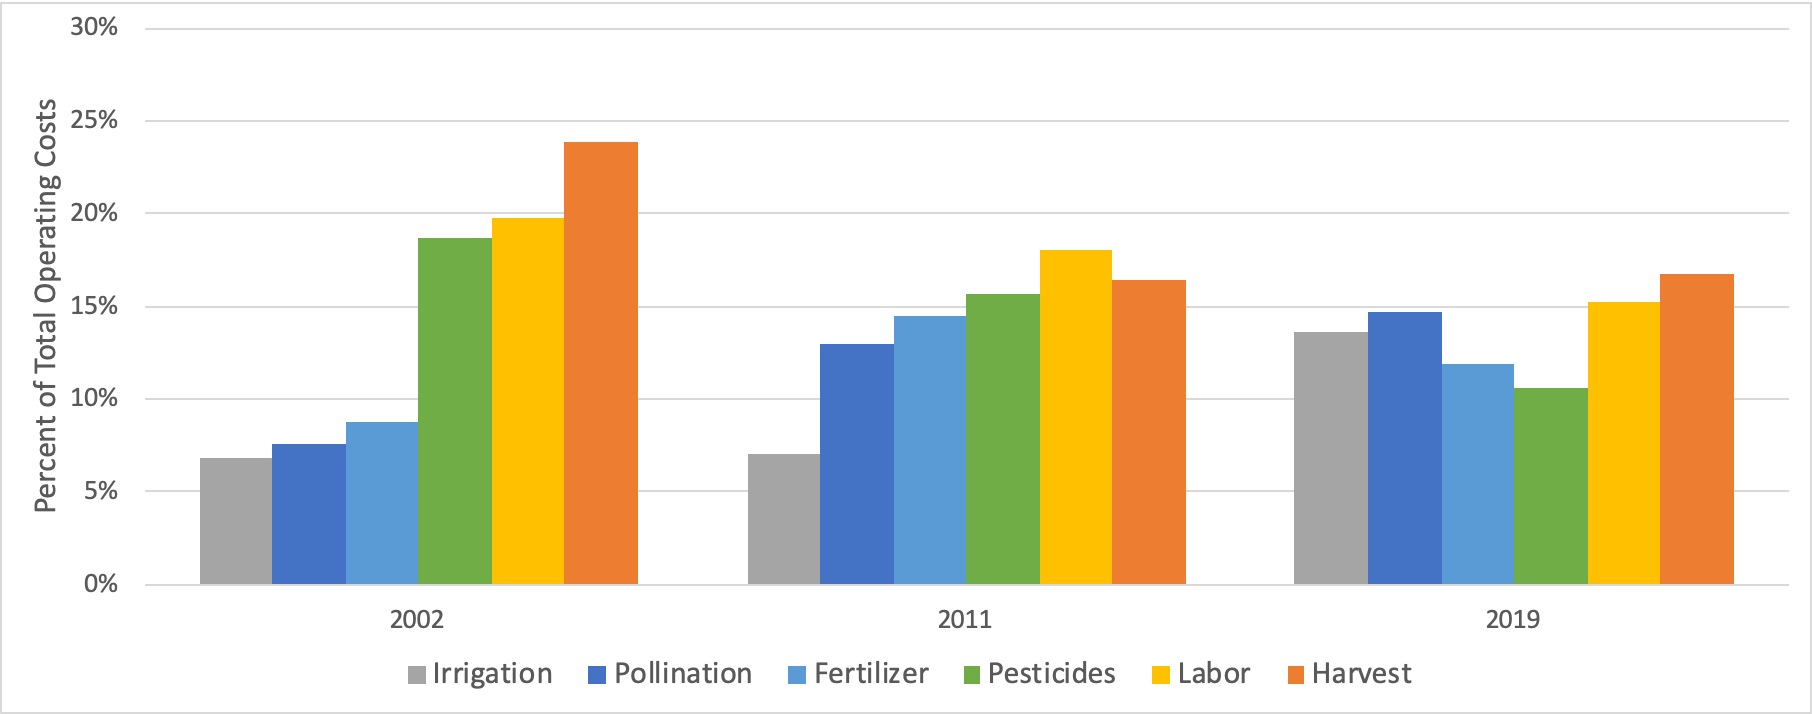
Source: University of California Agricultural Issues Center Sample Cost and Returns Studies: https://coststudies.ucdavis.edu/
Operating costs per acre also increased between 2016 to 2019. Much of the increase in operating costs was due to increasing labor and pesticide costs, as well as increases in the operating loan interest rates. Figure 2 shows various cost categories as a percentage of total operating costs for 2002, 2011 and 2019 almond production. In 2002, pesticides, labor and harvest comprised more than 60 percent of total operating costs. While that number dropped to roughly 43 percent in 2019, over time, pollination, irrigation and fertilizer costs have increased to make up a much larger portion of total operating costs for almond growers. Irrigation costs may continue increasing as a percentage of total operating costs given implementation of the Sustainable Groundwater Management Act (SGMA), however it is unclear what the effects of this regulation will be (for SGMA resources see http://groundwater.ucdavis.edu/SGMA/). Pollination fees will likely continue their trend upward as well, though growers may be able to reduce pollination costs through decreasing the number of colonies per acre, planting self-fertile varieties or making mutually beneficial contractual arrangements with the beekeeper (Goodrich, 2019; Champetier, Lee, and Sumner, 2019).
Trends in Almond Returns

Sources: 2018 Almond Acreage Report, USDA NASS, CDFA. Blue Diamond Payment History 2004-2018. US Bureau of Economic Analysis, GDP Price Deflator.
Figure 3 shows the Blue Diamond average base rate for nonpareil meats from 2004 to 2018 (in 2019 dollars to adjust for inflation). Since 2016, prices have been lower than the 2004-2018 average of $3 per pound. Uncertainty in trade issues have resulted in decreased demand for almonds in a number of countries (Sumner, Hanon and Matthews, 2019). For example, almond exports to China were down 24 percent between 2018 and 2019 (Almond Board of California, 2019). This decreased demand has led to lower almond prices, and with future trade agreements still uncertain, it is unclear how prices will move going forward.
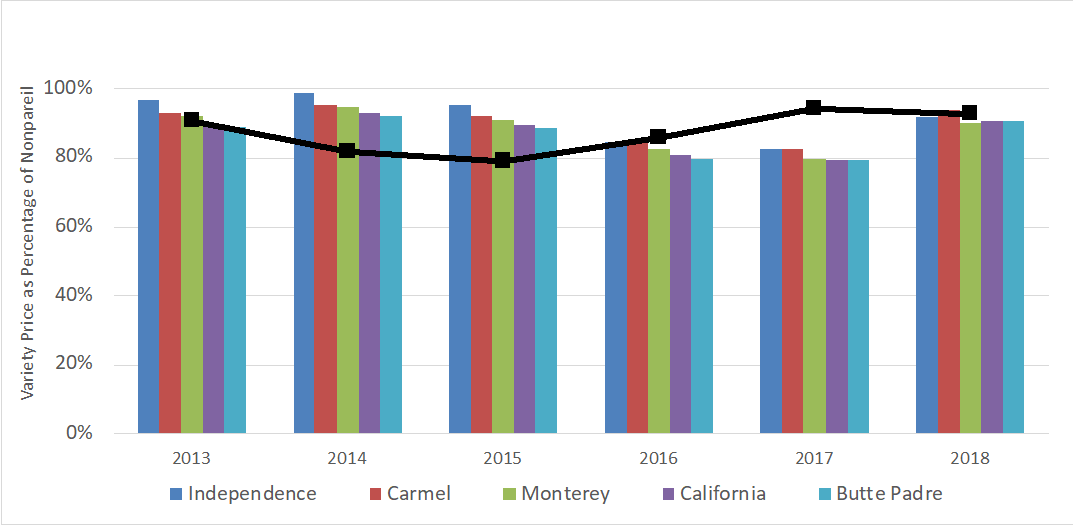
Sources: Blue Diamond Payment History 2013-2018. Almond Board of California Almond Almanac 2013-2019.
The prices a grower receives will vary by quality, size and variety. Figure 4 shows average variety prices as a percentage of nonpareil. In 2016 and 2017, other varieties were discounted fairly heavily in comparison to nonpareil, while in other years discounts were not quite as large. What impacts the size of these discounts? The relative supply and demand of nonpareil compared with other varieties. Figure 4 also displays nonpareil production as a percentage of total production from Butte/Padre, Butte, Monterey, Carmel, and Fritz. In 2017 and 2018, nonpareil production was relatively high compared to these other varieties. The large supply of nonpareil almonds drives down the price relative to other varieties, shrinking the associated premium.
Trends in Planted Acreage
Figure 3 also shows planted acreage from 2004 to 2018 by region along with the average price of nonpareil. The planted acreage trends by region look relatively similar. Over the last five years, the largest almond producing region (Southern San Joaquin Valley) has seen planted acreage drop off significantly. Water availability concerns as well as relatively low prices are likely the driving issues here. The Northern San Joaquin Valley has also seen acreage drop off, but not as substantially as its southern counterpart. Planting in the Sacramento Valley has stayed relatively consistent over the last decade or so.
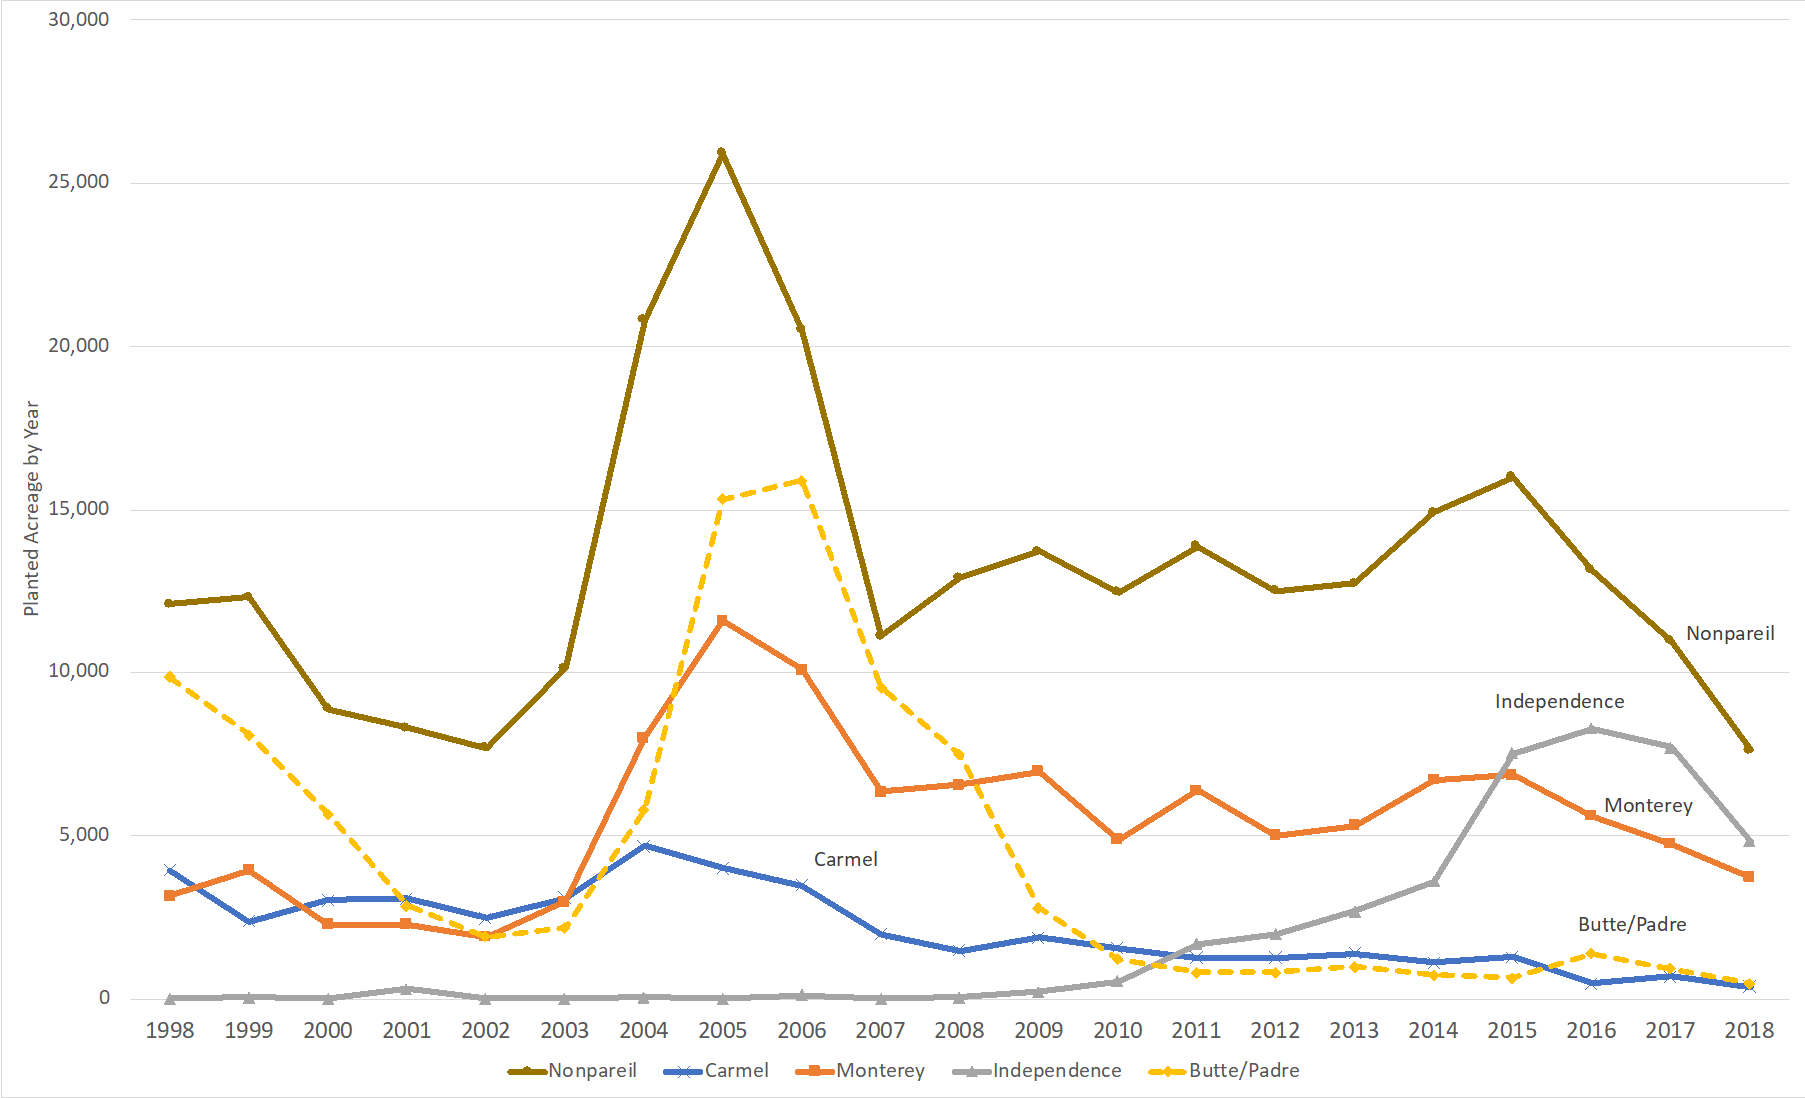
Source: 2018 Almond Acreage Report, USDA NASS, CDFA.
Figure 5 shows planted acreage for some of the main almond varieties. Toward the middle of the series, one sees the large planted acreage for most varieties due to relatively high prices in 2004-05. Over time, acreage plantings have stabilized at lower levels. The increase in self-fertile almond acreage is noticeable in the mid 2010s. Operating cost savings from pollination and fewer equipment passes through the orchard were likely driving this trend (Champetier, Lee and Sumner, 2019). Price discounts for the Independence variety in comparison to nonpareil have stabilized, from as low as 2 to 4 percent discount in 2013-14, to on average of 11 percent over the last four years for Independence compared to nonpareil.
Closing Remarks
Overall, net returns from almond production have likely narrowed over the last decade due to increasing costs of production. Land values and interest rates have increased, increasing the costs of establishing an almond orchard. Pollination, irrigation and fertilizer costs have increased as a percentage of total operating costs, while almond prices have remained at relatively low levels over the last few years. The fact that acreage is still being planted suggests that the potential net returns remain relatively strong compared with other crops in California.
References:
Almond Board of California. 2019. “Almond Almanac 2019”
Champetier, A., H. Lee, and D.A. Sumner. 2019. “Are the Almond and Beekeeping Industries Gaining Independence?” Choices. Quarter 4.
Goodrich, B.K. 2019. “Contracting for Pollination Services: Overview and Emerging Issues.” Choices. Quarter 4.
Sumner, D.A., T. Hanon and W.A. Matthews. 2019. “Implication of Trade Policy Turmoil for Perennial Crops” Choices. Quarter 4. Available online:
University of California Agricultural Issues Center Sample Cost and Returns Studies. Available online: https://coststudies.ucdavis.edu/


 Invading California")

