Over the past 10 years, wine grape growers, researchers and UCCE have been working together to control the spread of grapevine red blotch virus (GRBV), which is the causal agent of grapevine red blotch disease (GRBD), a red leaf disease that negatively impacts wine grape yield and quality.
Symptoms, Impacts and Spread
Symptoms of GRBD typically first appear around mid-season, although timing can vary across cultivars and between years. In red varieties, red blotches form outward from the leaf margin or within the leaf blade, and primary/secondary leaf veins will often turn red (Figure 1a). In white varieties, the blotches manifest as pale green or yellow patches with no reddening of the veins (Figure 1b). Symptoms typically first originate on basal leaves then over time progress to additional leaves further up the shoot. In the early season, these foliar symptoms are distinct from grapevine leafroll disease (GLD), but by late fall, leaf blade coloration of vines with GRBD may be similar to vines with GLD.
The unique symptoms of GRBD were first noticed in Napa County in 2008, and in 2011 testing confirmed the existence of GRBV, a previously uncharacterized Geminiviridae. Subsequent vineyard surveys across the U.S. revealed that GRBV is widespread nationally, and the virus has also been reported from vineyards in Canada, Mexico, Argentina, India and South Korea. The wide geographic range suggests that GRBV was likely initially spread through the propagation of infected plant material. That said, secondary spread has been recorded in some regions, indicating there may be unique insect vectors and/or non-crop reservoirs of GRBV.
Plant Hosts and Insect Vectors of GRBV
Data so far indicate that GRBV appears limited to the genus Vitis, which can include non-cultivated wild-type grape vines that typically grow in riparian habitats. Multiple insect surveys have shown that certain species or genera tend to frequently test positive, although none of which are considered significant pests of grape vines. To clarify, insects that test positive for GRBV do not necessarily have the ability to transmit the virus. Rather, these surveys help researchers identify candidate insect species for further testing. At present, transmission experiments with common vineyard pests such as leafhoppers, mealybugs and sharpshooters have not shown any transmission.
The only insect to date that has been reported by two different labs to successfully transmit GRBV is the three-cornered alfalfa hopper (Membracidae: Spissistilus festinus) (TCAH) (Figure 2a), which was able to move the virus between potted vines in a greenhouse setting. As its name implies, TCAH is primarily a pest of leguminous crops such as alfalfa, peanuts and soybean. While adults can oviposit into grape vines, the immature TCAH cannot completely develop on this host. In contrast, TCAH thrive on many types of legumes, which are critical for their development. Although TCAH can be found in California vineyards, its pest status is negligible and densities in vineyards typically tend to be very low. TCAH are pierce-suck feeders that, when present on vines, can girdle lateral shoots and leaf petioles, which leaves a distinct dark ring and leaves distal to the girdle turn red (Figure 3).
TCAH activity in vineyards (and in the vine canopy specifically) appears to be closely tied to the presence and quality of legumes in vineyard ground covers. TCAH overwinter as adults in protected areas in and around vineyards, and in the early spring begin to deposit eggs onto ground covers (likely legumes.) Nymphs (Figure 2b) pass through five juvenile stages as they develop. Ideal temperature range for nymph development is 65 to 95 degrees F; however, they can develop at temperatures as low as 55 degrees F. The appearance of first-generation adults roughly coincides with the seasonal dry-down and/or mowing/cultivation of vineyard ground covers. As ground covers are diminished in the late spring and early summer, TCAH adults may opportunistically feed in the vine canopy, which could potentially lead to transmission of GRBV between vines. That said, a recent study found that TCAH appear to have a very strong preference for ground covers, and significant activity in the vine canopy was only observed once >90% of ground covers were eliminated or dead. In the North Coast, TCAH likely complete 1 to 2 generations per year depending on climate and availability of food resources, whereas in warmer areas such as SoCal TCAH can complete 3 to 4 generations per year. Adults have been observed in vineyards until as late as leaf fall, after which they seek shelter in protected areas.
Given TCAH generally have a low affinity for grape vines, that other insects have tested positive in surveys, and the occasional rapid rates and extensive spread of disease, it is worth exploring other candidate vectors. Furthermore, field transmission by TCAH remains unclear, as does transmission efficiency (that is, how quickly TCAH can acquire and transmit the virus,) both of which are critical pieces of information to better understand disease ecology. As such, there are no existing recommendations to use insecticides to control TCAH in vineyards. Rather, a management strategy that concentrates on the removal of vines and reduction of persistent leguminous ground covers (such as burclover and Spanish clover) may be more effective. While the specific economics of individual vineyards will vary, the general suggestion is that individual vines be replaced when overall infection is <20% of the block, whereas with >20% of vines infected it may make more sense to replace a larger section or the entire block.
Testing Additional Vectors
One insect that is currently being investigated as a potential vector is the leafhopper Scaphytopius graneticus (Cicadellidae), which has frequently tested positive for GRBV – but again, this does not mean it can necessarily transmit the virus. Aside from frequently testing positive, what makes S. graneticus unique from other candidate vectors is its strong affinity for grape vines. Very little is known about this insect, and it is not considered a significant vineyard pest, but the sparse records that exist all report it from grape vines in the western U.S. Furthermore, recent vineyard surveys have documented relatively high populations of S. graneticus that are almost exclusively found in the vine canopy. As such, studies are currently underway to evaluate S. graneticus ability to transmit GRBV in both a greenhouse and field setting as well as characterize its host plants and reproductive biology.
Previous greenhouse research also indicated that the Virginia creeper leafhopper (Cicadellidae: Erythroneura ziczac) might also be a vector of GRBV. However, this insect is not always found in vineyards where GRBD spreads and other researchers have been unable to verify GRBV transmission by this leafhopper species or the related western grape leafhopper (Erythroneura elegantula) or variegated leafhopper (Erythroneura variabilis). There are other leafhopper species of interest such as the mountain leafhopper (Colladonus montanus) that have tested positive for carrying GRBV in the field but have not yet been proven to be a vector.
Conclusion
There are currently no thresholds or management recommendations for TCAH in vineyards. The existing information does not support the use of insecticides for population control. Strategies that remove infected vines and reduce persistent leguminous ground covers may be more effective. This insect is generally in low abundance and prefers to reside on leguminous ground covers. While some opportunistic feeding in the vine canopy can occur, it remains unclear whether this is sufficient to spread GRBV under field conditions. Additional studies are currently underway to verify TCAH field transmission of GRBV. In the meantime, monitoring TCAH populations on ground covers (using a sweep net) and in the vine canopy (using yellow sticky cards) can be combined with disease mapping to build a picture of annual changes in pest densities and disease incidence within the vineyard and drive management decisions.
Celery black heart, a calcium deficiency disorder, causes young growth in the heart of the plant to brown and blacken (photo by S. Koike.)
Farmers and agronomists have long observed that well-fed crops tend to suffer fewer pest and disease symptoms compared with nutrient-deficient plants. However, few of us turn to nutrient management to actively prevent disease. Just as a healthy diet rich in vitamins and minerals is the first measure in disease prevention in human health, proper fertilization should be your crop’s baseline of defense against pathogens. Balanced nutrient applications and good-quality soil produce vigorous crops capable of warding off disease.
Plants require a balanced supply of 18 essential elements throughout their lifecycle to sustain growth, repair tissue, prevent and resist disease. Deficiencies in macro and micronutrients often lead to impaired cell wall structure and accumulation of metabolic products that attract pathogens. Weakened and leaky cells walls give pathogenic fungi and bacteria easy entry points into the plant and plenty of food to fuel their proliferation.
Disease prevention requires understanding the environmental conditions that favor the pathogen as well as the nutritive additions that can upregulate plant defenses. Macro and micronutrient applications can support disease-free growth by building strong structural support and developing a biochemical environment unfavorable to pathogenic growth.
Nitrogen
In most cropping systems, nitrogen (N) is the most limiting nutrient to plant growth. Adequate N at key growth stages must be supplied throughout the season to help the crop meet its growth and yield potential. N management can also impact disease susceptibility. The type of nitrogen applied, the amount and the timing of the application all affect the soil chemistry and plant physiology in ways that can either favor or suppress infection. N management decisions should be based not only on the crop’s N requirement, but also on the field’s history of disease. The type of pathogens the plants will likely face may determine how to fertilize the crop.
Obligate and facultative parasites are affected by the crop’s N status differently. Obligate parasites, which require a living host for survival, benefit from a high concentration of N in the plant tissue. Stem rust in wheat, club root in cruciferous vegetables and powdery mildew on many crops feed on succulent, living tissue. High N applications increase vegetative growth, increasing the proportion of young susceptible tissue. High N also increases the concentration of amino acids in cells and on leaf surfaces, attracting and feeding pathogenic organisms. Nitrogen-rich plants decrease their production of phenolics and lignin, weakening both structural and chemical defenses against infection. Overfed plants weaken their defenses.
While obligate parasites such as downy and powdery mildew proliferate at high N levels, facultative parasites are sometimes suppressed by higher N content in the crop. Facultative parasites such as Fusarium, Alternaria and Xanthomonas feed on dead or damaged plant tissue. Management practices that can keep plants vigorous and prevent senescence, or cell death, will reduce damage from facultative pathogens. If Fusarium is a known problem in the field, preventing N deficiency should be the first preventative action against infection.
Starving the crop of N will surely weaken the plant, making it more vulnerable to attack. However, more N is not always protective, even against facultative pathogens. Some facultative bacterial and fungal foliar diseases proliferate under high N applications because they preferentially feed on young, succulent tissue. N fertilization increases vegetative growth, attracting pathogens with tender new leaves and stems.
Evaluating the crop’s nitrogen status by taking frequent leaf samples and conducting the soil nitrate quick test can help farmers and advisers determine how much N to apply to stay in the proverbial goldilocks zone.
Potassium, Calcium and Magnesium
Potassium (K) fertilizer is another critical defense against crop disease. K applications reduce both facultative and obligate parasite infections through two main mechanisms. First, K can thicken and strengthen cell walls, helping to keep pathogens out. Second, K deficiency impairs protein, starch and cellulose synthesis, leading cells to accumulate amino acids and sugars. Weak cell walls leak these metabolites, attracting and feeding parasitic organisms.
K applications can decrease both disease incidence and severity. Researchers have shown that K fertilization reduces damage from bacterial leaf blight in wheat, rice and cotton. Others have demonstrated reduction in leaf spot, sheath blight and stem rot in a variety of crops (Dordas, 2008).
Calcium (Ca) deficiency promotes pathogen growth in similar ways as K deficiency. Ca is a critical component of cell wall structure and membrane integrity. When Ca levels are low, the plant is vulnerable to fungal infection via the xylem. Once inside the plant, pathogenic fungi damage vascular tissue and the crop wilts.
Ca deficiency can cause severe physiological disorders such as bitter pit in apples and blossom end rot in tomatoes and peppers. Former UC plant pathologist and current director of TriCal Diagnostics Dr. Steven Koike warns against black heart in celery. Black heart, a Ca deficiency disorder, causes young growth in the heart of the plant to brown and blacken. Koike explains that as the celery grows, the necrotic tissue is pushed up and exposed to air where it can easily come into contact with pathogenic fungal spores. Sclerotinia spores aggressively attack damaged tissue leading to severe infection. Ca deficiency in other crops creates similar damaged entry points for pathogens.
Ca fertilizer applications can prevent infection in the field and can continue supporting the yield postharvest. Amending the soil with Ca and increasing pH can suppress clubroot disease in cruciferous vegetables such as broccoli and cabbage. Ca applications can also suppress Pythium, Rhizoctonia and Botrytis. Foliar Ca sprays shortly before or after harvest increase shelf life and help fruit resist rotting (Gupta et al., 2017).
Magnesium (Mg) deficiency is less common and perhaps less obvious than Ca or K deficiency, but Mg is no less important. Magnesium is at the center of chlorophyll and facilitates photosynthesis. When Mg is low, photosynthesis is reduced, causing a cascade of negative consequences. Among other issues, Mg deficiency causes a buildup of sugars and amino acids in leaves, attracting and feeding pathogens. Mg, K and Ca are all positively charged cations and compete for uptake via the roots. Mg deficiency often occurs in high-potassium soils and can be worsened by K fertilization. Pre-plant soil testing can help determine whether Ca, K and Mg fertilization are advisable.
Phosphorous
After N, phosphorus (P) is the second-most widely used mineral nutrient. The effects of P applications on disease suppression are less clear than the other nutrients. P fertilization is most helpful in fighting root rot when applied to seedlings. Plenty of P helps young plants quickly develop strong root systems and escape infection during their most vulnerable early stages of development (Dordas, 2008). P foliar applications can also provide local protection and systemic resistance against powdery mildew in some crops. However, other studies have shown increased disease after P fertilization (Dordas, 2008). Providing adequate P for growth is critical, but applying additional P does not necessarily confer any protection against disease.
Micronutrients
Micronutrients including boron, copper, manganese and zinc affect disease incidence in many ways. Micronutrients are critical to plant metabolism, cellular structure and stress responses. Manganese fertilization can suppress disease by supporting production of lignin and suberin, which provide chemical defense against fungal infection. Low zinc can cause accumulation and leakage of amino acids and sugars as seen with macronutrient deficiencies. Boron is critical to cell structure and lignin formation. Micronutrient applications can also prevent disease by activating the plant’s defense mechanisms against a broad range of pathogens. Deficiencies in any of the micronutrients increases the crop’s vulnerability to infection.
Optimizing Nutrient Management
Complex interactions between the pathogen, the host and the surrounding environment determine disease incidence and severity. We can use nutrient management to strengthen the host and manipulate the soil in ways that suppress pathogens. Whenever possible, determine which diseases your crop will likely face. Review field history and send soil and infected plant tissue to a pathologist like Dr. Steven Koike at TriCal Diagnostics. Conduct preplant soil tests to determine pH and baseline nutrient levels. For example, if you anticipate Fusariam pressure, adjust pH to neutral or slightly alkaline using lime. Plan foliar micronutrient applications to compensate for decreased manganese and iron availability at elevated pH. Other diseases and soil conditions will require different techniques.
Increasing beneficial microbial activity and increasing soil organic matter can build a suppressive soil environment and simultaneously increase nutrient availability. In addition to nutrient fertilizer applications, consider amending the soil with composts and biostimulant products such as seaweed extracts, humic acids and beneficial microbial inoculants.
Many strategies can increase nutrient availability and help crops defend themselves against disease. The CCA and PCA should develop a plan that will meet the unique conditions on each ranch.
References
Dordas, C. (2008). Role of nutrients in controlling plant diseases in sustainable agriculture. A review. Agronomy for Sustainable Development, Springer Verlag/EDP Sciences/INRA, 2008, 28 (1), pp.33-46. ffhal-00886444f
Gupta, N., Debnath, S., Sharma, S., Sharma, P., Purohit, J. (2017). Role of Nutrients in Controlling the Plant Diseases in Sustainable Agriculture. In: Meena V., Mishra P., Bisht J., Pattanayak A. (eds) Agriculturally Important Microbes for Sustainable Agriculture. Springer, Singapore. https://doi.org/10.1007/978-981-10-5343-6_8.
Huber, D.M. & Haneklaus, S. (2007). Managing nutrition to control plant disease. Haneklaus/Landbauforschung Völkenrode. 4.
Foliar nutrient applications offer a number of benefits over, or in addition to, soil applied applications under the right conditions (photo by Cathy Merlo.)
According to studies from the United Nations, the world population will increase by 1 billion people over the next decade, reaching an estimated 8.6 billion people by 2030. By 2050, Earth will have 9.8 billion inhabitants. This enormous population growth will be coupled with a corresponding increase in demand for food. Projections from the FAO have indicated that agricultural production worldwide will have to increase by an estimated 50% by 2050 to meet the needs of a growing population.
Proportionately, agricultural land is becoming scarce. Therefore, one of the biggest challenges is to improve the yield, quality and shelf life of crops by using the best fertilizers, applied in very precise doses and with proven methods. One of the best procedures to reach those goals is foliar application of nutrients in customized doses based on critical timing for each crop.
Foliar feeding is the entry of small amounts of liquid fertilizer through the surface of plant tissue. This can allow for rapid nutrient utilization by the plant. Foliar feeding provides the consultant and applicator the ability to blend the fertilizer with other products such as pesticides and micronutrients.
Current formulations of liquid fertilizers are believed to penetrate mostly the transcuticular pores on foliage, which are open virtually all the time compared to stomata. Nutrients also enter stomata, but these often are closed due to environmental stresses and darkness. Most stomata are located underneath leaves away from fertilizer spray patterns. Drawbacks to foliar feeding include the inability to apply large amounts of N, phosphorous (P) and potassium (K) without potentially burning the foliage and possibly scarring the fruit. Therefore, frequent applications of the right fertilizer and fertilizer blends at a low volume are required to maintain optimum tissue levels of key nutrients, resulting in consistent plant growth and functions like the production and transference of assimilates.
Foliar Nutrient Applications
Selecting the right fertilizers will continue to be an important part of the equation to improving yield, quality and shelf life of crops. How we apply the nutrient is also vital. Let us examine foliar spraying more closely. Crops treated with foliar spray tend to have a higher nutritional value. Improved Total Soluble Solids (TSS) have contributed to increased sugar, vitamins, minerals and proteins in the harvested crops. It is not enough just to grow more crops, but those crops must have better nutritional value for us as well.
We can see very positive effects by examining just one mineral nutrient such as K. K regulates plant functions and increases nitrogen efficiency. By increasing the saline concentration of the cells, the plants are better able to resist frosts. Applied at the right time and in the correct amount, K promotes the development of a stronger cell structure, which allows the crops to better withstand drought, disease and pests. A better internal structure promotes a prolonged shelf life. In many of our soils, we lack adequate available K to meet the crop demands. One way to meet those phenological growth stages is to supplement K sprays. This could affect the production levels and quality of numerous crops such as tuber fill and skin condition in potato, nut meat density in almond and even oil production in mint.
Originally, it was thought that using foliar nutrient applications was only appropriate when a nutritional deficiency was present. This is definitely not the case. Ongoing scientific research has consistently shown that periodic applications of certain nutrients in various crops can have a positive effect on both quantity and quality of fruits, nuts, vegetables and grain crops. Although most supplemental nutrients are absorbed through the root system, it is also important to note that leaves (and to a lesser degree stems,) flowering plant tissues and even fruit surfaces can absorb limited amounts of nutrients. It is crucial to understand which nutrients can be supplied effectively by foliar applications if the soil-supplied nutrients are inadequate or impaired in some way.
In agriculture, our scientists have identified many cases where nutrient supplementation using a foliar application may be considered more effective than an in-crop topdressing application. One such situation that has had success is during late stages of fruit development where Ca sprays applied through the season to apples has shown ability to combat Ca deficiency. This deficiency is directly connected with the physiological disorder called bitter pit. The application of Ca making direct contact with the fruit has shown good results in controlling this disorder. Also, Ca being sprayed on cherries preharvest amounted to less cracking in fruit during late maturation stages.
Research trials done in almonds have also demonstrated where a foliar-applied nutrient can have a huge impact on a crop. Knowing that fruit set is crucial in almond trees, it has been proven that micronutrients, zinc (Zn) and especially boron (B), have a significant impact on fruit set as well as on fruitlet abscission. In several fruit trees, it has been reported that even foliar spraying of one or both elements has improved productivity. In one experiment, Nonpareil trees were sprayed at full blossom with boric acid at 0.2%, Zn-50 at 0.3% and, with the combination of these micronutrients as a separate treatment, compared with a non-sprayed control. Fruit set of the B treatment was 27.7% and Zn was 22.2%. However, the B + Zn combination produced a significantly higher fruit set (38.1%) (Sotomayor et al., 2002).
Additional Benefits
As consultants, we must understand that at times only a small amount of a specific nutrient is required, and due to low soil mobility of the nutrient, it is actually more efficient to supply the small amount of needed nutrient as a foliar application. This can be the case for both macronutrients and micronutrients.
There can also be other conditions that cause a nutrient to be less available to crop roots. One example is cool, excessively wet conditions on an alkaline soil (e.g. pH >8.0) where iron is less available to certain crops (e.g. iron chlorosis of citrus trees) in heavy wet clay. Even if supplemental iron fertilizer has been applied to the soil before or at planting, it may not be available through the roots. This can also be true for numerous other crops. By monitoring the trees and observing patterns, we can offset the chlorosis in our crop with a supplemental iron foliar application. Spray applications of elements such as iron, zinc, copper and manganese may have to be repeated every three weeks when we get deficiencies of these nutrients.
Many studies include yield data collected after applying foliar sprays of various fertilizer solutions, not only to nutritionally deficient crops, but even to crops that have adequate levels of nutrients such as potassium. Crops including wheat, almonds, tomatoes, citrus, cucurbits, pome fruits and rice among many others react positively to certain nutrient sprays even when adequate soil nutrient levels are present.
A good reference to the benefits of foliar spraying is in citrus research. After years of trials addressing HLB or Huanglongbing citrus greening disease in Florida, it was determined that a foliar nutrition approach to the disease was a very viable option (www.citrusbr.com.br/download/Foliar_nutrition_forHLB.pdf). The nature of the disease restricts the ability of the plant to adequately take up nutrients though its damaged root system. Finding an alternative way to increase plant nutrition and prolong the life and productivity of the infected tree was crucial. Numerous combinations and timings were trialed.
Trials show that in the case of one nutrient combination, potassium nitrate feeding increased yields in citrus. Foliar applications with potassium nitrate have proven to be highly efficient in fulfilling the potassium requirements for many crops. The combination of potassium and nitrate in this fertilizer has been found to be beneficial in improving fruit size, dry matter, color, taste and integrity as well as resistance to biotic and abiotic stresses for citrus and tomato fruit. Moreover, the integration of potassium nitrate in routine management or in specific growth stages resulted in remarkably positive benefits to cost ratio.
Take Caution
In our management plan, caution should be used when foliar application might be more efficient but not practical. When a foliar application is relatively effective, but we cannot supply the needed nutrient in one application, multiple applications would be needed, spaced out sufficiently and timed as often as once a week. Multiple applications in field crops can be expensive due to fuel, equipment and labor costs, or where there may not be sufficient time to apply enough of the needed nutrient. We must measure the economics and limitations when determining our fertilizer plan.
In the case of a severe P deficiency, there may not be time to apply sufficient applications of low rates of foliar P to be effective. The application costs can become excessive based on the return in production. In this situation, it may be better to realize there is not much that can be done in the current season to correct the issue. Recognizing the deficiency, the preferred course of action is to apply sufficient P fertilizer to the soil prior to the planting of subsequent crops to correct the P deficiency.
If we continue to use phosphorus P as an example, we also need to understand foliar P efficiency and when it does have a fit in our fertilizer program. Foliar-applied nutrients have the benefit of being 4 to 30 times more efficient, and there is no risk of groundwater contamination. Studies using labeled P on apple, cherry, corn, tomato, potato and bean crops have shown that as much as 12 to 14% of the total P can be supplied by multiple foliar sprays. Since P can be very immobile in the soil, foliar applications can be up to 20 times more effective than soil applications.
Recognizing another nutrient use as a foliar, we can see that some foliar N sprays compared to soil applications of N include lower application rates and the ease of obtaining timely, uniform applications. With attention to best-use guidelines, the efficiency of foliar-applied N may be optimized at nearly 95 to 100%. Based on the foregoing information, if the recovery of soil-applied N can be impaired to as low as 15 to 62%, it can then be concluded by the method of estimation that foliar-applied N has an efficiency of 1.3 to 1.6 times soil-applied N at the low end and seven times at the upper end. If foliar-applied N can be up to seven times more efficient than soil-applied N, then on a pound-for-pound basis, it makes sense that we could use this information to prevent N loading to ground water. In crops such as citrus, cherries and wine grapes, we may be able to achieve 100% of the needed N by foliar application. This is not always the case, but understanding your N efficiency in your soils may prompt the need for a supplemental foliar N application. Mature, low-N-requiring crops could acquire 40 to 50 pounds N with foliar application alone. This in no way warrants replacing all of our soil applied N in all crops by using foliar.
Conclusion
In summary, it should be pointed out that we have barely scratched the surface of all the features and benefits of foliar nutrition sprays. Get to know your crop and soils as well as the correlation between total nutrients and available nutrients. Understand if your crop has shown positive response to foliar treatment even when adequate nutrient levels are in the soil. Ask yourself: when do soil conditions prevent adequate nutrient uptake? What conditions should I be aware of to optimize foliar applications (rain, temperature, wind, sprayer capability, pH of my solution, humidity, physiological growth stage, activity of plant parts like stomate, additives such as pesticides or adjuvants and antagonist as well as synergistic reactions with other nutrients.) Study absorption rates and what affects them. Like all other things in agriculture, foliar nutrition is a tool.
References
Sotomayor, C., Silva, H. and Castro, J. (2002). Effectiveness of boron and zinc foliar sprays on fruit setting of two almond cultivars. Acta Hortic. 591, 437-440, https://doi.org/10.17660/ActaHortic.2002.591.67.
The study included six treatments applied to 300-ft-long
beds with single drip tape in the center and two rows of
strawberry plants (all photos by S. Dara.)
Microbial and botanical biostimulants have been used for promoting plant growth and to help plants withstand various pests, diseases or environmental stressors. While macro and micronutrients are necessary for plant growth and optimal yields, biostimulants play multiple roles by increasing the bioavailability of nutrients, improving nutrient and water absorption, and protecting plants from pestiferous organisms, either through direct antagonism or by triggering plants’ defense mechanisms (Berg, 2009). In addition to improving health and yields, biostimulants are also known to increase nutritional quality (Parađiković et al., 2011; Fierentino et al., 2018).
Multiple field studies in California demonstrated the potential of biostimulants and soil amendments in improving yields in tomato (Dara, 2019a; Dara and Lewis, 2019) and strawberry (Dara and Peck, 2018; Dara, 2019b). As the knowledge of biostimulants and their potential for sustainable agriculture is expanding, there has been a steady introduction of biostimulant products in the market warranting additional studies. A study was conducted to evaluate the potential of different biostimulant materials on strawberry growth, health and fruit yields.
The study measured the impact on growth, health and yield parameters for each treatment.
Methodology
This study was conducted in an experimental strawberry field at the Shafter Research Station during 2019-2020. Cultivar San Andreas was planted on October 29, 2019. No preplant fertilizer application was made in this non-fumigated field, which had both Fusarium oxysporum and Macrophomina phaseolina infections in the previous year’s strawberry planting.
Each treatment was applied to a 300-foot-long bed with single drip tape in the center and two rows of strawberry plant on either side. Sprinkler irrigation was provided immediately after planting along with drip irrigation, which was provided one or more times weekly as needed for the rest of the experimental period. Each bed was divided into six 30-foot-long plots representing replications with 18-foot buffers in between. This study included both biostimulant and nutrient supplements, but this article presents data from the biostimulant treatments only. Treatments were applied either as fertigation through the drip system using a Dosatron, or sprayed over the plants with a handheld garden sprayer.
Treatments
The following treatments were evaluated in this study:
Grower Standard (GS): Between November 6, 2019 and May 9, 2020, 1.88 qt of 20-10-0 (a combination of 32-0-0 urea ammonium nitrate and 10-34-0 ammonium phosphate) and 1.32 qt of potassium thiosulfate were applied 20 times at weekly intervals through fertigation. This fertilizer program was used as the standard for all treatments except for the addition of biostimulant materials.
GS + Abound: Transplants were dipped in 7 fl oz of Abound (azoxystrobin) fungicide in 100 gal of water for four minutes immediately before planting. Transplant dip in a fungicide is practiced by several growers to protect from fungal diseases and is considered as another standard in this study.
GS + Str10 + Rhizolizer: Str10 (Wickerhamomyces sp.) was applied at 5 fl oz/ac with molasses at 10 fl oz/ac immediately after planting and Rhizolizer (Trichoderma harzianum and Bacillus amyloliquefaciens) at 3 fl oz with a food source blend at 10 fl oz two weeks after Str10 application through the drip system. The same pattern was repeated starting from mid-February 2020. From February to May, 6 fl oz/ac of Rhizolizer was applied with 20 fl oz/ac of food source once a month. Str10 is an unregistered product with yeast that is expected to help with nutrient uptake and phosphorous mobilization for improved plant vigor and yield. Rhizolizer is expected to solubilize soil nutrients and improve crop growth and yield.
GS + ON-Gard: 32 fl oz of ON-Gard was applied every two weeks through the drip system from planting until canopy development and then sprayed in 50 gpa. ON-Gard is expected to increase the nutrient use efficiency and decrease abiotic stress to the plants.
GS + ON-Gard + RootShield Plus: 32 fl oz of ON-Gard (soy protein-based) was applied every two weeks through the drip system from planting until canopy develops and then sprayed in 50 gpa. RootShield Plus WP (T. harzianum and T. virens) was also applied at 2 lb/ac through drip immediately after planting with 1 lb/ac at the end of November and again at the end of December 2019. RootShield is a biofungicide expected to protect strawberry from phytopathogens and improve water and nutrient uptake.
GS + CropSignal: CropSignal was applied at 10 gpa six days before planting and at 5 gpa 30 days after transplanting through the drip system. CropSignal is a carbon-based nutrient formula containing botanical extracts along with cobalt, copper, manganese and zinc, and is expected to support the growth and diversity of beneficial aerobic soil microbes for improved soil structure, water retention, nutrient cycling and plant protection.
Parameters observed during the study included canopy growth (area of the canopy) in January, February and March; first flower and fruit count in January; leaf chlorophyll and leaf nitrogen (with chlorophyll meter) in January, February and May, fruit sugar (with refractometer) in March and May; fruit firmness (with penetrometer) in March, April and May; severity of gray mold (caused by Botrytis cinereae) and other fruit diseases (mucor fruit rot caused by Mucor spp. and Rhizopus fruit rot caused by Rhizopus spp.) 3 and 5 days after harvest (on a scale of 0 to 4 where 0=no infection; 1=1-25%, 2=26-50%, 3=51-75% and 4=76-100% fungal growth) in March and May; sensitivity to heat stress (expressed as the number of dead and dying plants) in May; and fruit yield per plant from 11 weekly harvests between March 11 and May 14, 2020. Data were analyzed using analysis of variance in Statistix software and significant means were separated using the Least Significant Difference test.
Results and Discussion
The impact of treatments varied with different measured parameters. The interactions among plants, beneficial and pathogenic microorganisms in the crop environment, the influence of environmental factors and how all these biotic and abiotic factors respond to various biostimulant inputs can be very complex. The scope of this study was only to measure the impact on growth, health and yield parameters, not to investigate those complex interactions.
The canopy size does not always correspond with yields but could be indicative of stresses and how the plant is responding to them in the presence of treatment materials. Plants in some treatments had significantly larger canopy size in January and February, but the grower standard plants were significantly larger than the rest by March. Leaf chlorophyll and nitrogen contents were significantly different among treatments only in January where the grower standard plants had the lowest and the plants that received CropSignal had the highest. When the counts of the first onset of flowers and developing fruits were taken in January, plants that received ON-Gard alone had the highest number followed by the CropSignal and Abound treatments.
A similar trend was also seen for the average fruit sugar content. There was no statistically significant difference in the average fruit firmness among the treatments, although the value was numerically higher for the fruits in the CropSignal treatment. Severity of the gray mold, which occurred at low levels during the observation period, did not statistically differ among the treatments, but it was numerically higher in fruits from the grower standard plots. However, the severity of other diseases was significantly different among various treatments with the highest level in fruits from the grower standard and the lowest in fruits from plants that were treated with Abound. Temperatures were unusually high during the last week of May, and several plants exhibited heat stress and started to die. The number of dead or dying plants on May 28 was the highest grower standard and the lowest in Str10 + Rhizolizer and Abound treatments, although the differences were not statistically significant.
Table 1: The trial showed significant differences in marketable and unmarketable fruit yields among treatments.
There were significant differences in marketable and unmarketable fruit yields among treatments (see Figure 1.) Highest marketable yields were seen in ON-Gard and CropSignal treatments followed by the grower standard, ON-Gard + RootShield and Str10 + Rhizolizer. Transplant dip in a fungicide seems to have a negative impact on fruit yields as observed in the current study or earlier studies (Dara and Peck, 2017 and 2018; Peck unpublished data). While the grower standard had the highest amount of unmarketable fruits, the Str10 + Rhizolizer treatment had the lowest in this study. Fruit yield and some of the observed parameters appeared to be better in the grower standard with no fungicide or biostimulant
treatments, which has also been seen in some earlier strawberry studies.
Compared to the grower standard, marketable fruit yield improvement was seen only in ON-Gard and CropSignal treatments. However, marketable fruit yield was higher in all treatments compared to the grower standard with Abound. Sometimes, natural balance of the nutrients, organic matter and microbial community in the soil might result in optimal yields in the absence of pathogens or other stressors. However, it is very common to use fungicidal treatments or add biological or synthetic amendments to protect from potential threats and improving yields. These results help understand the impact of various biostimulant materials and warrant the need to continue such studies under various environmental, crop and soil conditions.
Field assistant Tamas Zold measures fruit weight to further determine impacts on treatments.
References
Berg, G. 2009. Plant-microbe interactions promoting plant growth and health: perspectives for controlled use of microorganisms in agriculture. Appl. Microbiol. Biotechnol. 84: 11-18.
Dara, S. K. 2019a. Effect of microbial and botanical biostimulants with nutrients on tomato yield. CAPCA Adviser, 22(5): 40-45.
Dara, S. K. and D. Peck. 2017. Evaluating beneficial microbe-based products for their impact on strawberry plant growth, health, and fruit yield. UCANR eJournal of Entomology and Biologicals. https://ucanr.edu/blogs/blogcore/postdetail.cfm?postnum=25122.
Dara, S. K. and D. Peck. 2018. Evaluation of additive, soil amendment, and biostimulant products in Santa Maria strawberry. CAPCA Adviser, 21 (5): 44-50.
Dara, S. K. and E. Lewis. 2019. Evaluating biostimulant and nutrient inputs to improve tomato yields and crop health. Progressive Crop Consultant 4(5): 38-42.
Fiorentino, N., V. Ventorino, S. L. Woo, O. Pepe, A. De Rosa, L. Gioia, I. Romano, N. Lombardi, M. Napolitano, G. Colla, and Y. Rouphael. 2018. Trichoderma-based biostimulants modulate rhizosphere microbial populations and improve N uptake efficiency, yield, and nutritional quality of leafy vegetables. Frontiers in Plant Sci. 9: 743.
Parađiković, N., T. Vinković, I. V. Vrček, I. Žuntar, M. Bojić, and M. Medić-Šarić. 2011. Effect of natural biostimulants on yield and nutritional quality: an example of sweet yellow pepper (Capsicum annuum L.) plants. J. Sci. Food. Agric. 91: 2146-2152.
(The author would like to thank BioWorks, Inc., Fauna Soil Production and Locus Agricultural Solutions for the financial support of the study and Marjan Heidarian Dehkordi and Tamas Zold for their technical assistance.)
Soil chemical analysis is the cornerstone of an effective nutrient management program. Without a reliable soil test, significant miscalculations in fertilizer recommendations can occur, leading to drastic effects on profitability and the environment as a result of under and overfertilization and soil amendment recommendations.
Despite the large number of analytical commercial laboratories serving California agriculture, deciding which laboratory to send a sample to can be a daunting task. Unfortunately, there are no public data reporting the accuracy of the analysis performed by agricultural laboratories, and there isn’t a “true” certification program in the U.S. Although a lab may participate in a proficiency program such as the Agricultural Laboratory Proficiency (ALP) program or the North American Proficiency Testing (NAPT), these programs are not mandatory, nor do they certify lab quality. Therefore, laboratories are chosen based on “word of mouth” and prices, which can vary significantly.
Because of the absence of data, growers, farm managers, consultants, environmentalists and even researchers are left without a reliable means by which to select a testing laboratory. A study was conducted in 2019 to assess the performance of soil testing laboratories.
Accuracy and Precision Assessment
Four reference soil samples from the ALP program were submitted to eight commercial Ag laboratories in the Western U.S. (seven in California and one in Idaho) for typical fertility analyses. In most cases, fertility “package analyses” offered by the laboratories were chosen in order to optimize project funds. The same four reference soil samples were resubmitted two more times totaling three rounds, approximately three months apart each round, in order to assess the precision of each laboratory.
Methods and materials used for the laboratory accuracy assessment (photo courtesy A. Biscaro.)
Standard reference soil samples were selected from the ALP program archives, each previously analyzed by a minimum of 30 credible laboratories, in triplicate for each soil sample (totaling 90+ analyses per reference soil.) The median and median absolute deviation (MAD) of these 90+ analyses per reference soil were used to assess the accuracy and precision of the eight laboratories assessed in this study (method based on ALP consensus statistics.) While the accuracy assessment is focused on contrasting each analysis with the ALP medians, the precision assessment is focused on the variability of the analyses across the three rounds (same reference soils analyzed at different times.) Sample IDs were modified and submitted to each laboratory so they wouldn’t be aware of the objectives of the study. Names of laboratories are not disclosed to follow university policy; laboratories are referred as #1 to #8 for discussion purposes.
Each reference soil was analyzed for NO3, P, extractable K, Na, Ca and Mg, SO4-S, electrical conductivity (ECe), Cl, Ca, Mg, Na and B, pH and five micronutrients. Some labs provided additional analyses in their fertility package, such as soil organic matter, estimated and measured CEC and others, however, these were not used in this study since they were not performed by all laboratories. Nineteen analyses performed on four reference soils by eight laboratories three times equals a total of 1,824 analyses, or 228 per laboratory. While that is a rich dataset, trying to create a performance rank for the laboratories across all analysis types is quite challenging since there are multiple types of soil analyses, extraction methods and units. For that reason, performance standards used by the ALP program were applied to this project in order to assess the accuracy and precision of the analysis performed by the laboratories. Eight analyses were chosen for this assessment: Olsen P, extractable K, Ca and Mg, ECe, pH, sodium adsorption ratio (SAR) and DTPA Zn. For the purpose of accuracy assessment, each of these analyses were attributed a pass or failure score, totaling 96 scores per laboratory (8 analysis types, 4 reference soils and 3 rounds). The precision assessment was based on the relative standard deviation of each analysis across the 3 rounds.
Although all labs presented certain inaccuracy and imprecision, some stood out. Laboratories #2 and #8 were consistently inaccurate and imprecise, while laboratories #1 and #7 were the most accurate and precise. Laboratory #8 in particular presented the poorest performance for both accuracy and precision. Laboratories #3, #4, #5 and #6 presented varying accuracy and precision. These patterns of accuracy and precision are illustrated in the three graphs below.
Laboratory Results
Figure 1 illustrates the results for saturated paste pH for soil C. Listed is the pH median and the Median Absolute Deviation (MAD), with results for each lab and each round. Labs #1 and #7 were the most accurate over all rounds. Labs #2 and #8 had high bias, and lab #2 was imprecise (inconsistent). Due to funding limitations, only two rounds of samples were submitted to lab #7.
Figure 1. Soil pH analysis by the saturated paste method performed by eight commercial laboratories for soil C.
Results for exchangeable potassium analysis by ammonium acetate for soil C (Figure 2) illustrates a common occurrence of accuracy levels observed across most reference soils used in this study. Generally, labs #1 and #7 consistently reported results near the median.
Figure 2. Exchangeable potassium analysis by ammonium acetate extract performed by eight commercial laboratories for soil C (SRS-1604).
Results for Zn extractable by DTPA for soil A (Figure 3) show a general trend of all eight labs reporting higher Zn values relative to the median for this standard reference soil of 0.9 ppm. Labs #1, #4, #5 and #7 generally reported equivalent Zn concentrations for each round. Labs #2, #3, #6 and #8 were inconsistent across the three rounds. Lab #6 in particular reported values that varied by 300% across the three rounds.
Figure 3. Zinc analysis by the DTPA method performed by eight commercial laboratories for soil A (SRS-1809).
Need for Consistency
Besides the accuracy and precision parameters assessed in this study, it seems like consistency is an overall challenge for the lab industry: consistency of methods used for certain analyses, of how methods and units reported, and of the interpretation of the results (e.g. graphs illustrating sufficiency and deficiency ranges). Although it is the responsibility of the client to verify the methods used and request the most pertinent information for their application, many growers and farm managers are not familiar with the intricacies of soil analyses and nutrient management. Hence, providing an electrical conductivity analysis in 1:1 or 1:2 extraction instead of the standard saturated paste extract (ECe) can lead to misleading conclusions and inappropriate management decisions since the literature for most salinity thresholds for crop yields were defined with the saturated paste extract method. Another observation in regard to the analysis type is about the phosphorus extraction method used for soils with different pH, where some labs used the Olsen extraction method for soils with pH below 6.0, and others utilized the Bray P1 method.
Soil testing lab users in California and in the Western U.S. could benefit tremendously from a certification program designed to certify the accuracy and precision of all labs on a regular basis. Please feel free to contact the lead author directly for more detailed information about this study at (805) 645-1465.
The author wishes to acknowledges the following contributors to this article: Robert Miller, ALP Program Director, former Extension Soil Specialist UC Davis; Dirk Holstege, Director, UC Davis Analytical Laboratory (retired); UCCE Advisor Steve Orlof, Siskiyou County (in memorian); Tim Hartz, UCCE Vegetable Crops Specialist, UC-ANR (retired); Ben Faber, UCCE Advisor, Ventura County; Anthony Luna, UCCE Advisor, Ventura County; and Eryn Wingate, Agronomist, Tri-Tech Ag Products.
Control a second-generation autonomous UV-C application platform being evaluated at the Appalachian Fruit Research Station in Kearneysville, W.Va. This research plot was established to study the natural infestation of strawberry plants by pestiferous insects and mites in pesticide- and UV-C treated plots as well as in control plots (no UV-C and pesticides.) The robot has been programmed to capture images for phenotyping of strawberry plants. The person in the foreground is controlling the UAV flying over the plot (photos courtesy F. Takeda.)
This article summarizes the recent work of a multi-disciplinary research team on strawberry disease and arthropod pest management using a robotic Ultraviolet-C (UV-C) irradiation machine. The team’s desire to develop novel approaches for more sustainable strawberry culture (e.g. non-chemical and safer use of ultraviolet light) was based on the following factors: Reliance on fungicides for management of diseases (e.g. development of resistance to more synthetic pesticides, phytotoxicity, environmental issues, application residues, etc.,) make chemical management of Botrytis gray mold of strawberry often challenging and costly, especially when the harvesting period exceeds six months; Pestiferous insects and mites are developing resistance to synthetic pesticides, increasing demands by consumers for pesticide-free berries; Need for automation to reduce labor input in the field; Need for systematic approaches for disease and pest management that are less intrusive to workers in the field, harvesting and myriads of seasonal cultural operations.
Sustainable Approach Through UV-C
The idea of using UV light to control fungal diseases of strawberry fruit came from a discussion between Drs. Janisiewicz and Takeda in 2010 about problems with use of fungicides and needs for alternative control methods. UV light includes electromagnetic radiation with wavelengths between 100 and 400 nanometers (nm), which is shorter than that of visible light but longer than X-rays. UV radiation is present in sunlight, but almost all the UV light produced by the sun is filtered out by the ozone in the upper atmosphere. UV light can also be produced by specialized lights such as mercury-vapor lamps and tanning lamps, LEDs and specific wavelength excimer lamps. UV radiation is subdivided into three general classes based on their wavelengths (i.e. UV-A ranges from 315 to 400 nm, UV-B ranges from 280 to 315 nm, and UV-C ranges from 100 to 280 nm.)
Research with UV-A and UV-B has shown that insect behavior could be altered by modulating UV irradiation levels. Research on UV-B showed that a nightly ~3-hour exposure time was necessary to achieve adequate control of diseases such as powdery mildew on grapes and strawberry. UV-C irradiation is used to kill microorganisms in different situations including sterilization of air in hospitals, water treatments, sterilizing laboratory benches and treatment of meat and poultry products. The FDA has determined that UV light can be used to surface sterilize food products, and considers UV light to be safe when precautions are taken by the user.
The use of UV light in crop production, however, has been limited because the doses required to kill plant pathogens usually can cause damage such as leaf burn and defoliation. The goal of the team’s research program has been to develop UV-C treatment methods that have high efficacy for disease and pest control without damaging plants and are cost effective.
What is known is that UV-C irradiation kills microorganisms and arthropod pests by damaging their DNA. What other agricultural researchers had not considered in their treatment protocol was the fact that microorganisms and mites have a special mechanism for repairing the damaged DNA. This occurs when light is present, e.g. the repair process is “light activated”. Thus, there is a simple question: What happens if the microbes are irradiated with UV-C at night and they are kept in the dark for certain periods of time? The reasoning for this approach was a) That the dark period following UV-C irradiation will prevent the activation of this DNA repair mechanism that needs sunlight to become active and b) Without the ability to repair the damage to DNA, the organism would not be able to replicate and further infect plant, eventually causing the microbes to die. The night application of UV-C light for control of pathogens and pests allowed the team to use much lower doses of UV-C light that was still effective and, more importantly, was below the threshold that causes damaging effects on the strawberry plant.
Robotic Application Methods for Pest and Disease
In the May/June 2018 issue of Progressive Crop Consultant, the team reported on the use of germicidal UV-C irradiation for the control of major fungal diseases of strawberries (e.g. gray mold, anthracnose and powdery mildew.) Currently, the team has prototype autonomous platforms applying UV-C light to in-soil strawberry plants at night. As the research on diseases progressed, the project expanded to include management of insects and mites and development of an autonomous vehicle to apply UV-C treatments. The team is aware that research on using UV-B and UV-C irradiation to control diseases and arthropod pests on various crops had been conducted for more than two decades in various laboratories around the world, including several in the U.S., the Netherlands, Belgium, Brazil, Canada, China, Japan, Norway and the United Kingdom. Their research consistently reported plant damage described as burns, leaf curls and defoliation after irradiating the plants with doses required to control diseases and arthropod pests. Recently, some of these laboratories have transitioned to using UV-C lamps in their research.
The effect of treating strawberry plants with UV-C light on subsequent infection by anthracnose fungus (Colletotrichum gloeosporioides 162). Two agar plugs with fungal mycelia were placed on each leaflet. The top row has three detached leaflets from UV-treated plants. Note that very narrow band around each plug with fungal inoculum has turned yellow after nine days. The bottom row shows leaflets taken from control plants (not exposed to UV-C irradiation.)
Our research approach has focused on new ways of using UV-C light to kill strawberry pathogens and arthropod pests (insects and mites) without damaging the strawberry plant. Initial studies clearly demonstrated that a dark period of 2 to 4 hours (depending on which pathogen was being controlled) immediately after a UV-C irradiation of one minute or less prevented microbes from repairing DNA damage (e.g. repair mechanism requires daylight) caused by UV-C irradiation and prevented the disease to develop on fruit and leaves. This method of UV-C irradiation at night resulted in lowering the effective doses needed to kill the microbes that cause strawberry gray mold, powdery mildew and anthracnose. The reduced doses required to kill plant pathogens caused no apparent damage to strawberry plants. Further analyses revealed there was no damage to chlorophyll, no reduction in photosynthetic activity, no loss in pollen viability (ability of pollen tube to grow through the style) and development of fruit, and no reduction in fruit phenolic content as determined by metabolomic analysis.
Another aspect of the team’s research program is to study other direct effects of UV-C light on plants. Since research was being conducted on diseases, the team asked, “Can UV-C light make the strawberry plant more resistant to fungal infection?”
It is known that when a plant is perturbed by abnormal environmental or biotic factors such as insect feeding, it responds by producing more phenolic and other chemical compounds such as jasmonic acid to make itself resist infection by a pathogen or an attack from insects and mites. For this test, the team harvested leaves from strawberry plants that had been treated with brief (15 to 60 second) nightly applications of UV-C irradiation for about a month and then inoculated each leaflet with two agar plugs with actively growing fungus-causing anthracnose (Colletotrichum). Over a period of 7 to 10 days, the team observed the infection (black and yellow lesion) develop on the leaves.
12A close-up of an autonomous vehicle which has a UV-C light array mounted on its frame operating in a commercial strawberry field. For the purpose of photography, the robot was operated shortly after sunset.
On the leaves taken from UV-C irradiated plants, the dark area was confined to the agar plug, while on the leaflets taken from untreated plants, the lesion radiated out from the plugs and caused large areas of the leaflet to turn black and yellow. The team’s research has shown that multiple levels of biological effects occur on disease-causing pathogens as well as make plants exposed to night-time UV-C light treatments more resistant to fungal infection.
The team also showed that night-time UV-C treatments were effective against insects and mites. A detailed study with plants artificially infested with ~100 two-spotted spider mites (TSSM) revealed that nightly 60-second UV-C irradiation of plants for six weeks had reduced mite populations to below a commercial treatment threshold of five mites per mid-canopy leaflet, while mite population on untreated strawberry plants exploded to over 300 mites per leaf. Tomato plants artificially infested with greenhouse whitefly (GWF) were irradiated for just 16 seconds nightly. The results showed a decline in adult, nymph and egg populations on UV-C treated plants within two weeks.
The team also conducted studies on spotted wing drosophila (SWD). In that study, store-bought strawberries were artificially infested with adult female SWD and then were subjected to a pulsed UV-C light treatment. Over time, 12 SWD on average emerged from each untreated control fruits compared to only 1 SWD among 40 UV-C treated fruits. A better way to use UV-C irradiation is to prevent fungal pathogens from infecting susceptible plants, pestiferous insects and mites from infesting the crops, and prevent egg laying in the fruit. The team has plans to refine the UV-C light regimen, quality and application technology to make the UV-C technology more practical for commercial berry producers. Currently, the team is exploring ways to use UV-C irradiation more effectively and to further reduce the time required to treat each plant so that the robot can travel over a larger area each day.
Things to Consider
Substantial costs can be incurred through application of synthetic pesticides, scouting or monitoring, especially if the annual crop is being harvested over six months. UV-C irradiation provides the opportunity to reduce chemical and labor inputs for management of T. urticae, gray mold, anthracnose, powdery mildew and pestiferous insects in the production of specialty crops. In the team’s research, the engineering aspects of the robot technology and optimizing the UV-C system to make the technology economically competitive with conventional chemical control approaches are being refined.
Further field-based validation is needed to confirm the efficacy of the system on a broader scale to compare with conventional management practices (e.g. pesticide application). Prototype autonomous mobile UV-C irradiation units that could traverse multiple strawberry rows have been developed and evaluated under field conditions. To date, the team has used strawberry plants and their fruit as a model system, but this UV-C technology may be widely applicable to other specialty crops.
Future Directions
Currently, the team is evaluating ways for reducing the duration and frequency of exposure, comparison of daytime and night-time applications and addressing the need for deeper penetration of UV-C light into the plant canopy. Mites prefer to colonize and
lay eggs on the undersides of leaves and in the lower portions of canopies. Therefore, UV-C penetration is critical. The team’s study has shown that UV-C ir radiation reaching the lowest portions of the strawberry plants was reduced by ∼45% compared to that received by the upper surface of leaves at the upper canopy. This reduction in intensity may have played a role in supporting the survivorship of mites recorded in the lower canopy. Japanese researchers have reported that reflective mulches enhance UV light penetration to the undersides of the leaves. Also, arthropod management with UV-C light should be examined in conjunction with our technology to increase management efficacy and bring pest populations below the economic threshold levels.
The positive results obtained from night-time application and relatively low doses of UV-C irradiation for controlling fungal pathogens and arthropod pests to date indicate the potential of UV-C treatments to reduce disease incidence and alter insect behavior impacting their herbivory and egg laying. The team will continue to explore the efficacy of the UV-C irradiation system for management of pestiferous mites and insects on other specialty crop plants. To make UV-C technology commercially useful for open-field strawberry growing systems and nurseries, a prototype robot for applying UV-C was developed and field-tested in 2019 and 2020. USDA is now collaborating with TRIC Robotics (tricrobotics.com), which has highly skilled robot engineers, manufacturing capacity, and provides on-the-go solutions for autonomous UV-C application for specialty crops. The robotic platform is agricultural equipment built to control pests and diseases. As such, UV-C application equipment will be certified by EPA as a pesticide device. The videos of their robot applying UV-C treatments in the field during night time and day time can be accessed on YouTube by searching the key words “TRIC Autonomous UV-C Treatment.”
Now, it is not so much a question of whether UV-C light treatments can be applied effectively to field-grown specialty crops, but how soon application equipment and UV-C technology will be available to large and small growers. The team is currently conducting R&D work to develop a commercially viable UV-C delivery system that is affordable, user friendly, generally compatible with current production practices, as effective in controlling diseases and pests as currently used pesticides and reduces the overall costs of disease and pest control practices.
It is important to develop a platform that is useful and affordable to small-acre strawberry growers. The Northeast has over 200 certified organic farms with five acres or less of strawberries. To fund this aspect of the UV-C research project, the team received a grant in 2020 from the USDA Northeast Sustainable Agriculture Research and Education (SARE) program to improve control of diseases and arthropod pests of strawberry. Also, the robotic UV-C application system is being developed for large-scale strawberry growers and nurseries in California and elsewhere. Cooperating growers in California have been identified to conduct large pilot studies that will begin in early 2021.
Summary
The management of disease-causing fungal pathogens and arthropod pests is a complex task for specialty crop producers, particularly given the occurrence of latent infection by Botrytis cinerea and the highly perishable nature of fruits and berries, and the need for a complete control of SWD in berry fields. This requires comprehensive knowledge of disease etiology, host-plant biology and the physical environment determining the severity of infection and pest infestation.
Failure to manage Botrytis cinerea at bloom will have an impact on subsequent stages of fruit development, especially when the fruit reaches harvest maturity. Future research will certainly focus on multi-pronged strategies instead of searching for a single “silver bullet” answer to produce effective, long-term solutions for specialty crop growers. These solutions will surely include genetic improvements, the integration of night-time UV-C applications for a range of cropping systems along with use of “clean” nursery plants, good sanitation practices, new chemicals, and knowing how environmental conditions affect the biology of pathogens and pests to reduce disease pressures and pest infestation.
Additional information on UV-C light technology can be requested from F. Takeda (fumi.takeda@usda.gov). Further discussion on the UV-C technology can be found in the additional resources section.
Additional Resources
Janisiewicz, W. J., Takeda, F., Glenn, D. M., Camp, M. J., and Jurick, W. M. II. 2016. Dark period following UV-C treatment enhances killing of Botrytis cinerea conidia and controls gray mold of strawberries. Phytopathology 106: 386-394. https://doi.org/10.1094/PHYTO-09-15-0240-R
Janisiewicz, W. J., Takeda, F., Jurick II, W. M., Nichols, B. and Glenn, S.M. 2016. Use of low-dose UV-C irradiation to control powdery mildew caused by Podosphaera aphanis on strawberry plants. Can. J. Plant Pathol. 38:430-439. https://www.tandfonline.com/doi/full/10.1080/07060661.2016.1263807
Takeda, F., Janisiewicz, W.J., Smith, B.J., Nichols, B. 2019. A new approach for strawberry disease control. Eur. J. Horticult. Sci. 84:3-13. https://www.pubhort.org/ejhs/84/1/1/index.htm
Short, B., W. Janisiewicz, F. Takeda, and L. Leskey. 20/18. UV-C irradiation as a management tool for Tetranychus urticae on strawberries. Pest Management Science 74(11):2419-2423. https://doi.org/10.1002/ps.5045
Sun, J., W. J. Janisiewicz, F. Takeda, B. Evans, W.M. Jurick, M. Zhang, L. Yue, and P. Chen. 2020. Effect of nighttime UV-C irradiation of strawberry plants on phenolic content of fruit: Targeted and non-targeted metabolomic analysis. J. Berry Res. 10(3):365-380. https://www.doi.org/10.3233/JBR-190482
Figure 5. Fusarium wilt commonly travels from field to field on farming equipment, particularly harvesters (A), which retain large amounts of plant debris (B) (photos by C. Swett.)
Fusarium oxysporum f. sp. lycopersici (Fol) race 3 causes Fusarium wilt, a disease currently affecting most tomato-producing counties in California. Fol is divided into groups called races based on the ability to overcome plant resistances. Fol race 3 is the most recent race, which broke resistance to race 2. Fol race 3 was long restricted to the Sutter Basin, but began spreading in the early 2000s and is now present in every county with large-scale tomato production, making this one of the greatest economic threats to the industry.
Growers are seeking solutions for this damaging soil-borne disease. In this article, an issue overview as well as the latest information on Fusarium wilt race 3 spread, control and prevention is provided. The focus is on current research that is shining a light on new prospects for management of Fusarium wilt in tomato.
Key Characteristics
Bright yellow foliage on one or several shoots on an otherwise normal plant are the earliest symptoms, starting as early as 45 days after planting but typically occurring at about 60 days. The one-sided yellowing of a branch or whole plant can help distinguish this disease from other wilt pathogens (e.g. Verticillium) and other causes of chlorotic conditions (e.g. nutrient disorders) (Figure 1A). From time of initial symptoms to harvest, disease symptoms progress from shoot yellowing to branch death which leads to partial or entire canopy collapse (Figure 1B). Fruit in this exposed canopy develop sunburn and may rot. Another important diagnostic feature of Fusarium wilt of tomato is the presence of chocolate-brown vascular discoloration in the plant stem (Figure 1C). Vascular discoloration is also a symptom of Verticillium wilt, which can lead to misdiagnosis. At advanced stages of Fusarium wilt, the general canopy collapse is similar to other tomato diseases such as southern blight, bacterial canker and Fusarium crown rots. Because of the potential for misdiagnosis of Fusarium wilt, even by experienced scouters, it is prudent to submit plant samples to a diagnostics laboratory prior to making management decisions.
Figure 1. Symptoms of Fusarium wilt in tomato plants, shown here as a shoot with bright yellow and dying foliage (also known as “yellow flagging”) on an otherwise healthy plant (A), collapse of the vine (B) and chocolate-brown discoloration inside a stem (C) (photos by K. Paugh.)
Survival and Spread
Fusarium wilt race 3 occurs across the Central Valley from the Sacramento Valley region (Colusa, Sutter, Solano, Yolo and Sacramento) to the central San Joaquin Valley (San Joaquin, Stanislaus, Merced, Fresno and Kings) and, most recently, to the southern end of the San Joaquin Valley (Kern) (Figure 2). The pathogen is thought to move locally from field to field by hitching a ride in the soil and plant debris that cling to farm equipment. Hence, the increased movement of farm equipment across processing tomato regions may have facilitated spread of this disease.
Figure 2. California counties with documented cases of Fusarium wilt race 3, as highlighted in red.
Once present in the field, Fol can persist in dead tissue in the soil. Ongoing studies suggest that this pathogen can persist for at least two years in infested tomato tissue after incorporation. In addition, although Fol can only cause disease in tomatoes, it can infect many different non-tomato crops, including melons, pepper and sunflower, without causing any symptoms and survive in non-tomato crop residue in soil. Thus, Fol can feasibly be introduced into a field that has never had tomato, propagate on these silently-infected crops and cause severe losses in the first year the field is planted to tomato. Of note, there are also many Fusarium wilt diseases of rotation crops (e.g. Fusarium wilt of melon, watermelon and lettuce,) but these Fusarium wilts are all caused by completely different pathogens. Therefore, if you have Fusarium wilt of melon in your field, this does not mean you will get Fusarium wilt in your tomatoes.
Management
Overview of IPM for Fusarium wilt
The most effective tool for Fusarium wilt management is preventing pathogen introduction. If introduced into a field, the disease can usually be successfully managed with resistant cultivars (F3 cultivars), although there are some caveats in F3 efficacy. If F3 cultivars are not available for management, pathogen-tolerant cultivars and early-season chemical management options are also available. Crop rotation can help reduce pathogen pressure and reduce risk that an F3 resistance-breaking race will emerge (race 4).
Effective management of Fusarium wilt requires accurate diagnosis. As noted above, there are many diseases that look like Fusarium wilt, and at present there is no way to differentiate these diseases in the field. Before developing a Fusarium wilt management plan, it is critical to submit samples for analysis by a diagnostic lab. Ideally, growers could have their soils tested for Fusarium wilt prior to planting. Although there are no commercial soil testing services available, there are preliminary soil testing tools under development at UC Davis (contact C. Swett for more information.)
Management with genetic resistance
Fol race 3 resistant cultivars, called F3 cultivars, typically develop no disease and are an excellent management tool. The tomato industry has worked hard to overcome challenges in F3 cultivar quality, yield and seed availability. In addition, certain F2 cultivars are “tolerant” of Fusarium wilt race 3 in that their yield does not appear to be significantly impacted in infested fields. Fusarium wilt tolerance is not a listed trait for existing commercial cultivars, but this information is available through seed dealers.
In some cases, F3 cultivars develop Fusarium wilt due to Fol race 3. This is typically attributed to either the presence of off-types (when incidence is below 2%) or environmental stresses (when incidence is higher.) Abiotic and biotic stresses appear to play a role in influencing stability of resistance, and recent studies have demonstrated that salt stress can compromise F3 resistance, leading to Fusarium wilt development in up to 30% of F3 plants in a field. While the role of various stresses in mediating F3 resistance is not well-characterized, research in this area is ongoing. Management of these stresses can help maintain the efficacy of host resistance against Fol race 3.
Chemical control pre- and post-planting
Fusarium wilt race 3 is notoriously difficult to control once established in soil. Although host resistance is the gold standard for management, F3 cultivars are not always available. Chemical management may function as a short-term alternative. Recent studies have shown promising results for pre-plant fumigation with K-Pam HL (AMVAC Corporation) at 30 gal/A or higher (maximum rate of 60 gal/A) for optimal efficacy (Figure 3, see page 6).
Figure 3. Results for a 2019 small plot trial at the UC Davis Plant Pathology research farm on the efficacy of the drip-applied fumigant, K-Pam HL, against Fusarium wilt of tomato.
Crop rotation
Crop rotation is a common recommendation for management of host-specific pathogens like Fusarium wilt because non-host crops suppress pathogen propagation and survival. However, the efficacy of this method relies on the inability of the pathogen to infect rotation crops. It has been discovered that Fol race 3 can infect many crops without causing symptoms, which may reduce the effectiveness of crop rotation. Several rotation crops were found to be poor hosts and were suppressive to pathogen build up in soils; these include cotton, bean crops (i.e. garbanzo, fava, lima and green bean), grass crops, including wheat and potentially corn and rice (poor hosts, not field tested), and onion (Figure 4, see page 6). These appear to be good crops to grow right after tomato and the year before planting to tomato. Pathogen-enhancing crops should be avoided when possible; these include pepper, melons, pumpkins, and sunflower.
Figure 4. Preliminary results for the effect of rotation crops on development of Fusarium wilt (FW) in tomato. Plots at the UC Davis Plant Pathology research farm were previously planted to a summer or winter rotation crop (or tomato) or left in chemical or unmanaged fallow (=weeds) in summer 2019 (A) or winter 2019-2020 (B), respectively
No free rides for pathogens
The most effective tool for Fusarium wilt management is preventing pathogen introduction. On farms where Fusarium wilt is not present, this is best achieved by only using equipment that remains within the farm. However, as this is not an option for most producers, a second option is to use a sanitation regime for shared equipment. There is limited information on which equipment is the most important to target for sanitation, but Fusarium has been found at high levels on harvesters which retain large amounts of plant debris (Figure 5). An assessment of critical control points on harvesters indicates that areas which only have contact with fruit have lower levels of microbes, whereas the chipper and other areas which come into contact with whole plant material have higher levels. Robust analysis of effective sanitation methods is lacking, but preliminary data indicates some efficacy of current practices such as physical removal of contaminants using scrapers, combined with chemical and steam treatment.
Further management options understudy
Compost amendments are commonly used for soil fertility management, and recent studies at UC Davis suggest that composts may also suppress Fusarium wilt in soil. Pathogen-infested tomato residue decomposes more rapidly in soil with long-term inputs of poultry manure compost. Preliminary studies also indicate that cover crops such as hairy vetch may be suppressive to Fusarium wilt, as has been seen for Fusarium wilt of watermelon, but results are inconsistent.
Where to Go Next
There are no documented cases of Fol race 4 in California. However, given the history of this pathogen, it is almost inevitable that a new race (race 4) will emerge that overcomes race 3 resistance. As a result, race 4 monitoring continues to be a top priority across the state.
F3 resistance can be compromised by stress, and Fol race 3 has been documented causing disease in multiple F3 tomato fields every year. Knowing which types of plant stress affect host resistance would help growers prioritize management strategies. Long-term studies of Fol race 3 survival in soil are important for knowing optimal durations for rotating out of tomato.
There are several common rotation crops whose risk status is still unknown, including safflower, alfalfa, potato and hemp. Furthermore, there is clearly a need for soil testing tools for Fol race 3. The UC Davis Vegetable Pathology program is working to develop more rapid molecular tools for both soil detection and diagnosis in plants. Industry innovations in effective sanitation, such as full room steam or fumigation sanitation stations, could provide a breakthrough in slowing spread of Fusarium wilt as well as other soil-borne pathogens.
While the aforementioned management approaches have primarily focused on Fusarium wilt alone, in reality, Fusarium wilt also occurs as part of disease complexes. Developing strategies that minimize damage wrought by these soil-borne complexes is a critical next step in achieving healthy tomato production in California.
Studies could demonstrate benefits of compost for alfalfa as well as the environment (photo by Marni Katz.)
Joint research by UC Davis and UC Cooperative Extension will look at the impact compost applications on young alfalfa fields can contribute to soil health. Sites will include first year alfalfa fields in San Joaquin and Yolo counties.
Michelle Leinfelder-Miles, Delta crops resource management advisor and Rachel Long, field crop integrated pest management advisor in Yolo, Solano and Sacramento counties, along with UC Davis researchers Kate Scow and Radomir Schmidt were awarded funding for this project from CDFA’s Healthy Soils Program. The project will demonstrate compost application to alfalfa fields to improve soil structure and fertility and use practices designed to reduce greenhouse gas emissions and store carbon.
Although many dairies do spread manure on their alfalfa fields, compost is not typically applied during the course of an alfalfa field’s productive life. Leinfelder-Miles said alfalfa production practices along with heavy clay soils could impair soil physical conditions.
“Physical characteristics of soil can be degraded over time due to high-traffic alfalfa production practices that contribute to soil compaction and poor water infiltration,” Leinfelder-Miles said. Soil health characteristics include fertility, water holding capacity, long term productivity and sustained organic matter content.
This project began with soil sampling at both sites to determine the current status of soil conditions. Compost applications were due to commence this month as the fields were entering winter dormancy. In collaboration with Westside Spreading LLC, the compost applications will be made in the fields. Two treatment rates and a control will be done in each field. Compost will be applied at 3 tons per acre and 6 tons per acre and soil changes will be monitored and compared with the control plots. The compost to be applied is derived from green waste.
According to UCCE’s Alfalfa and Forage News, alfalfa has the ability to take up large amounts of nitrogen and phosphorus from the soil, two components of concern with organic wastes. With more than half million acres of alfalfa grown in California, proving use of green waste compost to improve soil health could open an organic waste management stream and divert green waste from landfills.
Compost will be applied annually in the fall (2020, 2021, 2022), Leinfelder-Miles said. Soil will be sampled ahead of compost application and then a final soil sample in 2023. They will conduct monthly greenhouse gas monitoring. Alfalfa yields over the course of the study will be monitored.
This model shows the robotic pressure chamber under development by UC Merced and UC Riverside researchers (photo courtesy photo courtesy of UC Merced.)
A robotic pressure chamber that can harvest its own leaf samples and test them on site is being developed by UC Merced Computer Science and Engineering Professor Stefano Carpin, Environmental Engineering professor Joshua Viers and UC Riverside professors Konstantinos Karydis and Amit K. Roy-Chowdhury. These instructors received a $1 million grant from the USDA through the National Science Foundation’s National Robotics Initiative.
Having accurate field data that is updated frequently can help growers plan irrigation frequency and conserve water.
‘If we’re going to use precision agriculture, we need the most accurate information gathering systems we can make,” Carpin said.
One current water status measuring technique calls for leaf sample collection and using a pressure chamber. Karydis explained that mix up of samples, different properties of leaves and time elapsed between pulling the samples and testing them can produce inaccurate data that may negate any water savings. In addition, using hand held instruments in the field can be time and labor intensive and require special training to ensure accuracy of the data.
Carpin has worked with researchers at UC Davis and Berkeley to create RAPID the Robot-Assisted Precision Irrigation Delivery system which travels along rows, adjusting irrigation flows according to sensor data that tells the robot precisely what is needed for each plant.
The same base robot as RAPID will be used in this study, but it will be equipped with GPS and a pressure chamber being designed in Riverside and paired with drones that can survey the field and direct the robot to areas of interest.
The project has four phases: development of the chamber, developing machine vision so the robot can ‘see’ the water coming from the leaf stems; coordinating multiple robots in the air and on the ground and evaluation.
Researchers plan to have the first set of automated pressure chamber prototypes fabricated by Spring 2021 and will evaluate their performance and refine designs in controlled settings over Spring and Summer 2021. They expect to have a completed set up by Winter 2022 and begin controlled field testing.
When all of the components have been designed, the designs and code will be open source and all the data collected during the project will be made available to the scientific community.
The project was initiated after Carpin and Viers spoke with growers about the challenges of growing almonds and grapes. Karydis and Roy-Chowdhury also reported similar conversations with citrus and avocado growers in the Riverside area.
“California agriculture presents a challenge in terms of scalability,” Carpin said, “but this is an exciting collaboration because we’ll get to develop a system that will work on different kinds of crops.”
Septoria produces dark, pitted blotches on infected fruit which are much more conspicuous after fruit develop their mature color (photo courtesy USDA.)
New fungicides that provide a new level of efficacy, along with integrated management practices can help California citrus growers deliver high-quality fruit to valuable export markets.
In a Citrus Research Board webinar, UC Riverside plant pathologist Jim Adaskaveg cited pre- and post-harvest diseases that infect citrus fruit when environmental conditions including rainfall favor spread of the fungal pathogens.
“All pre harvest diseases need high rainfall to develop and cause economic damage,” Adaskaveg said. Most post-harvest diseases have their origins in fruit injuries that allow entry of pathogens, he added.
Two citrus fungal diseases that will keep citrus fruit out of the export market are Septoria spot and Phytopthora. Infections of Septoria spot begin with injury to the peel. An ice mark due to a freeze event will leave small irregular pitted, shallow lesion on fruit and an entry point for a pathogen. As the infection advances, the lesions become dark and extend into the albedo- the white part of the peel. The disease does not affect the juice quality, but the appearance of the fruit will limit marketing opportunities. S citri, the pathogen that causes Septoria spot, is a quarantine pest in South Korea, a major market for California citrus. Adaskaveg said the Korean market for citrus is maintained through compliance with quarantine measures, following GAPs and fruit certification in the NAVEK program (a joint UC/citrus industry program).
Phytopthora, is a soilborne disease that can affect tree roots, trunk and the fruit. This complex disease can cause tree decline, root rot, brown rot and yield reduction A pre-harvest infection of brown rot is most likely to be found on fruit growing on the lower one-third of the tree as water splashing from rain or irrigation can spread the pathogen up into the tree.
Orientation of the orchard, tree density and skirting are cultural practices that can help keep infections low pre-harvest. Complementary strategies include pre-harvest fungicide treatments and implementing handling procedures to minimize injury. Planting tolerant rootstocks in areas where Phytopthora infections are common is recommended.
Adaskaveg said new fungicides registered for use in citrus are highly effective in reducing Phytopthora soil populations and root rot as well as improving yields. Two of the new formulations are Orondis and Presidio.
These new fungicide each have a different mode of action and field studies have shown that the active ingredient in these formulations were detected in root, stem and leaf tissues of treated citrus seedlings indicating systemic uptake.
The new fungicides are expected to reduce dependence on fumigation of orchard sites and provide resistance management for sustainable control of Phytopthora.


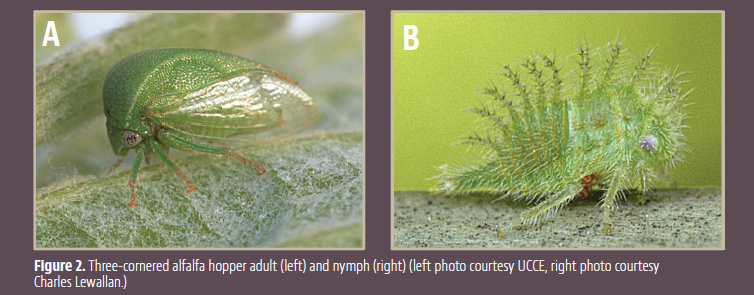
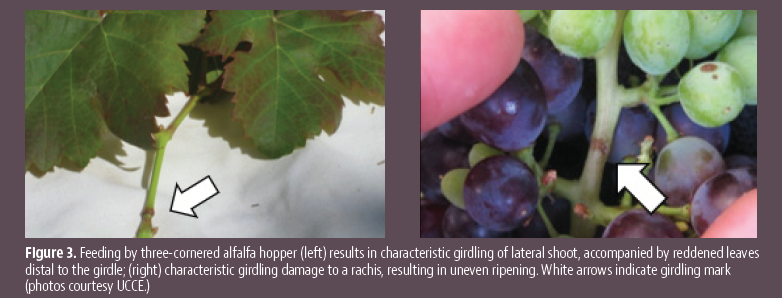


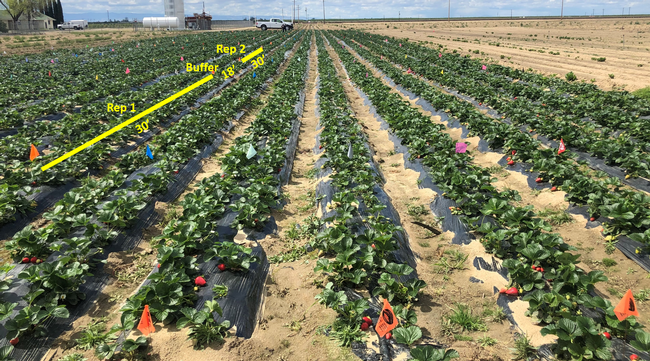
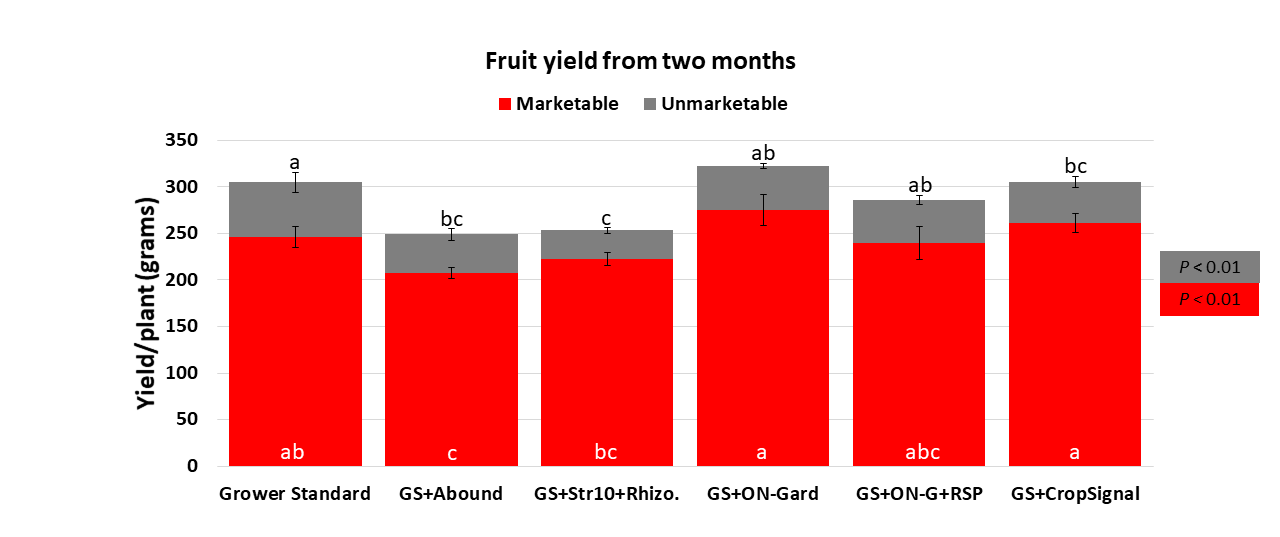

")

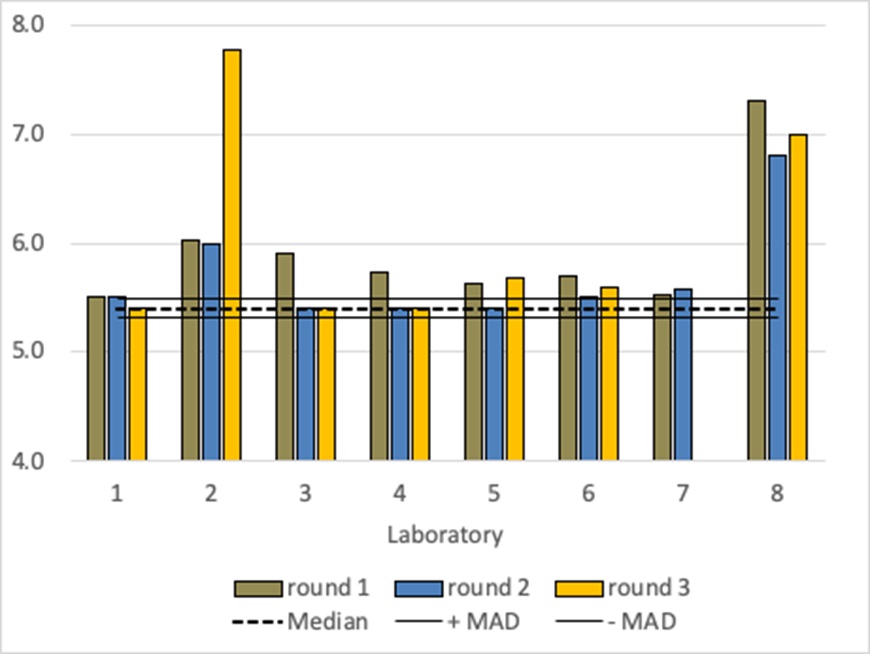
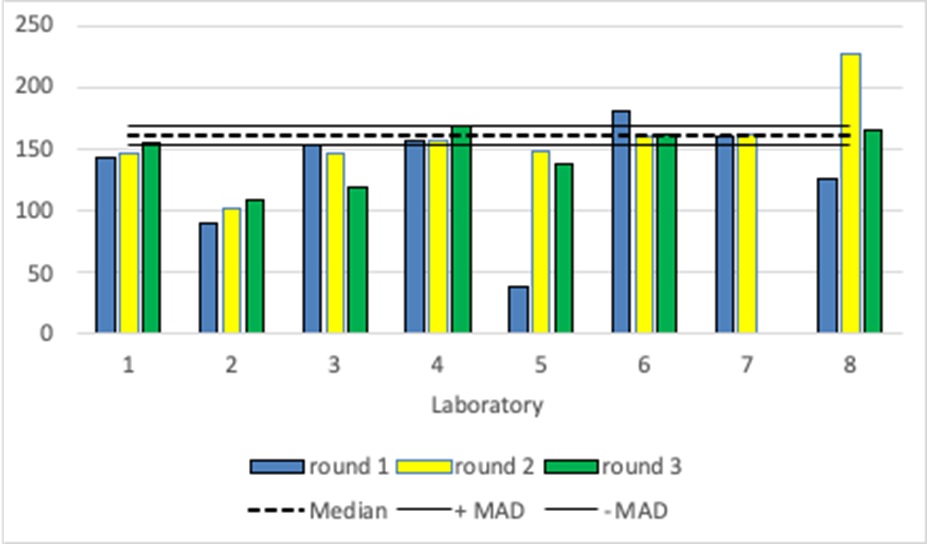
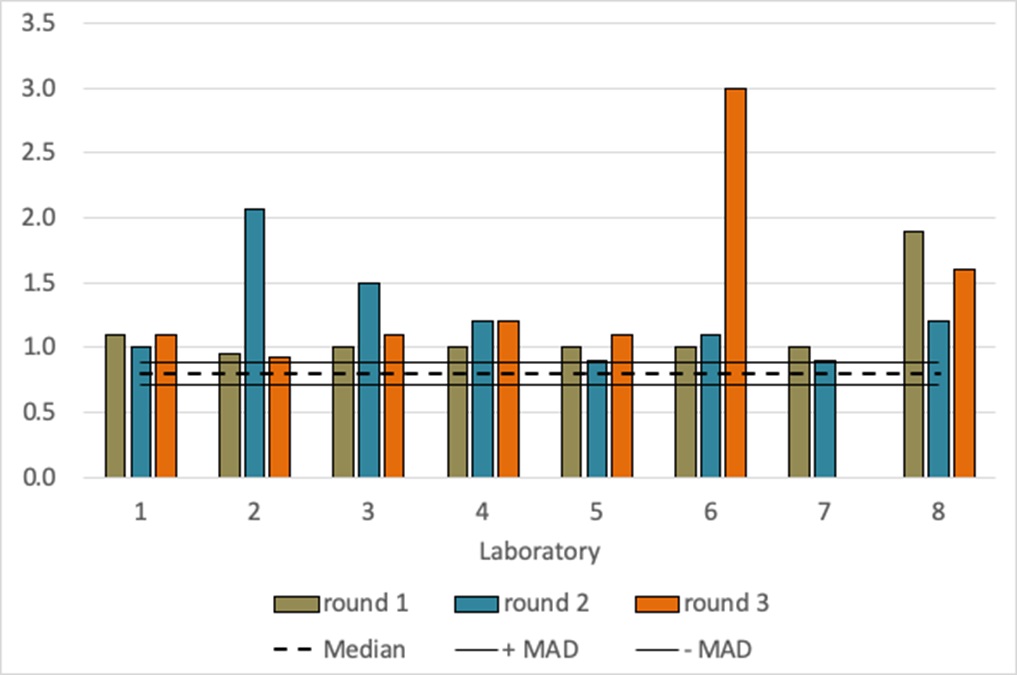


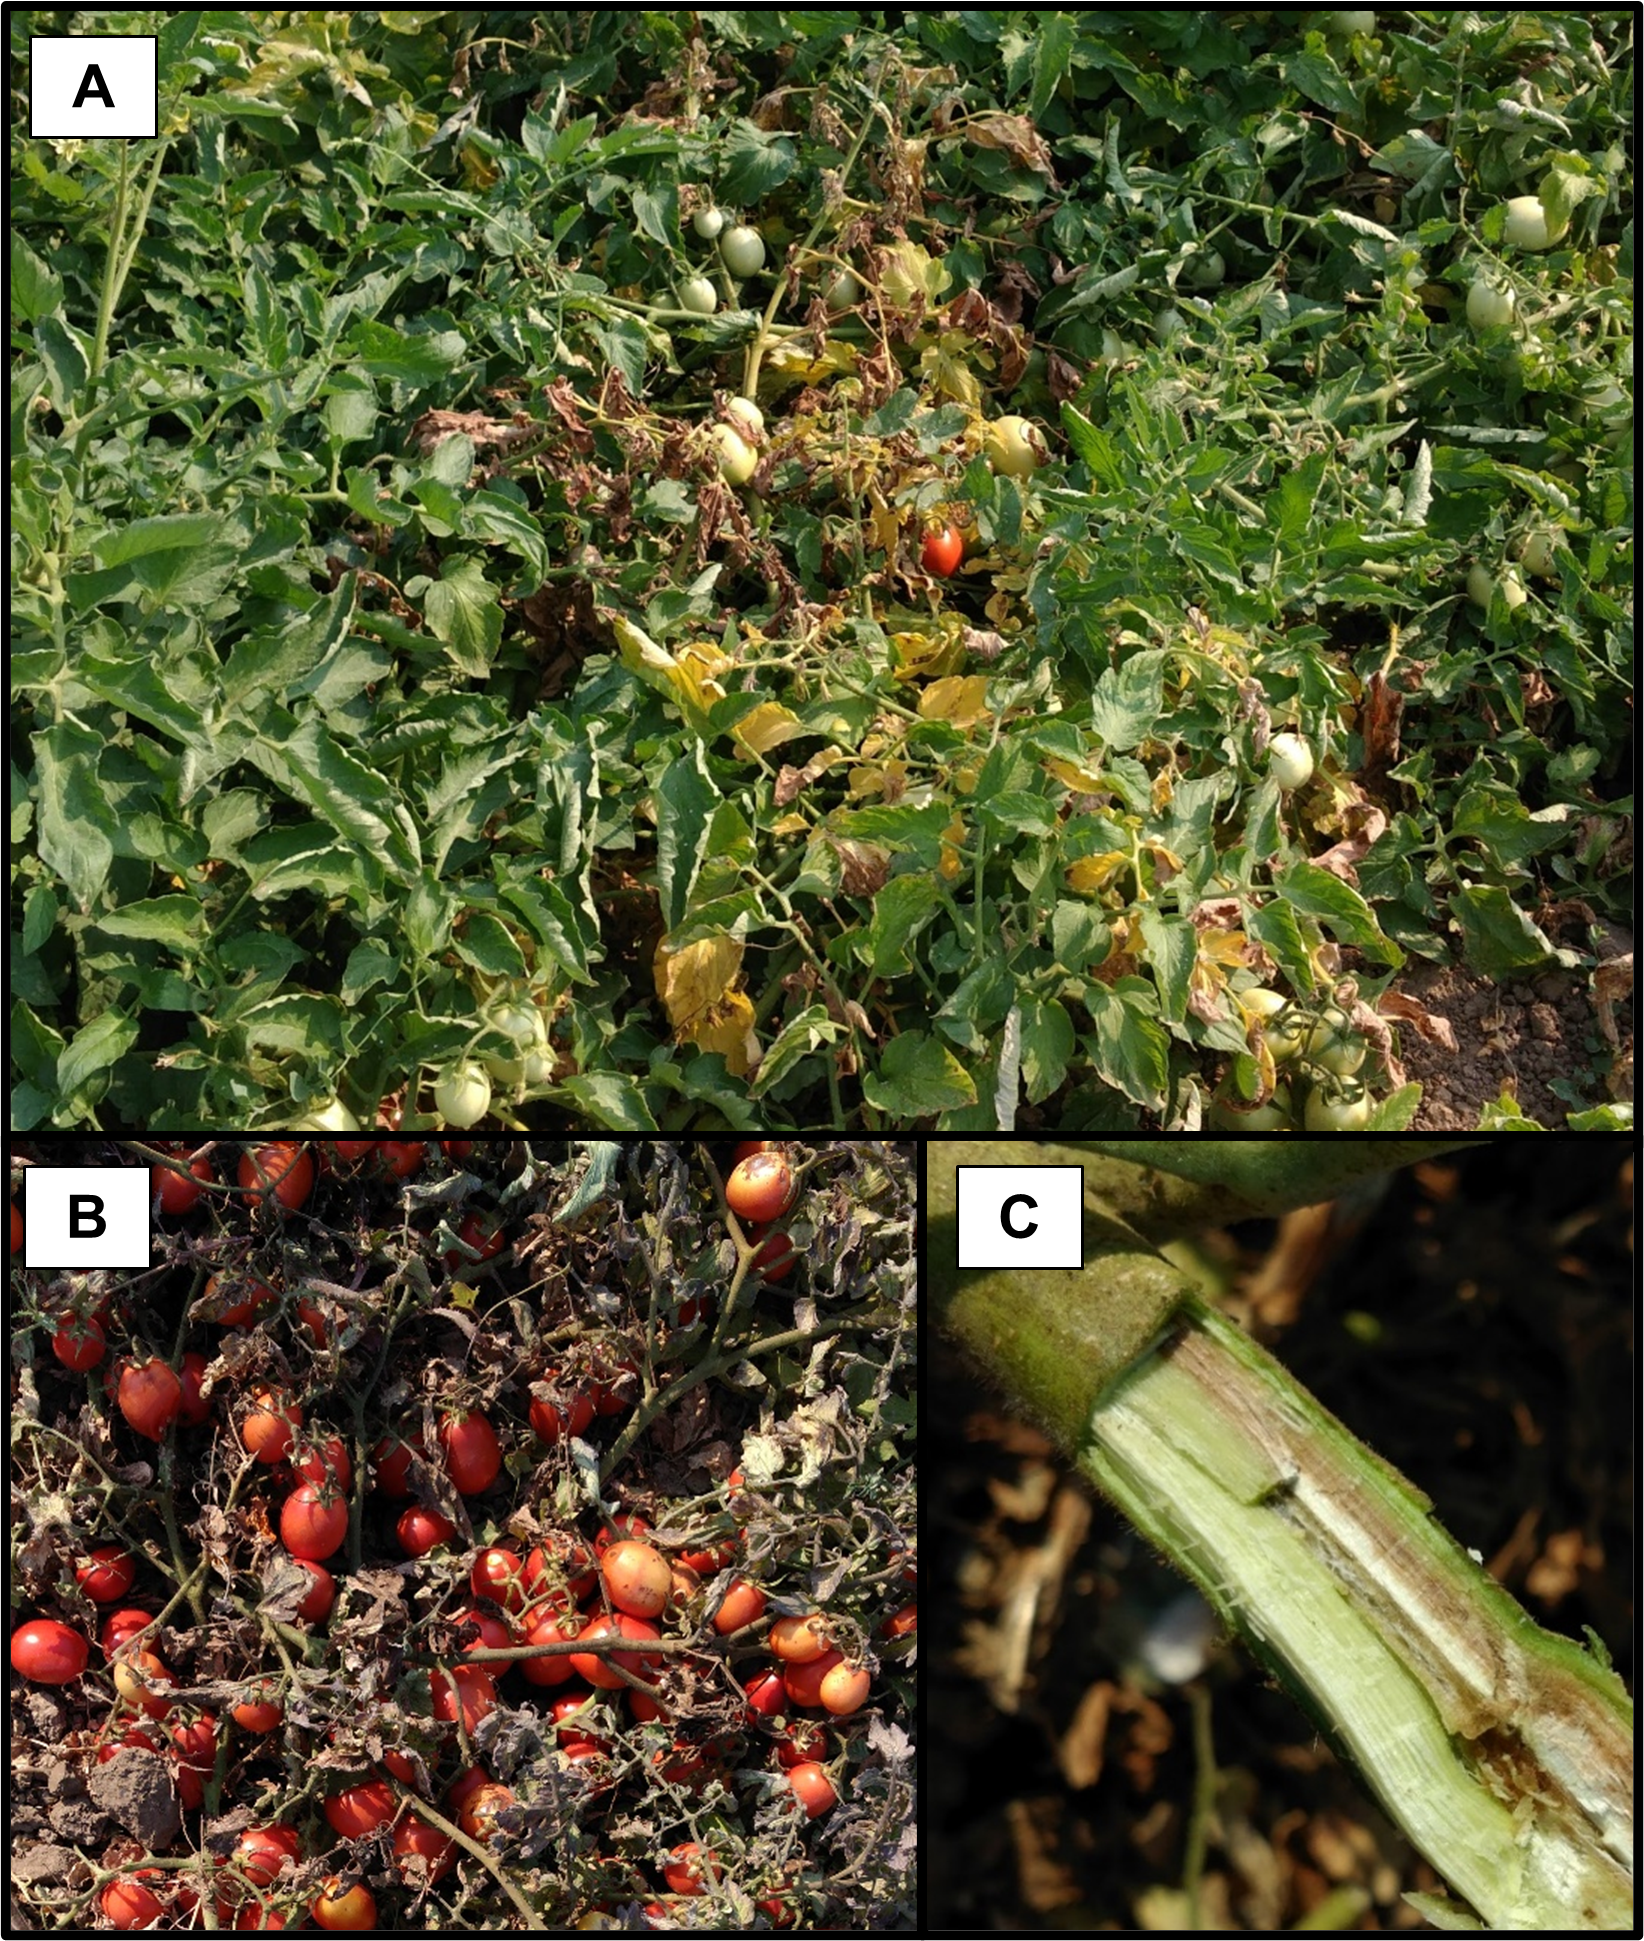
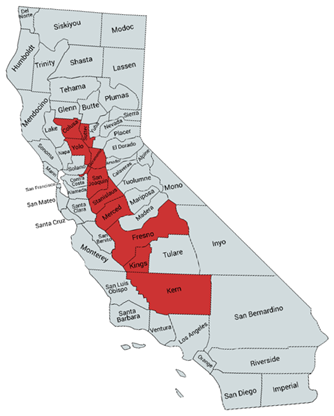
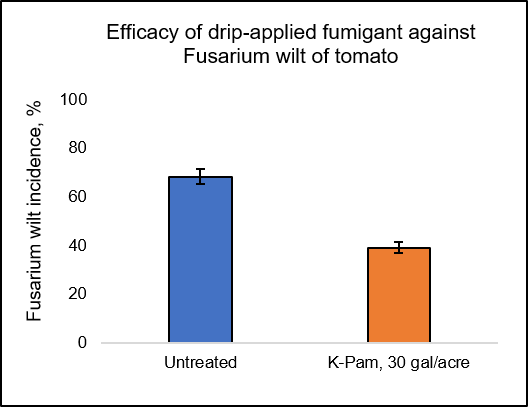
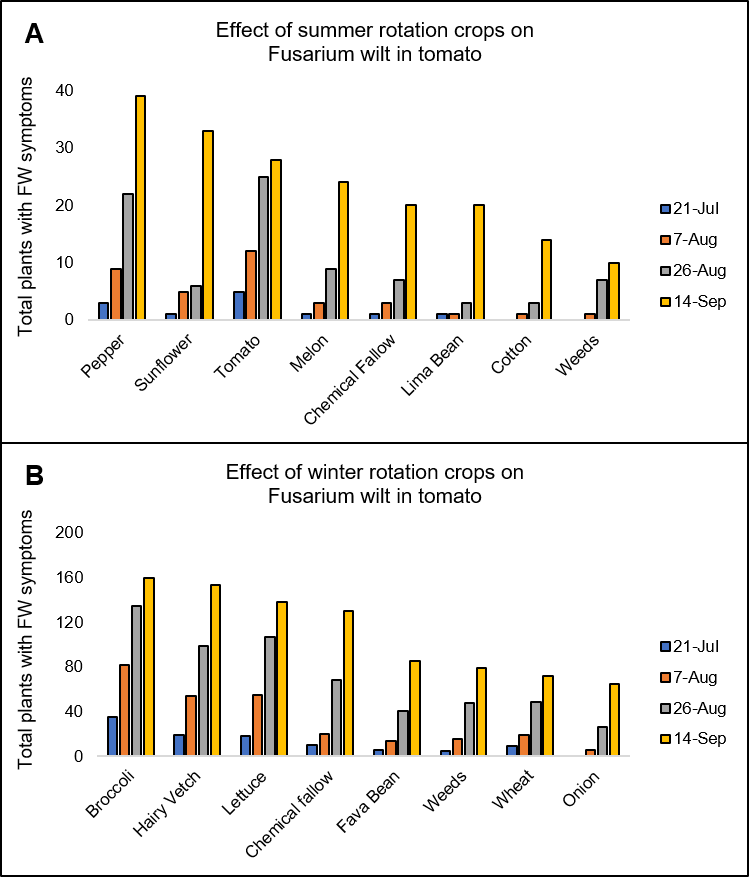


 Invading California")

