Soil chemical analysis is the cornerstone of an effective nutrient management program. Without a reliable soil test, significant miscalculations in fertilizer recommendations can occur, leading to drastic effects on profitability and the environment as a result of under and overfertilization and soil amendment recommendations.
Despite the large number of analytical commercial laboratories serving California agriculture, deciding which laboratory to send a sample to can be a daunting task. Unfortunately, there are no public data reporting the accuracy of the analysis performed by agricultural laboratories, and there isn’t a “true” certification program in the U.S. Although a lab may participate in a proficiency program such as the Agricultural Laboratory Proficiency (ALP) program or the North American Proficiency Testing (NAPT), these programs are not mandatory, nor do they certify lab quality. Therefore, laboratories are chosen based on “word of mouth” and prices, which can vary significantly.
Because of the absence of data, growers, farm managers, consultants, environmentalists and even researchers are left without a reliable means by which to select a testing laboratory. A study was conducted in 2019 to assess the performance of soil testing laboratories.
Accuracy and Precision Assessment
Four reference soil samples from the ALP program were submitted to eight commercial Ag laboratories in the Western U.S. (seven in California and one in Idaho) for typical fertility analyses. In most cases, fertility “package analyses” offered by the laboratories were chosen in order to optimize project funds. The same four reference soil samples were resubmitted two more times totaling three rounds, approximately three months apart each round, in order to assess the precision of each laboratory.

Standard reference soil samples were selected from the ALP program archives, each previously analyzed by a minimum of 30 credible laboratories, in triplicate for each soil sample (totaling 90+ analyses per reference soil.) The median and median absolute deviation (MAD) of these 90+ analyses per reference soil were used to assess the accuracy and precision of the eight laboratories assessed in this study (method based on ALP consensus statistics.) While the accuracy assessment is focused on contrasting each analysis with the ALP medians, the precision assessment is focused on the variability of the analyses across the three rounds (same reference soils analyzed at different times.) Sample IDs were modified and submitted to each laboratory so they wouldn’t be aware of the objectives of the study. Names of laboratories are not disclosed to follow university policy; laboratories are referred as #1 to #8 for discussion purposes.
Each reference soil was analyzed for NO3, P, extractable K, Na, Ca and Mg, SO4-S, electrical conductivity (ECe), Cl, Ca, Mg, Na and B, pH and five micronutrients. Some labs provided additional analyses in their fertility package, such as soil organic matter, estimated and measured CEC and others, however, these were not used in this study since they were not performed by all laboratories. Nineteen analyses performed on four reference soils by eight laboratories three times equals a total of 1,824 analyses, or 228 per laboratory. While that is a rich dataset, trying to create a performance rank for the laboratories across all analysis types is quite challenging since there are multiple types of soil analyses, extraction methods and units. For that reason, performance standards used by the ALP program were applied to this project in order to assess the accuracy and precision of the analysis performed by the laboratories. Eight analyses were chosen for this assessment: Olsen P, extractable K, Ca and Mg, ECe, pH, sodium adsorption ratio (SAR) and DTPA Zn. For the purpose of accuracy assessment, each of these analyses were attributed a pass or failure score, totaling 96 scores per laboratory (8 analysis types, 4 reference soils and 3 rounds). The precision assessment was based on the relative standard deviation of each analysis across the 3 rounds.
Although all labs presented certain inaccuracy and imprecision, some stood out. Laboratories #2 and #8 were consistently inaccurate and imprecise, while laboratories #1 and #7 were the most accurate and precise. Laboratory #8 in particular presented the poorest performance for both accuracy and precision. Laboratories #3, #4, #5 and #6 presented varying accuracy and precision. These patterns of accuracy and precision are illustrated in the three graphs below.
Laboratory Results
Figure 1 illustrates the results for saturated paste pH for soil C. Listed is the pH median and the Median Absolute Deviation (MAD), with results for each lab and each round. Labs #1 and #7 were the most accurate over all rounds. Labs #2 and #8 had high bias, and lab #2 was imprecise (inconsistent). Due to funding limitations, only two rounds of samples were submitted to lab #7.

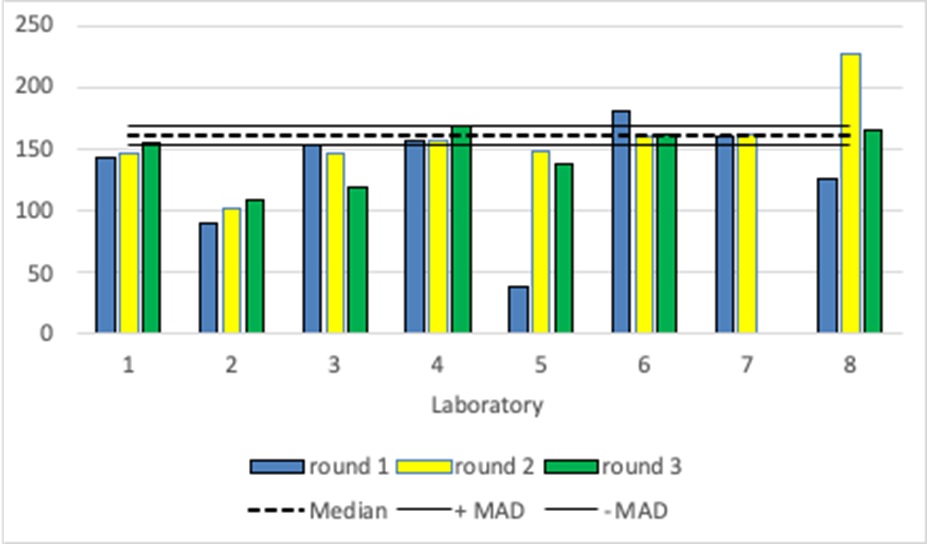
Results for exchangeable potassium analysis by ammonium acetate for soil C (Figure 2) illustrates a common occurrence of accuracy levels observed across most reference soils used in this study. Generally, labs #1 and #7 consistently reported results near the median.
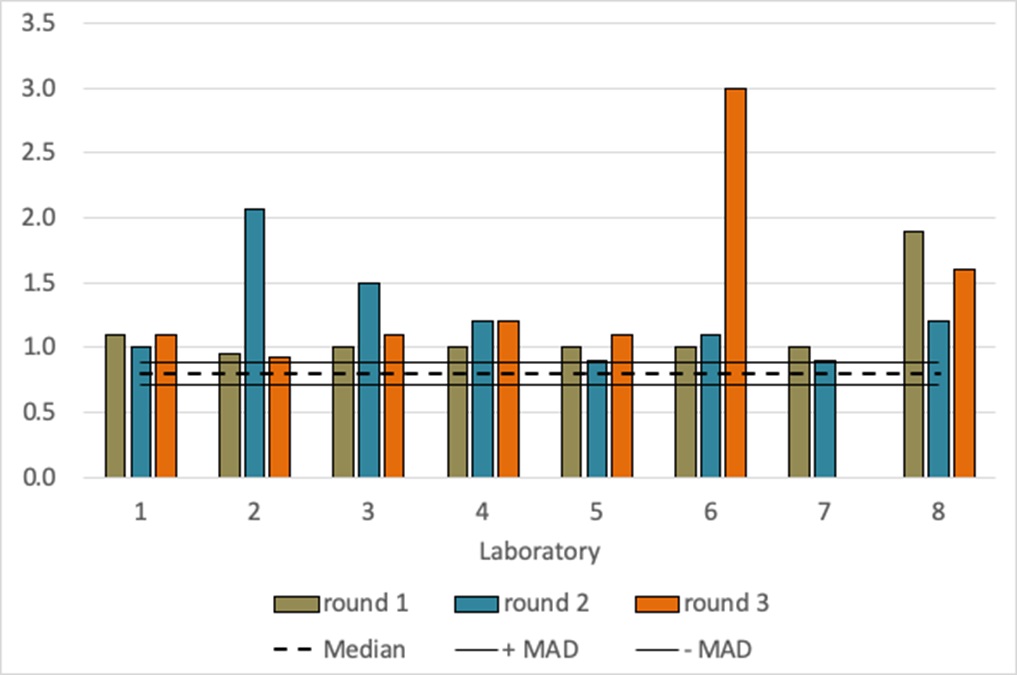
Results for Zn extractable by DTPA for soil A (Figure 3) show a general trend of all eight labs reporting higher Zn values relative to the median for this standard reference soil of 0.9 ppm. Labs #1, #4, #5 and #7 generally reported equivalent Zn concentrations for each round. Labs #2, #3, #6 and #8 were inconsistent across the three rounds. Lab #6 in particular reported values that varied by 300% across the three rounds.
Need for Consistency
Besides the accuracy and precision parameters assessed in this study, it seems like consistency is an overall challenge for the lab industry: consistency of methods used for certain analyses, of how methods and units reported, and of the interpretation of the results (e.g. graphs illustrating sufficiency and deficiency ranges). Although it is the responsibility of the client to verify the methods used and request the most pertinent information for their application, many growers and farm managers are not familiar with the intricacies of soil analyses and nutrient management. Hence, providing an electrical conductivity analysis in 1:1 or 1:2 extraction instead of the standard saturated paste extract (ECe) can lead to misleading conclusions and inappropriate management decisions since the literature for most salinity thresholds for crop yields were defined with the saturated paste extract method. Another observation in regard to the analysis type is about the phosphorus extraction method used for soils with different pH, where some labs used the Olsen extraction method for soils with pH below 6.0, and others utilized the Bray P1 method.
Soil testing lab users in California and in the Western U.S. could benefit tremendously from a certification program designed to certify the accuracy and precision of all labs on a regular basis. Please feel free to contact the lead author directly for more detailed information about this study at (805) 645-1465.
The author wishes to acknowledges the following contributors to this article: Robert Miller, ALP Program Director, former Extension Soil Specialist UC Davis; Dirk Holstege, Director, UC Davis Analytical Laboratory (retired); UCCE Advisor Steve Orlof, Siskiyou County (in memorian); Tim Hartz, UCCE Vegetable Crops Specialist, UC-ANR (retired); Ben Faber, UCCE Advisor, Ventura County; Anthony Luna, UCCE Advisor, Ventura County; and Eryn Wingate, Agronomist, Tri-Tech Ag Products.


