Over 90% of all almond acres farmed in California are using fertigation to deliver crop nutrition. How-ever, the statewide average for nitrogen use efficiency is still around 70%. This value of 70% efficiency means we are essentially wasting around 65 lb of nitrogen per acre per year on a 2,200-lb crop. Additionally, there are negative environmental outcomes associated with these losses in the form of ground-water leaching and emissions.
Why does this demand and supply gap still exist using this more efficient management strategy? Well, we still lack a robust and accurate means for yield prediction, but more fundamentally, we’re fertigating ineffectively.
Looking at the newest UC Davis Cost Studies from 2024, the assumption used is that still, UAN-32 is applied monthly from March through May, then one additional postharvest application. This equates to 25% of the N budget being applied in each of four intervals. Let’s put this in context of another living organism. An average adult human being requires roughly a 2000-calorie daily intake or 14,000 calories per week. We could assume negative consequences would arise if that adult consumed all their weekly caloric needs in four sittings. A tree is no different in that it does not require nutritional support in large amounts at discrete periods of time. They are continuously supporting various physiological activities and have been shown to benefit from continuous fertigation crop nutrition management that more closely aligns supply with incremental demand.
What is Continuous Fertigation?
The management of crop nutrition by continuous fertigation is centered around delivering smaller amounts of fertilizer more frequently using irrigation water as a carrier. This usually takes the form of weekly or even sub-weekly fertigation events depending on irrigation system infrastructure and orchard characteristics. The rates at each interval should also align with the perceived demand. Most discussions on continuous fertigation typically pertain to N management due to characteristics of various forms and potential for loss.
How Continuous Fertigation is Implemented
At the field site
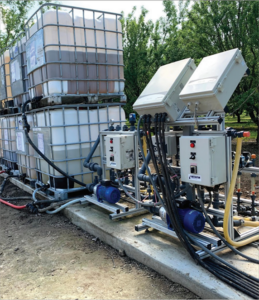
Although any irrigation/fertigation system can be utilized to perform continuous fertigation, a more sophisticated infrastructure that enables scheduling, monitoring and recording of individual events is typically required to mitigate labor constraints that are associated with physically executing applications. Individual events are most efficiently managed by remote scheduling.
There are many competing manufacturers in this irrigation and fertigation service provider space. When choosing the right equipment, don’t be fooled by all the fancy analytics and visuals. What’s most important is that you have the right combination of hardware and software interface for your needs. It should be adapted to your current system configuration, align with your workflow, reduce labor associated with fertigation operations, provide the right sensors and alarms to keep your system operational and be user-friendly to enable the seamless execution of your desired management strategy. In many cases, we see companies that get either the hardware right or the software interface right. There are only a few that get both.
Though this management style is best suited for well water applications due to control of the availability of water for prescheduling irrigation events, those stations operating by surface water delivery can typically plan with their ditch tenders to set block-by-block irrigation schedules accordingly. Once an irrigation event is planned or scheduled, growers can align the injection event with the irrigation based on soil type, soil conditions and the crop nutrition input source. As a general rule, nitrate and urea N sources move equally with water and thus should be positioned closer to the end of the irrigation event than an ammoniacal input source. It is also important to be aware of the soil type and conditions when deciding how long to flush the system after the fertilizer has been injected. The longer the flush, the greater chance of moving N past the rootzone. Injecting a spray indicator dye and observing coloration at various downstream points after an injection event is one way of determining how long your system should be flushed to ensure all materials are out of the system.
If the size of the field being serviced is over 40 ac, you will want to have the capacity to pump at least 100 gph (200 gph if over 100 ac) volume through your pump system to enable short duration fertigation events early in the growing season when transpiration rates are low but N demand is high. Lower rates can be used but impact the duration of input fertigation and may lead to injections that must start earlier than halfway through the irrigation set and potentially lead to greater leaching risks. For storage, one to two liquid tanks are required per station depending on compatibility of prescribed inputs or blends and field size.
As a grower, you need to work with a trusted and knowledgeable advisor who can provide a prescription for the appropriate inputs and rates at each event to match demand, manage chemical incompatibilities, mitigate blend “fall-out” (precipitation of minerals in fertilizer blend over time) and make in-season adaptations when necessary.
Planning
Developing a seasonal plan is paramount to successful execution. As a grower, you’ll need a weekly schedule with specified inputs or blends, per-acre rates and per-set totals because your events will typically be scheduled by irrigation block.
As an advisor, developing a weekly schedule is more than just taking the seasonal N needs and dividing those evenly by the number of applications, then applying a specific product at a specific time. All your agronomy training, especially the 4Rs, is utilized in developing this type of recommendation.
It begins with a keen understanding of the demand curve. The rate of tree N demand is greatest between leaf-out and fruit development (sizing), then slows just a bit through kernel fill and then tapers off more as nuts reach maturity and through to senescence. Weekly rates should mirror this demand curve. The Almond Board of California has a good visual of this in their Nitrogen Best Management Practices handout.
Once you dial in the rates, you need to be aware of the abiotic conditions and physiological events taking place at various points through the season to choose the best input source to fulfill nutrient demand. Soil temperature, for one, is a significant factor. At Yara’s Incubator Farm in Modesto, Calif., we have a sandy loam soil that averaged about 56F between the middle of March and the middle of April. According to the Western Fertilizer Handbook, 2012, full conversion from ammoniacal nitrogen to plant-available nitrate N would be somewhere between six and nine weeks. To accurately match demand, you need to be aware of the time associated with nitrification rates. Just because we apply crop nutrition products to the field site doesn’t mean the plant can always access them. When inputs are not readily available to the plant, an unintended lag between application time and actual plant uptake may occur. In these earlier-season fertigation events, inputs with a higher percentage of nitrate N can ensure plant uptake as this form of nitrogen is fully plant-available regardless of soil temperature.
Why Continuous Fertigation Should Be Implemented
Though it may appear complex at first glance, continuous fertigation is fairly simple to adopt with the right tools and a knowledgeable advisor. It can be a far more prescriptive strategy that requires less guesswork when utilized properly. With regular field visits and tissue sampling efforts, it is easy to make minor adjustments along the way instead of only having basically three opportunities during the development of the crop to get it right.
There are several other key benefits to adopting a continuous fertigation strategy in almond. The first is profitability. There is absolutely a cost to nitrogen use efficiency (NUE). If the nitrogen applied does not generate greater output, then the dollars spent for those units of N are wasted, not to mention they’re environmental fate is likely further degradation of our groundwater resources and a recipe for further regulations.
To address NUE economics, let’s consider a 2200-lb/ac crop example. To save money, you can you cut 50 lbs N/ac and save roughly $30/ac, but you will need to increase from 70% to 90% NUE to maintain yields. However, consider the opportunity costs. If you maintain the same N rates and improve from 70% to 90% NUE, you now have the ability to support another 700 kernel lbs/ac. Now we’re making money instead of just saving.
That’s all just math though; how does this actually perform in real-world conditions?
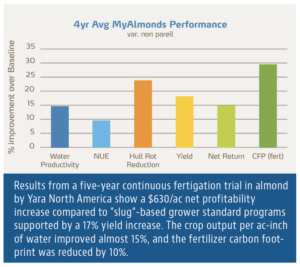
Through good economic years and bad, we have been trialing continuous fertigation combined with higher nitrate N programs for the last five years at the Incubator Farm and externally. Over those five years, we have documented a $630/ac net profitability increase compared to a “slug”-based grower standard program supported by a 17% yield increase. The environmental impact of these programs is also reduced. The crop output per ac-inch of water has improved almost 15%, and the fertilizer carbon footprint has been reduced by 10%.
These results combined support a strong argument for continuous fertigation adoption by highlighting the gains in efficiency of production, resulting in greater productivity, profitability and input resource optimization.

