Soil health is central to sustainable agriculture and a key goal of regenerative and organic farming. Practices like the application of organic amendments, cover cropping, reduced tillage and livestock integration are promoted to improve soil health. Traditionally, sustainability or organic certifications have relied on the adoption of certain practices for monitoring and verification. However, newer regenerative agriculture certifications are introducing requirements for direct monitoring of soil health.
This shift raises important questions: How should soil health be measured and rated? How can these ratings inform management decisions? Should soil health ratings and interpretations be tailored to specific crops and regions?
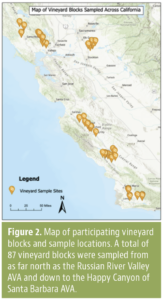
To explore these issues, we conducted a case study analysis of 87 vineyard blocks across California, representing diverse management histories. This study aims to shed light on the link between regenerative agriculture and soil health monitoring in the context of California winegrape production.
How to Measure Soil Health?
Numerous soil health assessment frameworks have been developed globally, each varying in practicality, sensitivity, and interpretability. These frameworks typically include indicators of physical, chemical and biological soil properties. In the U.S., commercial laboratories offer soil health testing packages priced between $55 to $165 per sample. However, the methods and indicators used in these packages vary, making it challenging to compare results across tests.
The Soil Health Institute evaluated 30 soil health indicators across 124 long-term experiments in Northern America and recommended a core suite of practical and affordable measurements: soil organic carbon (SOC), carbon mineralization potential (MinC) and aggregate stability index (ASI). These indicators were chosen for their response to management practices across a wide range of soils, climates and production systems. In our study, we focused on these three indicators due to growing interest among California growers and laboratories in the Soil Health Institute’s recommendations.
Interpreting Soil Health Measurements
When evaluating soil health indicators, it is common to wonder: Is a MinC value of 50 mg CO2-C/kg soil/day good or bad? Last year, my soil had 1.2% SOC, but this year, the lab results showed 1.15%. Does this indicate a significant decline in soil health? What is the maximum aggregate stability achievable in my soil?
Answering these questions requires an understanding of expected soil health indicator ranges, the soil’s inherent potential and typical sampling and analysis errors. To address these complexities, Cornell’s Comprehensive Soil Health Assessment (CASH) developed scoring functions for various soil health indicators using samples from the Mid-Atlantic, Midwest, and Northeast U.S. regions.
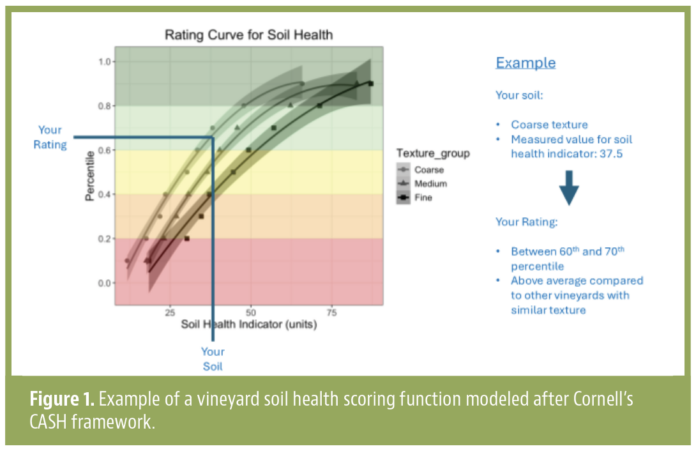
The CASH scoring system assigns scores based on the percentage of samples with equal or lower values. For example, a score of 80% means your result is better than 80% of the reference dataset (Fig. 1). The system also accounts for soil texture, recognizing its role in influencing and sometimes constraining soil health outcomes.
Color ranges on the chart help evaluate whether soil health values differ significantly. Substantial improvements over time can shift soil into better color zones, with dark green zone indicating the soil has likely reached its potential. Though other rating and benchmarking frameworks have been proposed, we based our scoring system for California vineyards on the CASH framework, given its simplicity and clarity.
Rating Curves for California Vineyards
To develop scoring functions for California vineyards, we collaborated with winegrape growers who provided soil samples from vineyard blocks of red varietals. These blocks included those that had adopted cover cropping, compost application and no till or grazing for at least five years as well as blocks where none of these practices had been adopted for at least 10 years. Soil samples were collected from areas next to the vine and at the center of the drive rows. Additionally, growers completed a detailed survey about their practice implementation.
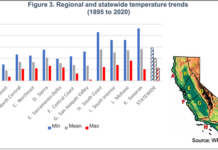
The dataset includes a total of 87 vineyard blocks (Fig. 2), with various combinations of practice adoption, ranging between 0 and 27 years. Thus, the scoring functions represent how soil health values may improve with the adoption of regenerative practices across a broad range of soil types and microclimates (Fig. 3).
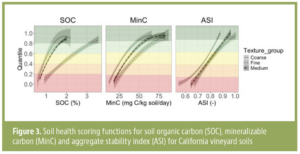
Like other frameworks, our scoring functions account for soil texture. Clayey soils are known to store more carbon and support greater microbial activity compared to sandier soils. Consequently, coarse-textured soils achieve high scores at lower SOC and MinC values than fine-textured soils. For ASI, values trend higher in coarse-textured soils because they are less prone to dispersion when slaked.
Comparing the ranges of SOC, MinC and ASI in our study to those reported in the literature supports the idea that building soil health may face more biophysical limitations in mediterranean regions compared to temperate climate zones. This highlights the importance of developing scoring functions tailored to specific regions and crops.
Monitoring Soil Health for Adaptive Management
For soil health scoring systems to be useful for growers, they must be sensitive to changes in management practices within an operation. To test this, we compiled individualized reports for each participating grower and evaluated whether the scoring system could detect differences in management history among samples from the same grower (Fig. 3).
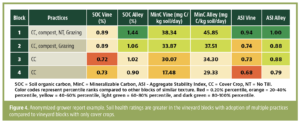
The study involved 12 growers, each providing samples from 2 to 17 vineyard blocks. Overall, the scoring system successfully identified differences between vineyard blocks submitted by the same grower. Growers reported the scores either reinforced their management goals or highlighted areas where soil health management fell short of their targets. These findings demonstrate the soil health assessment framework can effectively support adaptive soil management in vineyards (Fig. 4).
Successful Paths to a Healthy Vineyard Soil
Adopting soil health practices, such as cover cropping, composting, reduced tillage and grazing, involves costs and uncertainties, often with unclear timelines for measurable impacts. We used quantitative comparative analysis to explore conditions leading to soil health scores above 60%, revealing complex causal relationships.
Long-term cover cropping (10+ years) emerged as the most important factor for achieving high soil health scores, especially when combined with another regenerative practice. This benefit extended across the vineyard floor, improving soil health in both alleys and under-vine areas. Notably, the integration of livestock was identified as a key practice for accelerating soil health improvements, yielding measurable benefits even after less than 10 years of cover cropping.
Achieving high ASI and MinC scores appeared to require long-term adoption of more practices compared to high SOC scores. However, our findings suggest tailoring the right combination of practices to specific environmental conditions is more important than simply increasing the number of practices used.
Practical Implications for Vineyard Managers in California
Our study provides proof-of-concept for the use of SOC, MinC and ASI to evaluate vineyard soil health in California, supported by practical soil health scoring functions. This approach can help monitor vineyard soil health and inform adaptive management strategies. Given the variability of soil type and microclimate, growers are encouraged to experiment with different strategies to determine what works best for their conditions. While monitoring can identify effective practices, building soil health is a slow process that often takes over a decade. This underscores the need for long-term commitment, with monitoring intervals every few years being sufficient.
Winegrape growers can use our rating curves as a reference to monitor soil health. For SOC testing, ensure that labs report SOC specifically, rather than total carbon, especially in calcareous soils where high carbonates can skew results. Many labs also offer MinC (soil respiration) testing; our scoring functions are applicable as long as results are expressed in mg CO₂-C kg–¹ soil d–¹, regardless of preparation or incubation duration (one to four days). For ASI, only results obtained using the Soil Health Institute’s SLAKES test are compatible with our scoring functions. Growers can work with labs that use SLAKES or measure ASI in-house via the SLAKES app available at soilhealthinstitute.org/our-work/initiatives/slakes/.
Future Work
The scoring functions in our study are based on data from 87 vineyard blocks and reflect the progression in soil health scores that may occur over time with the implementation of a soil health management strategy. As more data becomes available, these scoring functions could be refined further to address specific soil types or microclimates.
Since the effectiveness of soil health management practices depends on factors like implementation (e.g., cover crop species, compost type, etc.) as well as soil type and environmental conditions, future research should focus on identifying the most effective combinations of practices for specific contexts.
Finally, soil health is rarely a management goal on its own. Future research should quantify the impact of improved soil health on key agronomic and environmental outcomes, including yield, grape quality, pest and disease pressure, pollution from leaching and runoff, biodiversity and climate change adaptation and mitigation.
This project was funded by the CDFA Specialty Crops Block Grant and the Foundation for Food and Agriculture Research. We thank all growers who participated in this study.
References
Hughes, H. M. et al. Towards a farmer-feasible soil health assessment that is globally applicable. Journal of Environmental Management 345, 118582 (2023).
Feeney, C. J. et al. Development of soil health benchmarks for managed and semi-natural landscapes. Science of The Total Environment 886, 163973 (2023).
Bünemann, E. B. Soil quality – A critical review. Soil Biology and Biochemistry 120, 105–125 (2018).
Shi. Recommended Measurements for Scaling Soil Health Assessment. (2024).
Fine, A. K., van Es, H. M. & Schindelbeck, R. R. Statistics, scoring functions, and regional analysis of a comprehensive soil health database. Soil Science Society of America Journal 81, 589–601 (2017).
Moebius-Clune, B. N. et al. Comprehensive Assessment of Soil Health – The Cornell Framework Manual. (2016).
Maharjan, B., Das, S. & Acharya, B. S. Soil Health Gap: A concept to establish a benchmark for soil health management. Global Ecology and Conservation 23, e01116 (2020).
Six, J., Doetterl, S., Laub, M., Müller, C. R. & Van de Broek, M. The six rights of how and when to test for soil C saturation. SOIL 10, 275–279 (2024).
Müller, T. & Höper, H. Soil organic matter turnover as a function of the soil clay content: consequences for model applications. Soil Biology and Biochemistry 36, 877–888 (2004).
Nunes, M. R. et al. SHAPEv1.0 Scoring curves and peer group benchmarks for dynamic soil health indicators. Soil Science Society of America Journal 88, 858–875 (2024).
Fajardo, M., McBratney, Alex. B., Field, D. J. & Minasny, B. Soil slaking assessment using image recognition. Soil and Tillage Research 163, 119–129 (2016).
Slakes: A Free Smartphone App to Measure Aggregate Stability. Soil Health Institute (2024). https://soilhealthinstitute.org/our-work/initiatives/slakes/#overview


