With ever-stricter regulations, growers will need to implement best management practices that lessen water quality impairments to surface and groundwater. Also, implementation of the Sustainable Groundwater Management Act will require growers to use water as efficiently as possible to produce their crops. A well-designed irrigation system that is properly managed and maintained is key to using water efficiently and preventing nutrient and pesticide losses that degrade water quality. State and federal programs, such as the State Water Efficiency and Enhancement Program and NRCS Environmental Quality Incentives Program, can finance equipment that improves the efficiency of irrigation systems.
Previous research in row crops has shown many drip irrigation systems could be better optimized through improved pressure regulation and careful monitoring of applied water using flowmeters. When pressure in drip systems is not accurately regulated and monitored, the application rate will vary during and between irrigation sets. Figure 1 shows the average application rate of a drip system when the main valve of the block is adjusted manually by an irrigator to achieve a desired pressure. The fluctuation in pressure among irrigations causes the drip system to have 33% variation in the application rate during the crop cycle.
This uncertainty in the system application rate limits the ability to accurately schedule how long to irrigate. A drip system that applies 0.12 inches per hour would need 8.3 hours to apply an inch of water. Under higher pressure conditions, the same system may have an application rate of 0.15 inches per hour and would only need to be operated 6.6 hours to apply an equivalent volume of water.
During the past few years, we have been evaluating equipment that can help growers irrigate with drip more precisely. Some of these tests were conducted under controlled conditions and others were done by trialing equipment in commercial fields.
Field Evaluation of Two Types of Pressure-Reducing Valves
Pressure-reducing valves (PRV) are valves that can automatically adjust the cross-sectional area of a passageway through which water flows to maintain a desired pressure downstream. When the downstream pressure rises above a threshold, the valve will automatically reduce the size of the passageway to restrict flow, and when pressure drops below a threshold, the valve will open the passageway to increase flow. PRVs can also be used like a regular valve to turn on and off the flow of water.
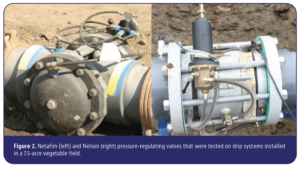
We tested two types of PRVs in drip systems installed in a commercial vegetable field: the Netafim 90 series and the Nelson 800 series valves (Figure 2). Most PRVs use a mechanism similar to the Netafim 90, which has a bonnet with an internal rubber diaphragm that expands and contracts to adjust the flow rate, thereby maintaining a desired downstream pressure. In contrast, the Nelson 800 series uses a flexible rubber sleeve that expands and contracts around an internal cage to regulate flow and achieve a desired downstream pressure. Both models use a pilot with a mechanical spring to adjust the downstream pressure or set point of the regulator. The pipe diameter of both models tested was 6 inches and rated for the range of flow rates expected in the drip system that was installed in a 7.5-acre vegetable field. Both PRV models are available in smaller and larger diameters than 6 inches. Nelson offers a nylon version of the 800 series in the 1000 series model, which is limited to pipe diameters of 4 inches or less. Our objective was to evaluate how well the PRVs maintained the pressure between 8 and 10 psi in the submain with minimal adjustments during an irrigation set.
The Netafim 90 PRV was found to respond slowly to sudden increases in upstream pressure, which sometimes caused drip tape to either detach from the submain or burst under the excessive pressure. Additionally, the pilot on the Netafim 90 had to be adjusted several times during the irrigation set to maintain the pressure in the desired range of 8 to 10 psi.
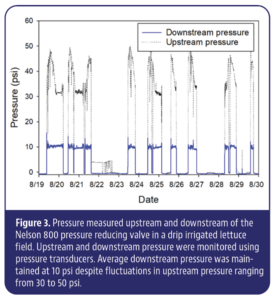
The Nelson 800 PRV was found to adjust faster to increases in upstream pressure compared to the Netafim PRV. Also, the Nelson PRV only occasionally needed to be adjusted during an irrigation set. Figure 3 shows the upstream and downstream pressure of a 6-inch-diameter Nelson 800 PRV for several irrigation dates. Average downstream pressure was maintained at 10 psi despite fluctuations in upstream pressure ranging from 30 to 50 psi.
An important tip an irrigator involved with the field testing learned was at the start of an irrigation, the main valve for the block should be partially opened to allow the drip system to slowly come up to pressure. After the PRV begins regulating the pressure of the drip system, the block valve can be fully opened.
Accuracy of Flowmeters
Flowmeters are quite useful for scheduling irrigations and diagnosing problems that may occur in an irrigation system. Flow rates greater or less than normal may indicate leaks, plugging of emitters or sprinkler nozzles, or if the system is operating at too high or low of a pressure. Scheduling irrigations based on estimates of crop evapotranspiration requires converting between inches of water depth to gallons of water. Gallons of water applied can be converted to inches using the equation:
Inches of water applied = Total gallons of water applied ÷ [27,154 × acres of irrigation block]
Also, the time needed to apply a desired depth of water can be determined from flow rate:
Irrigation set time (minutes) = [depth of water (inches) × 27,154 × acres of irrigation block] ÷ flow rate (gal/min)
The accuracy and reliability of several models of flowmeters suitable for measuring the volume of water applied to an irrigation block were evaluated. The models included Seametric AG3000, Netafim Octave, Seametric AG90, Bermad M10 and the Netafim WST (Fig. 4). Except for the Netafim WST, all models have no moving parts, and most minimize turbulence so that the required length of straight pipe before and after the meter ranges from two to five pipe diameters. The AG3000, AG90 and M10 use magnetic sensors to measure flow rate. The Octave monitors flow using an ultrasonic sensor. The Netafim WST uses an impeller to measure flow which causes minimal loss of pressure across the meter. All models have digital registers and have an output cable that can interface with dataloggers so flowrate can be monitored remotely. Two AG3000 meters were included in the testing to evaluate if they provide similar measurements of flow.
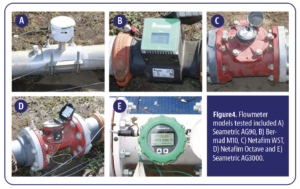
The accuracy of the various flowmeters was evaluated by assembling each model in series along a 6-inch-diameter main line separated by at least 3 feet of straight pipe. The average flow rate evaluated was ~330 gallons per minute, and each evaluation lasted about half an hour. Approximately 10,000 gallons of water were pumped through the main line, and the total volume recorded by each meter was noted at the end of the irrigation set. The evaluation process was repeated five times so the average and standard deviation of the total volumes could be calculated for each flowmeter model. Because the volume of water pumped through the meters was large and could not be physically measured, values recorded from each meter were compared relative to the mean volume of the group of meters tested.
Results of Flowmeter Testing
Most flowmeters had less than ±1.5% difference from the mean volume calculated for the group of meters, demonstrating they had similar estimates of flow (Table 1). The Netafim Ultrasonic and Seametric AG3000 meters were the closest to the mean volume. The Netafim WST, which has an impeller, was consistently less than the mean volume. The Seametric AG90, which inserts into an irrigation pipe, provided the next lowest estimates of flow volume, and the Bermad M10 gave the highest estimate of flow volume, averaging 1.7% higher than the mean volume. Note the two AG3000 meters measured very similar volumes.

The accuracy and reliability of several flowmeters and PRVs were evaluated through field testing. These tests were done on a limited number of models, and other options are likely available that have equal or better accuracy and reliability than the equipment tested in this study. Nevertheless, these evaluations identified several models of flowmeters and PRVs that appeared to be accurate and reliable and could potentially greatly improve the operation of drip irrigation systems installed in row crops.
This project was supported by the California Leafy Green Research Board.


