


Intensified drought in California has limited groundwater supply for crop production. Therefore, vegetable growers need to implement more efficient and crop-oriented irrigation management. Leveraging online decision-support tools can help growers with real-time, effective monitoring of their irrigation and provide updated irrigation recommendations across the crop cycle. CropManage (CM), developed and operated by UCCE, is a weather-based online decision-support tool that provides recommendations for efficient and sustainable irrigation and fertilization applications. CM combines a wide variety of data inputs including past and future weather, evapotranspiration (ET), satellite imagery, soil physical and chemical properties, irrigation system efficiency and other related variables to generate accurate and timely irrigation and fertilization recommendations based on crop-specific models. Growers can compare their actual irrigation amount and timing to the recommendations made by CM and make the proper adjustment to their crops.
Since 2011, CM has been used by growers, farm advisors and research scientists. CM (https://cropmanage.ucanr.edu/) is a credible, free-access, long-term tool for irrigation scheduling and has been adapted for a variety of vegetable crops (carrots, cabbage, broccoli, lettuce, spinach, etc.), berry crops (raspberry and strawberry), tree nut crops (almond, walnut and pistachio) and agronomic crops (alfalfa and corn). Most of the currently adopted vegetables, however, are mainly produced in the Central Coast, so we have been experimenting with Solanaceous and Cucurbits (processing tomato and watermelon) that dominate the Central Valley to examine the feasibility of adapting CM into these warm-season vegetables.

What Did We Do?
Since 2021, we have conducted numerous trials in the northern San Joaquin Valley to compare growers’ irrigation scheduling with the recommendations made by CM to determine if CM is potentially adaptable to processing tomato and watermelon irrigation management.
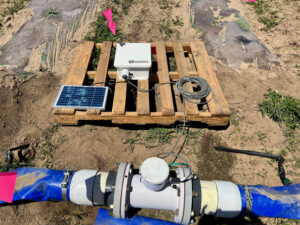
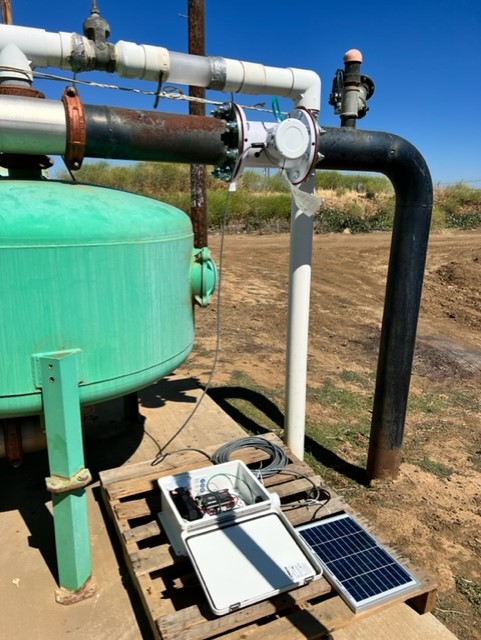
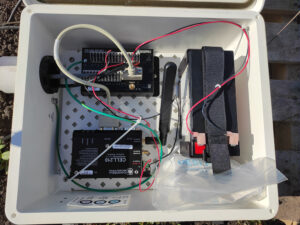
Each field trial began with taking pre-plant soil samples and then was followed by setting up the flow meter, moisture sensors and communication devices to access real-time irrigation information remotely. The location where a flow meter is set highly depends on the setup of the field irrigation system. For processing tomato trials, the flow meter is usually connected to the main pump to monitor the whole field irrigation because all irrigation lines and sub-lines are underground, whereas the flow meter is typically connected to a main line in the watermelon trials to monitor the downstream acreage (Figures 1 and 2). The communication devices include a datalogger that saves the information of each irrigation event (duration, flow rate and total volume) and a cellular modem that transfers the data collected by the datalogger to CM (Figure 3).
As an ET-based irrigation tool, CM provides irrigation recommendations based on the following equations:
Equation 1: Total ETcrop = Avg. ETref × Avg. Kcrop × days since last irrigation
Equation 2: Recommended irrigation amount = Total ETcrop × 100 ÷ (IDU × (1 – leaching requirement)) – total precipitation
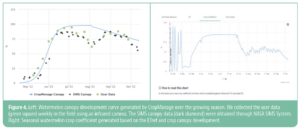
In Equation 1, Total ETcrop is the actual evapotranspiration of processing tomato or watermelon in our cases; ETref is the reference ET near the field, which is accessed through the California Irrigation Management Information System (CIMIS), and Kcrop is the crop coefficient for processing tomato or watermelon, which directly relates to the crop canopy development over the crop cycle. By taking the in-field measurement of percent canopy coverage or accessing the coverage data through NASA’s Satellite Irrigation Management Support (SIMS), CM will provide daily crop coefficients (Figure 4).
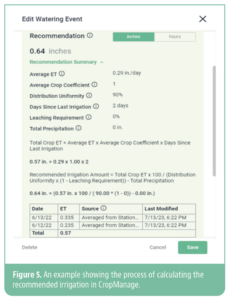
In Equation 2, IDU stands for irrigation distribution uniformity, which is typically between 85% to 95% for subsurface drip irrigation for processing tomato and watermelon production. If using sprinkler or furrow irrigation, the IDU could be less than 75%. Leaching requirement is the fraction of applied water, including rainfall, that drains below the root zone. Growers can set the leaching requirement to zero when subsurface drip irrigation is used to ease the process of calculating irrigation recommendation. Typically, as no precipitation occurs during the growth of most warm-season vegetables in the Central Valley, Equation 2 can be simplified to Equation 3. Figure 5 shows an example of how much irrigation is recommended by CM. Growers can then adjust the actual irrigation amount based on the CM recommendation (Figure 6).
Equation 3: Recommended irrigation amount = Total ETcrop ÷ IDU (expressed as %)
Adaptability in Processing Tomatoes and Watermelons.
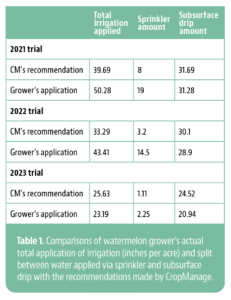
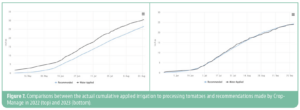
For watermelon, the total amount of water applied was dramatically different among years (2021-23). The biggest difference was contributed by the amount of sprinkler irrigation for transplant establishment. Due to drought conditions in 2021 and 2022, 19 and 14.5 inches of sprinkler irrigation, respectively, were made to transplants prior to shifting to the subsurface drip, whereas only 2 inches of sprinkler irrigation was applied in 2023 (Table 1). Because our flow meter only connected to the lines of the drip system, the information of total amount and schedule of sprinkler irrigation was provided by growers. In Table 1, if we only focus on the CM recommendations for subsurface drip system, it is clear the recommended total amounts were close to the grower’s actual applications in all years. For processing tomato, growers took a well adoption of CM irrigation recommendations with differences of less than 4 inches per acre in 2022 and only 0.3 inches per acre in 2023 between the actual total application and CM recommendations (Figure 7).
FAQs from Users
Attending CM training workshops is another way to get familiar with this decision-support tool. Each year, we host over 10 in-person workshops statewide as well as virtual trainings. Below are the most frequently asked questions from the workshop attendees and grower-collaborators.
What information do we need to enter in CM when setting up the monitored field?
To get more accurate recommendations, we ask users to put in detailed information about the commodity (crop type, acres of the monitored area, coordinates of the field and planting and harvest dates), irrigation settings (water source, nitrogen concentration in the water, irrigation application rate [typically expressed as inches/hour] and distribution uniformity), soil type (autopopulate with entering the field coordinates) and crop settings (previous crop, crop total nitrogen uptake and water stress setting for crops requiring water reduction or cutoff).
If I don’t have the communication devices, can I still use CM to manage my irrigation application?
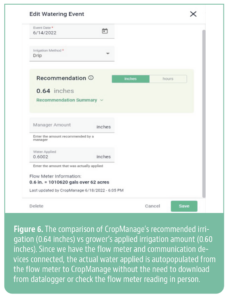
Yes. As shown in Figure 6, with the flow meter connecting with communication devices, the actual water applied is autopopulated from the flow meter to CM without the need to download from datalogger or check the flow meter reading in person. Without these devices, you can still have your irrigator keep the irrigation duration and enter the hours of irrigation to CM manually. Then, CM will transfer hours of application to inches applied based on the irrigation settings entered earlier.
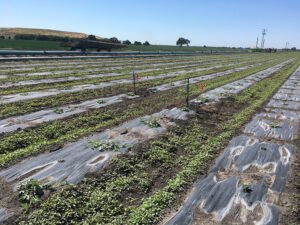
I don’t have time to measure the crop canopy coverage. Can I only rely on NASA’s measurements?
Yes, but you need to make sure the field is clean from weeds, especially in the furrows (Figure 8). The percent canopy coverage generated by NASA’s satellite imagery system cannot separate weeded areas from the true coverage of cash crop.
I have many fields to manage. Can I assign other farm crew for the fields that rely on CM for irrigation?
Yes. In the Ranch Settings, you can assign as many ranch members as you like and give them different levels of access permissions (e.g., view only vs permission to edit settings).
Can I export the field settings and irrigation information?
Yes. If you have full permission, you can export your field settings and cumulative irrigation charts, which can be viewed as an Excel or PDF file.
What are some resources that can help with my use of CM?
CropManage has a knowledge base including tutorial guidance and more FAQs (help.cropmanage.ucanr.edu/tutorials/). Also, keep an eye on the Veg Views Newsletter for future CropManage hands-on trainings (cestanislaus.ucanr.edu/news_102/Veg_Views/).
If I begin using CM in my field, will you help us co-manage the irrigation?
Yes. If you need, I will be working with growers to set up CM and deliver recommendations. We will work together to make sure CM provides timely and accurate irrigation recommendations, which will serve as an important reference for your irrigation decisions.


 Invading California")

