
newsletter
Olive Fruit Fly Pressure Continues Across California
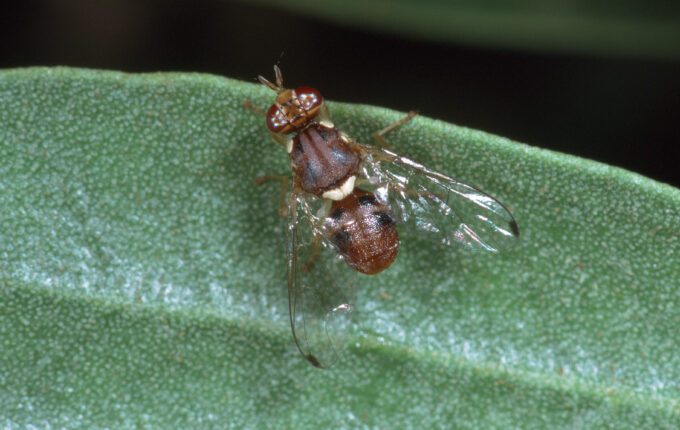
Olive fruit fly (OFF) pressure remains high in California’s olive oil and table olive production, with growers facing…
Read ArticleArticle Archive
Olive fruit fly (OFF) pressure remains high in California’s olive oil and table olive production, with growers facing…
Read ArticleSt. Helena, CA — July 1, 2026 — VineView marks its silver anniversary as the partner of choice…
Read Article
California’s pesticide use reporting system offers one of the most comprehensive looks at agricultural pesticide use in the…
Read Article
There is a new cover crop tool available for growers, technical assistance providers, crop advisors and other users…
Read Article
One of my favorite activities to do with my kids is going to the movies. They’re at a…
Read Article
When a fertilizer label lists nitrogen, phosphorus or potassium, growers know those numbers mean something. They’re backed by…
Read Article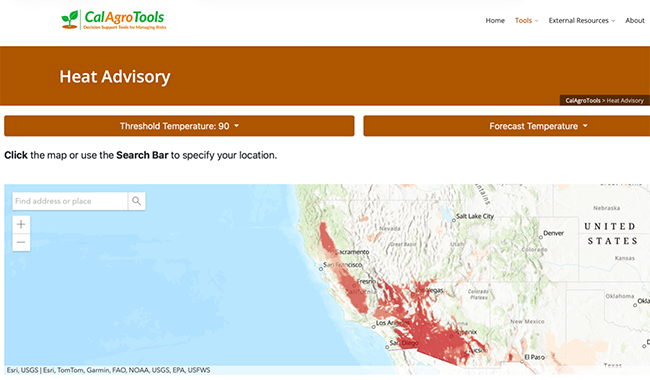
Abstract Weather and climate variability has direct influence on agricultural production systems. While weather data are typically freely…
Read Article
Rising fertilizer prices and increasing regulatory pressure push growers throughout California to consider decreasing mineral N use. Many…
Read Article
Background 4R nutrient stewardship (right rate, time, source and placement) is central to nitrogen (N) management, but how…
Read Article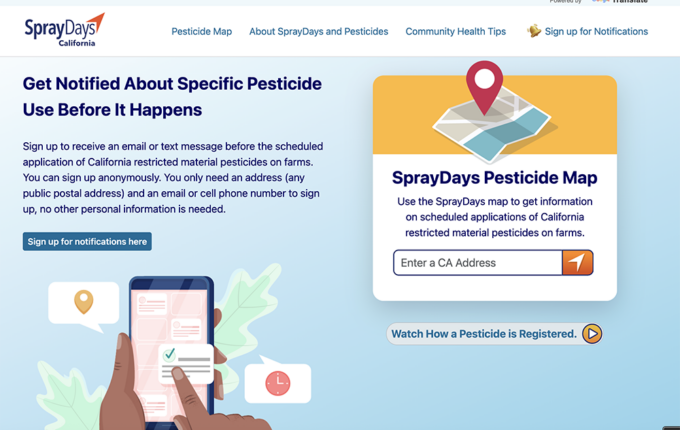
Over the past several months, I have been paying close attention to the growing conversation surrounding paraquat in…
Read Article