
Over the last year, a team from UCCE has been working with California small grains growers on practices that can improve nitrogen (N) use efficiency. At demonstration sites, we have implemented practices that UC Grain Cropping Systems Specialist Mark Lundy has been investigating for several years, namely N-rich reference zones, a soil nitrate quick test, handheld reflectance devices and aerial imagery. We demonstrate how to use these tools to manage N fertilizers in small grain crops across variable soil and climatic conditions in the Sacramento Valley, Delta, San Joaquin Valley and Intermountain Region.
The demonstrations are funded by the CDFA Fertilizer Research and Education Program and a USDA-NRCS California Conservation Innovation Grant. Our goal is to help growers and consultants learn and implement these practices to guide N fertilization in small grains, thereby increasing crop productivity and N use efficiency while reducing potential for N loss to the environment.
What are “N-Rich Reference Zones”?
Reference zones are most useful to growers who can apply the majority of their seasonal N budget during or after the tillering stage of growth. Previous work has shown that N fertilizer applied during the season−between the tillering and heading stages of small grain development−results in higher yields, higher protein and increased fertilizer use efficiency compared to pre-plant applications. The reference zone is a relatively small area within the field where extra N fertilizer is added at the beginning of the season. This extra fertilizer ensures that the reference zone will not be N-limited from planting until an in-season fertilizer decision is made. When a grower is determining whether and how much N fertilizer to add in-season, measurements from both the reference zone and the broader field are compared to understand whether the broader field is sufficient in plant-available N.
Fertilizer N Rate and Field Variability
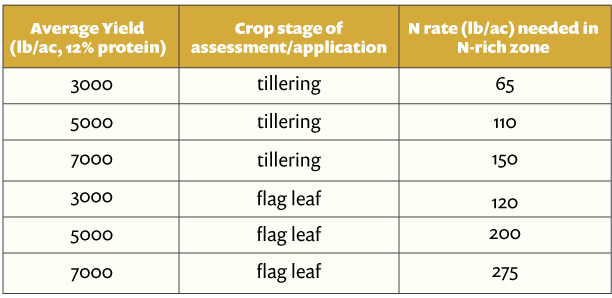
Fertilizer N rate and field variability are two important considerations when creating N-rich reference zones. The amount of N to apply in the N-rich zone will depend on several factors such as yield goal, protein goal and when the expected in-season fertilizer application will take place. There should be sufficient N applied to the reference zone at planting to ensure that the plants in the zone are not limited by N at the stages of growth when the in-season fertilizer is applied. Table 1 gives some examples of how much N fertilizer to apply to the N-rich zone for a range of potential yields.
It is important to establish the N-rich zones in representative parts of the field. Areas of the field that are unique (i.e. low areas, high areas, gravel strips, etc.) should be avoided. It is also important that the zones capture field variability. If certain areas have distinct soil types or known patterns of yield or management differences, a grower should establish multiple zones to account for these sources of spatial variability if they represent large areas in the field. Soil maps (available from casoilresource.lawr.ucdavis.edu/soilweb-apps/) and historical aerial imagery can often help in identifying field patterns and good location(s) for reference zones.
How and When to Apply the N-Rich Zone Fertilizer
A grower can establish N-rich zones during the pre-plant fertilizer application. For example, a grower may apply 50 pounds N per acre across the field and then make another pass or two in the zone to apply an additional 50 to 100 pounds N per acre (depending on what the grower calculates is necessary, as described above.) This method might be most easily adopted by growers. We have observed, however, that if the fertilizer is placed too deep in the soil profile, the N may not be readily available to the seedling crop early in the season because it is below the root zone. Therefore, N-rich zones established by this method may not provide a reliable early-season point of comparison. Instead, we have found that broadcasting urea is the most effective way to establish N-rich zones. At our demonstration sites, we broadcasted urea after tillage or shortly after planting, but always ahead of a storm or irrigation event that could incorporate the fertilizer. Orienting the zones perpendicular to the rows or tractor passes also helps to capture field variability. When the zones are too narrow and run in the same direction as the field work, it can be hard to differentiate between a field pattern associated with equipment passes and a N effect, particularly early in the season.
Monitoring the Field
Once the crop begins to grow, the field should be monitored periodically to assess whether the crop is likely to respond to a N fertilizer application. A combination of the soil nitrate quick test (SNQT) and plant reflectance measurements taken from both the N-rich zones and the broader field can indicate when a top-dress fertilizer application may be beneficial. The soil nitrate quick test and plant reflectance measurements complement other important information like current crop growth stage, crop yield and protein goals, and local weather records to inform a site-specific N fertilizer recommendation.
The SNQT is a simple and low-cost test that provides a ballpark estimate of the soil nitrate-N concentration in the root zone. Nitrate is a highly plant-available form of N. Using the SNQT when N fertilizer decisions are being made will help to narrow a range of fertilizer rates appropriate for that field. More information on using the SNQT in small grains, including a sample protocol and demonstration video, is available at smallgrains.ucanr.edu/Nutrient_Management/snqt/. Over the past several years, UCCE agronomists have developed a strong relationship between the value measured using the SNQT and an estimate of fertilizer N equivalence.
Crop reflectance can be measured using a number of tools, including handheld devices, drones and satellite imagery. Common indices that result from measurements of canopy reflectance are normalized difference vegetation index (NDVI) and normalized difference red edge index (NDRE). These indices represent measurements of light reflected from the crop canopy at key wavelengths indicative of plant vigor. Relative differences in vigor among plants in the same field can be captured by comparing canopy reflectance measurements like NDVI and NDRE. We have been using handheld devices, drones and satellite imagery at our demonstration sites to compare crop reflectance values in the N-rich zones and the broader field.
One of the tools we are using is the GreenSeeker by Trimble Agriculture. This is a hand-held NDVI meter (See Figure 1) that emits light and detects how much is reflected from the crop canopy in the red and infrared wavelengths. The GreenSeeker’s canopy measurement indicates how well the plants are growing and covering the soil with greenness. This information about vigor is important early in the crop’s growth because it indicates the ability of plants to support grain production and yield potential.
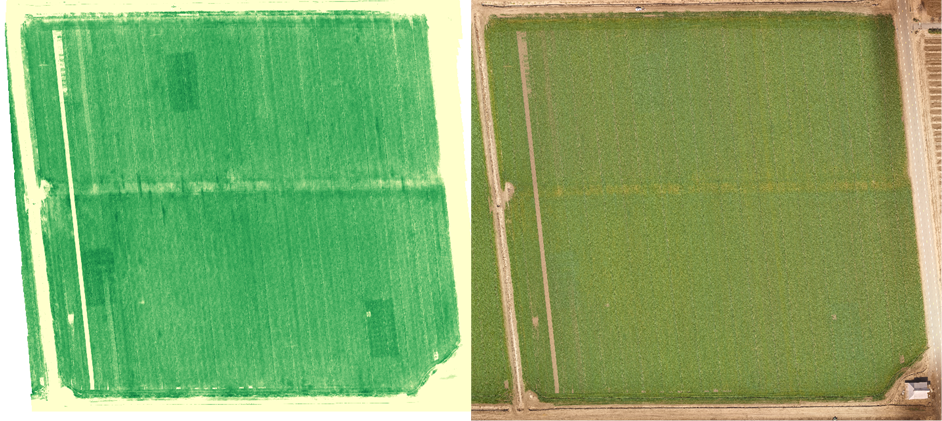
We are obtaining similar information as from the GreenSeeker by measuring NDRE with a five-band multispectral camera (MicaSense RedEdge-MX) mounted on a drone (DJI Matrice M200 V2). NDRE is similar to NDVI but replaces the reflectance from the red wavelength with reflectance from the red edge wavelength. Because the drone is able to capture data from hundreds of feet above the ground, it allows us to measure a large area quickly and under conditions when entering the field is not possible. Figure 2 depicts side-by-side images from a field in Solano County where N-rich reference zones were implemented during the 2019-20 season.
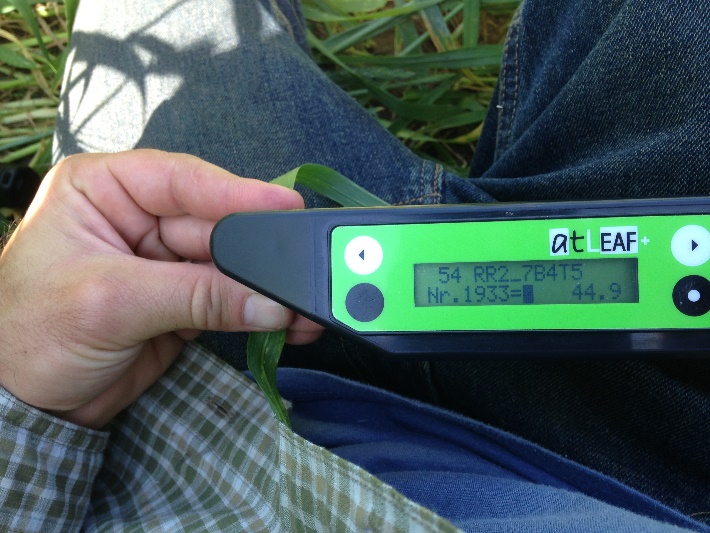
Another device we are using to monitor plant N is the atLEAF CHL by FT Green LLC, which is a chlorophyll meter that measures light absorbed by a single leaf (Figure 3). Like the GreenSeeker, it also emits and detects light. The atLEAF CHL, however, measures how much light passes through a single leaf instead of measuring reflected light. This information becomes increasingly valuable as an indicator of whether or not the crop has sufficient N as it begins heading out and filling grain.
Step-by-step instructions for using both the GreenSeeker and atLEAF CHL in small grains are available at ucanr.edu/blogs/blogcore/postdetail.cfm?postnum=42903.
Since plant N is strongly related to plant greenness and chlorophyll content, measurements of NDVI, NDRE and leaf chlorophyll can serve as proxies for relative plant N status within a field. Many factors can affect absolute greenness or chlorophyll values, including variety, crop injury and environmental factors. Because of this, it is important to remember that the absolute values given by these devices are only meaningful when compared to a reference zone like the N-rich zone.
What do the Readings Mean?
Plant reflectance and transmittance measurements are best interpreted by expressing values measured in the broader field relative to the N-rich reference zones, according to the following equation:
Relative value= (Production area value)/(N-rich zone value)
The relative value is sometimes referred to as a Sufficiency Index (SI) and will usually result in a decimal value between 0 and 1. When the SI is below a certain threshold, it indicates that the production area is experiencing detectable N deficiency relative to the N-rich zone. Table 2 shows SI ranges for proximal and remotely-sensed data and the associated plant N status.
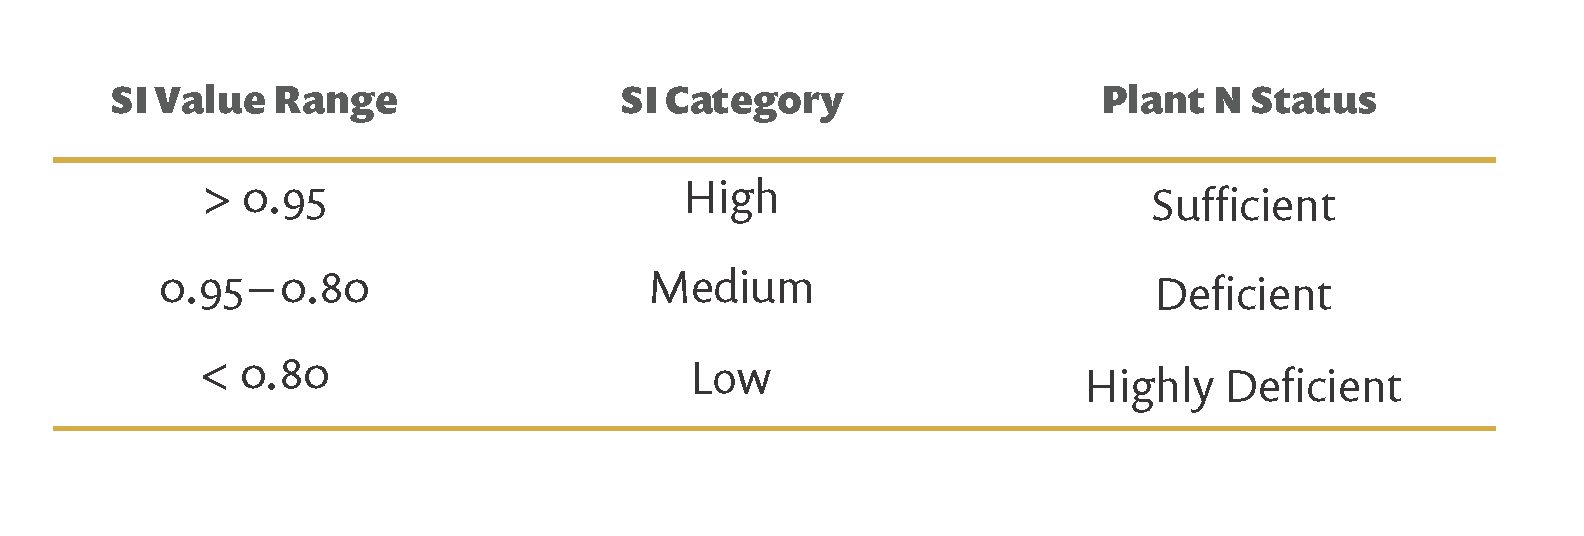
When it comes to deciding on N fertilization in California small grains, a N fertilizer response is almost certain when plant N status is “Highly Deficient”, very likely when the status is “Deficient” and uncertain when the status is “Sufficient”. The SNQT supplements the plant measurements with information about the current nitrate concentration in the root zone.
If a grower decides that a N fertilizer application is warranted based on the combination of plant and soil measurements, the next step is to figure how much N is necessary. This can be determined using a crop growth and N uptake model in conjunction with yield and protein goals. As part of our larger demonstration project, we will be releasing an online decision support tool in 2021 that integrates these components and provides customized predictions of crop response to in-season N fertilizer.
Summary
California farmers are under pressure to increase N use efficiency and reduce the potential for N loss to the environment. N-rich reference zones are a tool that can assist in these goals while considering and managing the risk of reduced yields. By implementing N-rich reference zones, using a suite of tools to monitor them during the season and comparing results to the broader field, a grower gets real-time knowledge to inform N fertilizer management in small grains. The information gained from implementing N-rich reference zones can help growers make fertilizer applications when increased yield and/or protein benefits are likely and avoid them when they are not. These improvements in N fertilizer decision-making can yield better economic and environmental outcomes in California small grain systems.