


Talk to a farmer; at some point, the discussion will focus on the weather. It is the number-one topic discussed amongst farmers because weather can impact farming in significant ways. A rain event in June may benefit one crop but negatively impact another. Weather forecasts are important for scheduling farm activities, and for many years, farmers relied on the Farmer’s Almanac for long-range forecast.
Fortunately, today’s California farmers have multiple options to obtain weather forecasts and real-time data to make farming decisions. One of California’s oldest publicly accessible weather networks is the California Irrigation Management Information System (CIMIS). Built to improve irrigation efficacy, UC Davis and the California Department of Water Resources (DWR) established CIMIS in 1982. CIMIS has provided California growers with weather data accessed via the internet at cimis.water.ca.gov/. Growers can select one of the 145 stations near their property, download the data to a computer and manipulate it for their use (e.g. calculating ET). However, todays farmers are busier than ever, and having to rely on downloading climate data throughout the season can be challenging, especially when data from multiple locations are needed or when there are not any CIMIS stations nearby.
The CIMIS weather station network has been, and continues to be, a valuable tool for agriculture. But growers and researchers need weather data that better represents their farm or research location. Some of California’s first “local weather stations” used in vineyards were hygrothermographs that recorded temperature and humidity. Several UC grapevine pest and disease models were developed and tested in the late 70s and early 80s using hygrothermographs placed throughout California’s vineyards. However, in the late 80s, hygrothermographs were replaced with weather stations equipped with radio telemetry and controlled by a data-collecting base station. Since then, as technology improved, weather stations have become more sophisticated and provide real-time, on-demand data, 24 hours/day.
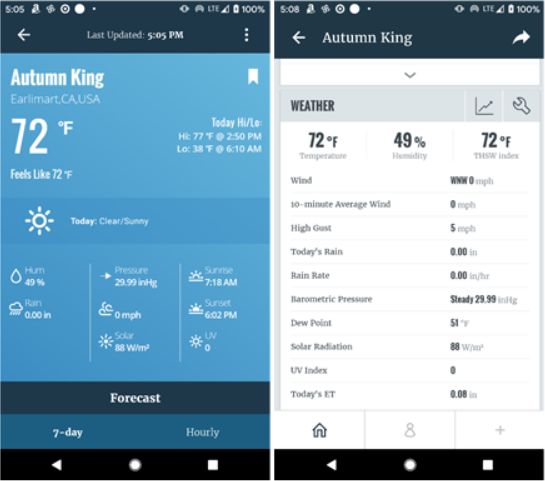
Some of the first weather stations recorded temperature, humidity, precipitation and wind speed and direction, displaying the data as graphs that needed some interpretation. Today’s grape growers have access to the same data, but data presentation is clearer with user-friendly web portals and phone and tablet apps. Additionally, climate, environmental and irrigation sensors have been improved or newly developed to generate data that can be used to make farming decisions (e.g. solar radiation, atmospheric pressure, leaf wetness, plant and fruit growth, plant health, soil moisture, electrical conductivity, pH, nitrogen, phosphorus, potassium, microbial activity, water pressure and usage, and more). Having access to numerous types of data allows growers to manage their vineyards in a much different manner than just a decade ago. However, access to that much data can be overwhelming if it is not understood or managed properly. Growers should be trained or have dedicated personnel to help interpret the information and share it with colleagues that will be making farm management decisions.
Some Practical Uses of Vineyard Weather Station Data
Advanced sensor technology has made it easier for growers to install, build, maintain and expand a reliable in-house network of stations collecting different information. Access to local data helps decision-making that impacts crop yield and quality. For example, in addition to knowing how much precipitation a vineyard experienced during a rain event, information such as leaf wetness, relative humidity, soil moisture and wetting depth can help forecast diseases (i.e. bunch rot), future fertilizer and irrigation applications and general vineyard activity that involves tractor work. Combine that information with vineyard characteristics (i.e. variety, soil type, etc.) and suddenly growers can evaluate more acres with fewer vineyard visits that save them time and money. The improved collection and transmission of data from base (aka weather) stations equipped with unique sensors have become valuable tools for managing vineyards. Base stations now incorporate weather, phenological, pest and disease models developed by university researchers to enhance their offerings via portals and apps. The following are some additional applications that can benefit grape growers interested in designing their own network of sensors.
Pesticide Applications
Pesticide applications must follow California’s laws and regulations. Prior to any application, climatic conditions must be checked so pesticide applications are optimized. Having a base station within a vineyard can improve pesticide application efficiency and efficacy. An anemometer, which measures wind speed and direction, can help pesticide applicators decide if wind conditions will permit a pesticide application. Wind speeds need to be between 2 to 10 mph to make a legal application. Knowing the wind direction can help decide the potential movement of a pesticide to an undesirable target (i.e. organic field). Tracking vineyard temperature can help determine if temperatures are hot enough to cause spray mist evaporation or phytotoxicity. In that situation, waiting for daytime temperatures to cool or spraying at night could help solve the issue. Being able to check a vineyard’s temperature prior to sending a crew to apply pesticides will save time, money and improve pesticide planning. Temperature sensors can also be used to detect inversion layers that can contribute to pesticide drift. Placing temperature sensors at multiple heights (e.g. 5 feet and 30 feet) will determine if the lower layer is cooler than the upper layer. When this happens, pesticides can move horizontally from thousands of feet to miles from the original point of application. When a vineyard experiences inversion layers, temperature sensors and a base station can detect the scenario and send an alarm to the person planning pesticide applications.
Degree Days and Temperature Modeling
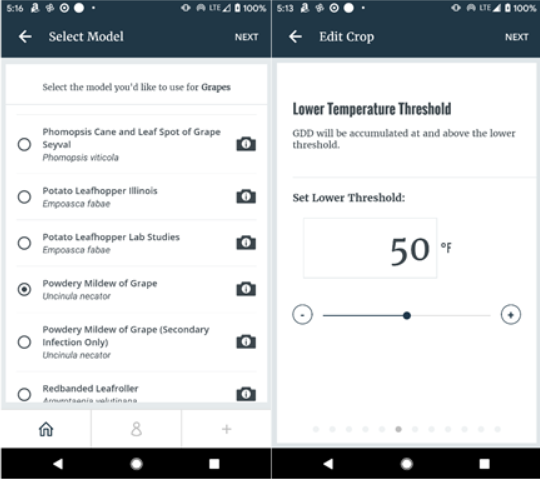
Temperature, measured in degree-days (DD), influences grapevine growth throughout the season. From grapevine bud dormancy to fruit maturity, temperature regulates vine and fruit development. DD model predictions can help growers prepare for seasonal cultural practices (i.e. bloom sprays). For grapes, temperatures greater than 50 degrees F have been determined as the developmental DD threshold. In California, Thompson Seedless development as a function of DD has been determined. Approximately 50% bud break for this cultivar is observed when 155 DD are obtained with a February 20th start date. To reach 50% bloom, an additional 741 DD are needed, with maturity reached between 2880-3240 DD. A grower can use this information to track and identify DD specific to the varieties that they grow that have similar growth characteristics to Thompson Seedless. UC has also developed DD models for western grape leafhopper, omnivorous leafroller, powdery mildew and other pests and diseases to help grape growers make management decisions.
Chilling Hours
Grapes require a specific number of chill hours to complete dormancy, break bud and begin a new season. The minimum number of chill hours required for grapes to produce a commercially viable crop averages approximately 150 hours, which is low compared to stone fruit (i.e. cherries, peaches, etc.) that need ≥800 hours. Without adequate chill hour accumulation, bud break and yield become erratic, increasing farming costs significantly. Knowing when chill hour requirements are not being met can help a grower decide when to apply chemicals that improve bud break. A local weather station can better define chill hour accumulation than regional weather data (i.e. CIMIS). Most weather stations can automatically calculate the chill hours and portions. The chill portions algorithm accounts for warmer times of the day and presents a clearer forecast for predicting cold temperature needed for uniform bud break. More information about chill hour accumulation can be found here: fruitsandnuts.ucdavis.edu/Weather_Services/chilling_accumulation_models/about_chilling_units/.
Worker Protection
Worker protection is undoubtedly one of the most important responsibilities a grower has when people are working in the vineyard. Excessive UV or heat exposure can result in chronic and acute health issues. Weather stations not only track and monitor adverse weather conditions, but can also be programmed to send warning emails prior to critical UV or heat events. Since growers must record these events, weather station data is an easy way obtain documentation.
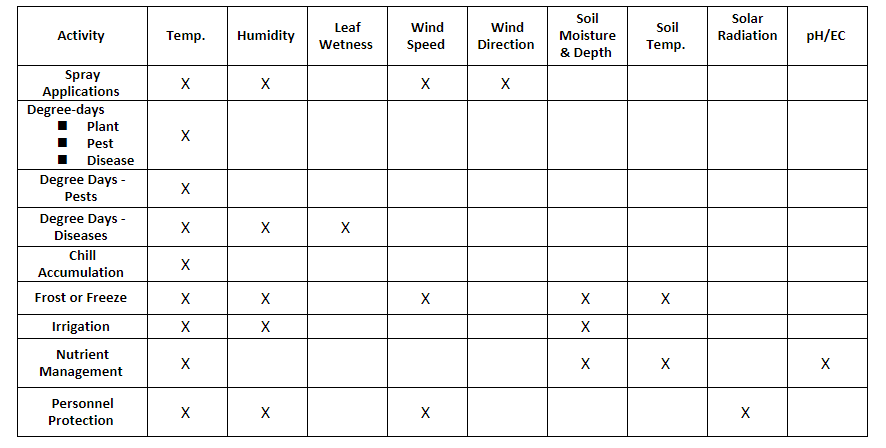
Weather stations have many uses in the vineyard beyond temperature and precipitation. The complexity of the station will depend on a grower’s need. They can generate an enormous amount of data that will need to be interpreted correctly so good decisions can be made. Table 1 shows what types of information can be determined from the different kinds of sensors.
Selecting a Weather Station that Makes Sense
Purchasing the right weather station will depend on the type of data needed to meet your needs. With multiple weather station options, growers can design a simple or complex weather station network that best suits their farm operation. Working with a weather tech company will help a grower determine their specific needs. After an initial needs assessment, a few follow-up meetings with a vendor will help finetune a weather network design. A 40-acre vineyard might easily be covered by a single station, especially when site characteristics are similar (i.e. climate, soil). However, using a single station to cover a 400-acre vineyard could result in misinterpreted climate data that may vary over a large property. Advancements in communication and sensor technologies now make it possible to have multiple sensors communicate remotely with a base station and have the information organized into an easy-to-read format.
Hardwired vs Solar Panel
The decision to use hardwired or solar power will depend on where the station will be located. Easy access to electricity and/or communication lines is usually the determining factor. Open space near buildings or rooftops are sometimes preferred because electricity is in close proximity. If in-field hardwired installation is preferred, wires placed in conduit to the correct depth and properly wired will be needed to avoid damage or interference with data collection. Solar-powered stations have become more affordable and are also easy to install. Solar panels and batteries will need to be checked and maintained biannually to avoid data collection interruptions. Whichever type you choose, it’s important to avoid installing stations near tall objects (e.g. trees, utility poles, buildings), paved roads or bodies of water because they will interfere with data collection. Poor site selection can result in poor data collection.
Number of Soil Moisture Sensors Per Acre
Temperature, humidity and wind speed and direction are less variable than soil moisture and can be located in one or two areas that represent the property (e.g. pump station). However, the number of soil moisture sensors required per block will depend on how variable the soil texture is. If soil and topography are homogeneous (i.e. uniform), and several blocks have similar characteristics (e.g. cultivar, rootstock, age, irrigation and management), two or three sampling points should be sufficient. Soil moisture measurements should be set at a minimum of one, three and five-foot depths to determine water movement. However, soil moisture sensors can take measurements every foot, which may be needed for certain situations. Additionally, if a vineyard has different types of soils that represent different blocks, multiple soils moisture sensors may be needed to collect accurate data for irrigation scheduling.
Basic vs High-End Stations
All weather stations will provide some type of climate data, but vineyard size (acres), one’s knowledge and confidence in interpreting the data and data access frequency will help you identify they type of weather station that’s right for your operation. A basic station will offer traditional climate data like temperature, humidity and, in some cases, rainfall amounts. In addition to traditional climate information, more sophisticated weather stations will include wind speed, soil moisture, water pressure and amounts, etc. that will result in a lot of data that someone will need to track if weekly decisions are going to be made. It’s important to evaluate the presentation of the data that weather station vendors offer. Portals and apps have simplified the way that growers see and use large amounts of data, which makes it easier for vineyard decisions to be made. If you have a larger operation or want to have a more automated system, a station that is connected to the internet can be a better option. With this station, you will be able to collect the data in real time in the field or remotely. General and more detailed data can be accessed from your computer or phone app. Some manufacturers offer services to set alarms for pest and diseases based on models, degree days and chilling days. The alarms can be sent to your phone via text, email or automated call. Services varies from providers.
No matter what type of base station and sensor configuration you choose to purchase, it is important that you first identify what information will help you make better management decisions. Additionally, you should identify someone that will be tasked with monitoring the system and sharing information with farm personnel. This person should be involved in the discussions with the vendor(s) since they will also be in constant contact with the vendor’s customer service representative.


 Invading California")

