


California relies heavily on groundwater, with 40% of annual demand supplied by aquifers during non-drought years and upwards of 60% during dry years. Approximately 83% of people in California receive part of their annual supply from groundwater, and many communities are exclusively reliant on well water for both ag and domestic purposes(3). Chronic groundwater overdraft, estimated at 2 million acre-feet per year since the 1960s, leaves California communities and farmland vulnerable to water shortages and rising surface water and pumping costs(1).
Groundwater depletion also causes subsidence, or land sinkage, as dry aquifers collapse. Subsidence damages infrastructure, such as roads, powerlines, pipes and canals. The California Aqueduct’s flow capacity has reduced due to increasing subsidence rates, with some areas surrounding the infrastructure sinking almost 1.25 inches per month(4). Groundwater recharge efforts have begun to reverse subsidence in some regions, but aquifer degradation and sunken land is often irreversible, and recharge efforts fail. The collapsed aquifers are irreparably damaged and can no longer store water.
California experienced the worst drought on record from 2012 to 2015, exacerbating groundwater pumping overdraft, water shortages and subsidence. Recharge during rainy years does not replenish the loss, and between 2010 and 2020, roughly 28% of monitored wells in California declined by 5 to 25 feet(3,6,8). State officials responded by passing the Sustainable Groundwater Management Act (SGMA) in 2014 to bring pumping and recharge into balance by 2040. Local groundwater sustainability agencies, tasked with developing recharge implementation plans, will likely include Agricultural Managed Aquifer Recharge (AgMAR) to meet requirements and balance the groundwater pumping budget(7).
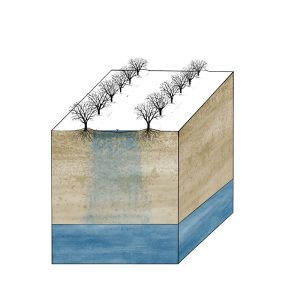
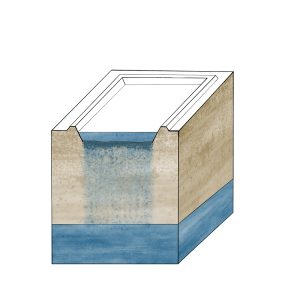
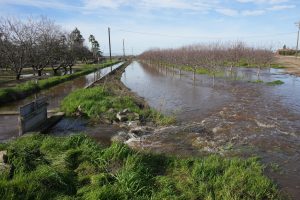
On-farm groundwater recharge methods include winter flooding, skipped row flooding, subsurface reverse tile drainage, recharge ponds and unlined canals or irrigation ditches. Traditional recharge methods like drainage basins require land dedicated solely to water percolation, limiting groundwater banking with high infrastructure construction costs and spatial constraints. Winter surface flooding on irrigated agricultural land can be implemented widely at low cost and with few infrastructure or management changes at the field level. With 5 million acres of California farmland suitable for AgMAR, groundwater banking can scale up dramatically if even a small percentage of acreage can dually purpose for recharge during rainy years(3,6).
University research and early commercial implementation on orchards, vineyards and other crops indicate AgMAR can effectively recharge aquifers and benefit production in multiple ways(3,5,6,7). AgMAR helps growers and landowners secure irrigation water availability for dry years while preventing further aquifer degradation and subsidence. When properly managed, recharge efforts can also improve soil quality by leaching excess salinity below the root zone. Well water quality also improves when clean stormwater dilutes nitrate and total dissolved solids (TDS) accumulated in the basin after years of ag chemical leaching and pumping overdraft. Better soil and irrigation water quality improve crop health and fertilizer use efficiency, leading to lower production costs or increased yield and crop quality.
Implementation
Growers and landowners implementing AgMAR must consider soil suitability for recharge, crop tolerance, water application timing and field management practices to protect both crop health and groundwater quality. Research and field studies conducted over the last 10 years can guide site selection and implementation, but land managers must evaluate their own soils and crops to adjust AgMAR protocols to fit the unique conditions at each ranch.
Site Selection
The Soil Agricultural Groundwater Banking Index (SAGBI), developed by Toby ‘O Geen and collaborators at UC Davis, provides a scoring system to determine farmland’s suitability for AgMAR6. SAGBI assigns scores in five categories, including deep percolation, root zone residence time, topography, chemical limitations and soil surface condition. The weighted average of scores in all categories is used to classify ag land as Excellent, Good, Moderately Good, Moderately Poor, Poor or Very Poor for agricultural groundwater banking. The best ground for recharge is on flat land with sandy or sandy loam soils. Ideally, the soil should have fast water penetration and infiltration, and little to no chemical limitations such as high salinity, nitrates or pesticide residue that could contaminate groundwater if leached into the basin(6,8).
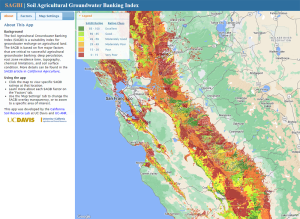
Over 17.5 million acres of farmland in California have been scored using data from the USDA-NRCS Soil Survey Database, and 5 million acres were rated as Excellent, Good or Moderately Good for AgMAR. Most of the land suitable for recharge is found in the eastern Central Valley as well as some locations in Santa Maria, Salinas and Napa(6).
Land managers can look up their ground’s SAGBI score on UC Davis’ web-based mapping app at casoilresource.lawr.ucdavis.edu/sagbi/. Recharge suitability indicated by SAGBI scores should be verified on the field level by soil testing and site evaluation prior to AgMAR implementation.
Crop Suitability
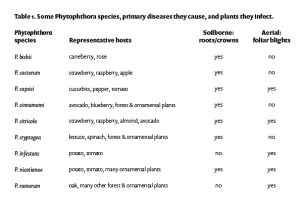
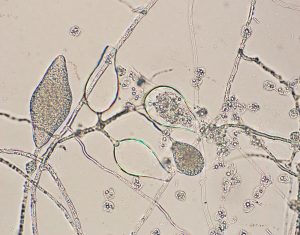
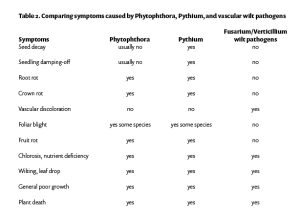
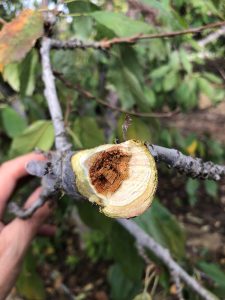
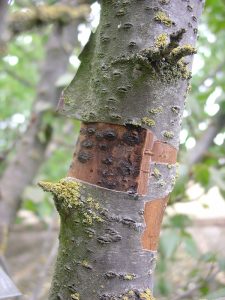
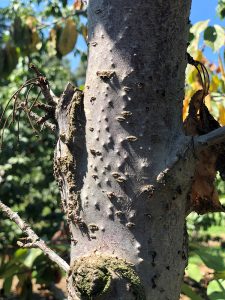
Crop suitability for AgMAR depends on tolerance to soil saturation, crop value and financial risk, and likelihood of nitrate leaching due to typical fertilization patterns. Groundwater banking on agricultural lands is safest during winter dormancy or when fields are fallow. Surface applications typically flood the field with 6 to 8 inches of water that drains in a week or less depending on soil permeability(2,3,5). Oxygen levels in the soil decline due to standing water, and if saturation persists for too long, the crop’s roots may be harmed. Stressed and damaged root systems cannot absorb water and nutrients effectively, resulting in yield decline later in the season. Damaged roots are also more vulnerable to soilborne diseases such as phytophthora and fusarium, so fields with known disease pressure may not be good candidates for recharge(5,7). Growers can avoid root damage and even improve soil health by choosing appropriate fields and planning surface application to match soil drainage rates and crop tolerance thresholds.
Crops suitable for AgMAR include alfalfa, wine grapes, tomatoes, almonds and other tree nuts. Annual cropping fields can also be used for recharge during the fallow period between plantings. Alfalfa presents a good candidate for recharge because its relatively low value poses less financial risk compared with specialty crops if recharge damages production. AgMAR field experiments with alfalfa found no decline in root health or yield after winter flooding on well-draining soils, demonstrating growers can safely carry out recharge programs if the crop is in its dormant stage. Since alfalfa is sensitive to soil saturation during the growing season, researchers suggest rotating recharge sites to older crops scheduled for replanting the following year, especially if flooding events are expected in late winter or early spring(3,7).
Trees and vines are excellent candidates for groundwater banking, if flooded during winter dormancy, well before budbreak. Crop sensitivity to water logging varies with rootstock, but growers are advised to limit standing water duration to two days to avoid root damage. Wine grapes are fairly tolerant to soil saturation, and since they typically receive less nitrogen fertilizer than other crops, residual nitrate levels during the winter are low. Tomatoes, almonds and other tree nuts generally receive higher nitrogen application rates, posing greater risk to groundwater quality if excess nitrate leaches during flooding events. Low nitrate levels and saturation tolerance position vineyards as the safest crop candidate for recharge, but groundwater banking will be more effective if implemented on the state’s vast almond acreage as well(5,8).
UC Davis research funded in part by the California Almond Board demonstrated AgMAR efficacy on two commercial almond orchards in the Central Valley from 2015 to 20175. Researchers applied a total of 24 inches of water per year, split into multiple flooding events during winter dormancy for two consecutive years. One of the orchards, located near Dehli, Calif., has highly permeable, sandy soil. The second orchard, located in Modesto, has moderately permeable, sandy loam soil. Flood water at both locations percolated below the root zone in less than a week, and researchers found no negative impacts on tree water status, root health or yield at either site. Winter flooding proved an efficient recharge method, with over 90% of applied water percolating below the root zone on the sandy soil and over 80% percolation on the sandy loam. Similar studies on pistachios, wine grapes and tomatoes also resulted in effective groundwater banking while maintaining root health and productivity(2,3,5).
California almond growers have begun implementing AgMAR on their own orchards with promising results. Mark McKean, a prominent grower in the Fresno area, began testing flood irrigation and recharge in 2010, and by 2020 he had experimented with groundwater banking on 350 acres. In 2016, McKean banked 2 ac-ft/ac and in 2019 1.4 ac-ft/ac on a three-year-old almond orchard. McKean found better percolation when flood water was applied for short durations rather than one long set, and he reduces his fall nitrogen application rate on fields slated for winter recharge to prevent excess nitrate leaching below the root zone(7).
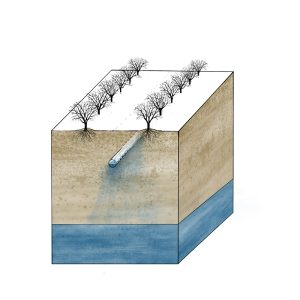
Other growers have installed subsurface groundwater banking systems to pump recharge water below the root zone and bypass the risk posed by surface flooding. Diverted stormwater or other source water is piped down to a reverse tile drain system at least 8 feet below the soil surface. Several subsurface systems have been installed in the Central Valley since they were introduced in 2017, and some water districts offer incentives programs to help cover the costs. Subsurface recharge systems are expensive to install, but they facilitate high recharge volumes without impacting roots and crop health(7).
Water Quality Considerations
Groundwater banking on ag lands has the potential to significantly improve water resource security in California, but AgMAR poses a risk to groundwater quality if excess salts, nitrates and other residual contaminants are leached down to aquifers. Preliminary soil testing can assess field suitability for recharge before each rainy season, and sites with excess nitrate, salinity or pesticide residue may be passed up in favor of sites with optimum chemical characteristics. Fields with higher residual contamination may still be good candidates for recharge if enough clean stormwater is available to dilute nitrate and salinity down to safe drinking water quality standards. Growers can also prepare for winter recharge by reducing the proportion of annual nitrogen fertilizer applied in the fall.
Residual contaminants in the vadose zone, the unsaturated area between the soil and the groundwater table, may also pose a risk to groundwater quality. Salts, nitrate and ag chemicals accumulated in the vadose zone after years of commercial agriculture may be mobilized by high-volume recharge events and leach down to the groundwater basin. Hannah Waterhouse and colleagues at UC Davis analyzed soil core data down to 30 feet on 12 fields in the Kings groundwater basin to quantify potential risk of nitrate and salt contamination to aquifers8. The study compared the effects of soil permeability, crop type and fertilizer management on nitrate and salt accumulation in topsoil and below. Fields with lower water infiltration rates had higher nitrate and salinity levels compared with more permeable ground. Soils with slower water infiltration rates stored on average 732 lbs N/ac while lighter, well-draining soils stored 542 lbs N/ac within the 30-foot profile(8). Information gleaned from this study and other research can help determine the source and volume of water required for recharge at each site to ensure that leached contaminants are sufficiently diluted to protect well water quality.
Crop type and grower management also strongly affected nitrate and salinity levels. High nitrogen application rates on tomatoes and almonds were reflected in the soil profile, while wine grapes with lower N applications and deep root systems almost always contained the lowest nitrate levels. Elevated residual nitrate found on one outlier vineyard was explained by the grower’s fertilizer management. While other wine grapes received split N applications, the field with unusually high residual nitrate received the entire year’s N supply in one shot at the beginning of the season, demonstrating management’s strong impact on nitrate leaching8. Regardless of crop type, growers implementing AgMAR can protect underlying groundwater by testing the soil’s N level in fall and adjusting fertilizer management to prevent nitrate leaching.
Groundwater quality monitoring and collaboration between growers, researchers and water agencies will help to safely implement AgMAR and improve recommendations to meet differing requirements at each ranch. Further research is required to understand how the vadose zone’s characteristics will impact groundwater quality in response to AgMAR, but initial studies indicate that the benefits of recharging our groundwater basins outweigh the potential risks when appropriate sites and field management strategies are implemented.
Average groundwater overdraft in California is estimated at about 2 million acre-feet per year, and from 2005 to 2010, the Central Valley alone overdrafted an estimated 1.1 to 2.6 million acre-feet(1,6). Pumping restrictions required by SGMA may cause between 750,000 and 1 million acres of agricultural lands to go fallow without new supply mitigation measures(7). Agricultural lands rated as Excellent or Good by SAGBI can percolate an estimated 1 foot of water per day, and if AgMAR were implemented on suitable wine grape acreage in the Central Valley, growers could bank 460 million acre-feet of water per day(6,8). AgMAR implementation at scale will require supply rights and infrastructure to divert excess stormwater to agricultural fields, but SGMA funding and compliance deadlines will likely motivate stakeholders to facilitate on-farm groundwater recharge efforts. Thousands of acres of wine grapes, almonds, alfalfa and tomatoes are planted on land suitable for groundwater banking, giving growers an opportunity to secure water resources for future crop production and their communities.
References
1. [CDWR]California Department of Water Resources. 2009. Bulletin 160–09: California water plan update. Sacramento (CA): California Department of Water Resources. http://www.waterplan.water. ca.gov/cwpu2009/.
2. Levintal E, Kniffin M, Ganot Y, Marwaha N, Murphy N, Dahlke H (2022): Agricultural managed aquifer recharge (Ag-MAR)—a method for sustainable groundwater management: A review, Critical Reviews in Environmental Science and Technology, DOI: 10.1080/10643389.2022.2050160
3. Dahlke H, LaHue G, Mautner M, Murphy N, Patterson N, Waterhouse H, Yang F, Foglia L. 2018. Chapter Eight – Managed Aquifer Recharge as a Tool to Enhance Sustainable Groundwater Management in California: Examples From Field and Modeling Studies. Editor(s): Jan Friesen, Leonor Rodríguez-Sinobas. Advances in Chemical Pollution, Environmental Management and Protection. Elsevier, Volume 3: 215-275. ISSN 2468-9289. ISBN 9780128142998. https://doi.org/10.1016/bs.apmp.2018.07.003.
4. Lopes et al. 2017. California Aqueduct Subsidence Study. California Department of Water Resources, Division of Engineering, San Luis and San Joaquin Field Divisions. https://water.ca.gov/-/media/DWR-Website/Web-Pages/Programs/Engineering-And-Construction/Files/Subsidence/Aqueduct_Subsidence_Study-Accessibility_Compatibility.pdf
5. Ma X, Dahlke H, Duncan R, Doll D, Martinez P, Lampinen B, Volder A. 2022. Winter flooding recharges groundwater in almond orchards with limited effects on root dynamics and yield. Calif Agr 76(2):70-76. https://doi.org/10.3733/ca.2022a0008.
6. O’Geen AT, Saal M, Dahlke H, et al. 2015. Soil suitability index identifies potential areas for groundwater banking on agricultural lands. Calif Agr 69:75– 84. https://doi.org/10.3733/ ca.v069n02p75
7. Roseman J, Lee E, Asgil L, Mountjoy D. 2021. Almond Board of California, Document #2021R0060. https://www.almonds.com/sites/default/files/2021-12/WO-6177_ABC_GroundwaterRecharge_Web_SinglePage.pdf
8. Waterhouse H, Bachand S, Mountjoy D, Choperena J, Bachand P, Dahlke H, Horwath W. 2020. Agricultural managed aquifer recharge — water quality factors to consider. Calif Agr 74(3):144-154. https://doi.org/10.3733/ca.2020a0020.


")


 Invading California")

